First Spring Showers
March is a troubled month - capable of blizzards, subzero cold, river flooding and tornadoes. Sometimes all in the same week.
We spring forward to Daylight Saving time late
tonight, and Mother Nature must have gotten the memo. A surge of milder
air aloft sparks rain much of today, which is problematic.
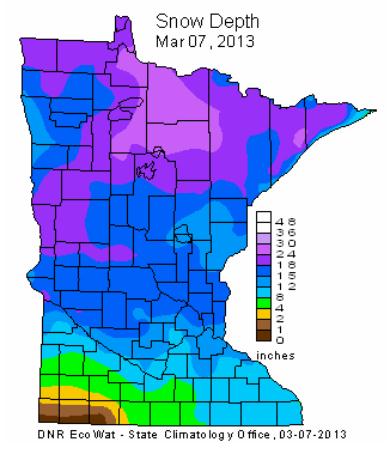
The ground is frozen to a depth of 20-40 inches.
Melting snow may spark minor flooding of streets, intersections and
poor drainage areas. So many years we go from drought to flood in the
blink of an eye. I wonder if 2013 will be one of those years?
A changeover to wet snow tonight may drop a few
inches of slush; heavier amounts over Iowa. As if the atmosphere can't
quite decide whether it's spring or winter. We're on the cusp.
Skies clear Sunday, a puff of cooler air gives
way to another thaw late next week; long range models hinting at 50F
after March 20.
No more bitter blasts brewing; we've probably seen the last of the subzero chill for the metro area.
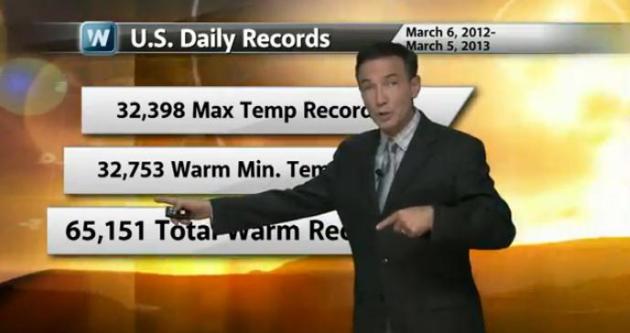
On the weather blog below: NOAA NCDC reports
over 65,000 new daily warm weather temperature records, nationwide, in
the last 12 months. Compared with 17,000 cold weather records.
More data points in the climate puzzle.
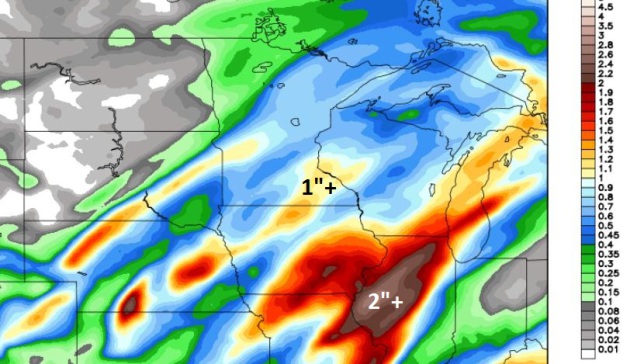
First Spring Showers. In
reality it will be more of a steady rain today, possibly freezing on
contact with sub-freezing surfaces early (watch the bridges and
side-streets before 8 am). As much as 1" of liquid precipitation may
fall by tonight, falling mostly as rain. Had the mercury been 3-5 F
colder we'd be looking at 8-12" of slushy snow, instead of (mostly)
rain.
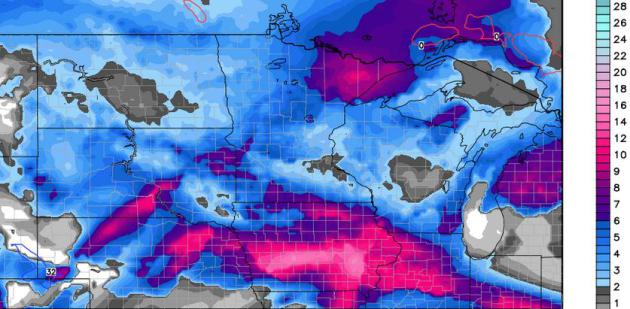
European Model Snowfall Prediction.
The ECMWF is no magic bullet, but it seems to (fairly consistently)
outperform most of the U.S. weather models; everything from storm track
to precipitation amounts. The model is keeping the heaviest snow south
of Minnesota, maybe an inch or two of slushy snow tonight.
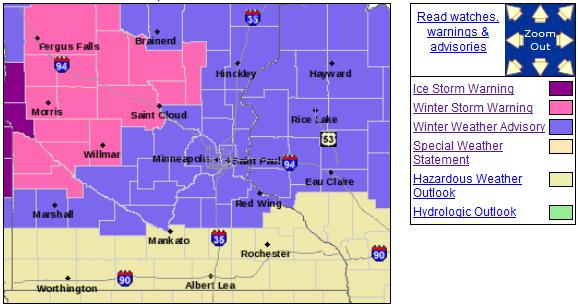
Ice - Rain - Snow. The Twin
Cities metro is under a Winter Weather Advisory, Winter Storm Warnings
posted from St. Cloud to Morris, Alexandria and Fergus Falls (for more
ice and wet snow mixing with rain). Details on the advisory from the
NWS:
...WINTER STORM EXPECTED OVER PORTIONS OF WESTERN AND CENTRAL
MINNESOTA TONIGHT THROUGH SATURDAY EVENING...

...A PERIOD OF FREEZING RAIN AND SOME SLEET EXPECTED ELSEWHERE
TONIGHT AND SATURDAY MORNING...

.AN AREA OF LOW PRESSURE SHIFTING EAST FROM THE CENTRAL PLAINS
INTO THE MID MISSISSIPPI RIVER VALLEY TONIGHT THROUGH SUNDAY WILL
SPREAD A MIXTURE OF FREEZING RAIN AND SLEET ACROSS THE REGION
TONIGHT. THE FREEZING RAIN AND SLEET WILL TURN TO ALL SNOW
NORTHWEST OF A LINE FROM GRANITE FALLS TO LAKE MILLE LACS BY
SATURDAY EVENING. ICE ACCUMULATIONS OF ONE QUARTER TO ONE THIRD
INCH CAN BE EXPECTED THROUGH SATURDAY MORNING FOLLOWED BY 2 TO
4 INCHES OF SNOW THROUGH SATURDAY EVENING. FURTHER EAST ACROSS
SOUTHERN AND EASTERN MINNESOTA AND WESTERN WISCONSIN...A PERIOD
OF FREEZING RAIN AND SOME SLEET IS EXPECTED TONIGHT AND EARLY
SATURDAY BEFORE TRANSITIONING TO ALL RAIN SATURDAY AFTERNOON. ICE
ACCUMULATIONS IN THESE AREAS WILL GENERALLY RANGE FROM A TENTH TO
ONE QUARTER INCH.
Amazing Numbers. From Dr. Mark Seeley's
WeatherTalk Newsletter:
Score card for USA climate records in the past 12 months
"
The NOAA National Climatic Data Center reported the following
new daily record values in the USA for the past 12 months (March 6,
2012 to March 5, 2013), an extraordinary year for record setting:
32,398 new daily maximum temperature records
32,753 new daily warm minimum temperature records
10,525 new daily cold maximum temperature records
6,757 new daily minimum temperature records
28,398 new daily precipitation records
5,979 new daily snowfall records
Obviously the warm signal of climate is dominant in these statistics, with over 65,000 new daily warm temperature records (both max and min) set across the USA in the past 12 months."
Lopsided Temperature Records. Looking at the last 12
months, NOAA NCDC reports nearly 4 times more record highs than record
lows, nationwide. Granted, one year does not a trend make. But there's a
larger trend: 335 months/row with global temperatures warmer than the
20th century historical average. Details in this edition of
WeatherNation
Climate Matters: "
While
this winter may have seemed harsh, temperatures were above normal for
more than half of the United States. And when you look at the last 12
months as a whole, warm weather records far outweighed cold weather
records. Meteorologist Paul Douglas takes a look at the big picture
temperature trends."
Climatology Update. Here's a highlight of the
latest update from Minnesota State Climatologist Greg Spoden:
- February average monthly temperatures in Minnesota were 2-4 F below
the historical average. For a number of communities it was only the
second time in 21 months that the mean monthly temperature was below
average.
- February precipitation totals were above historical averages
statewide. Monthly precipitation totals topped the historical average by
approximately one-half inch in many locations, and by over 1" in west
central and north central Minnesota counties.
- For most of the state, the water content of the
snow pack
is estimated to be 2-4 inches. Some west central , north central, and
northeast Minnesota counties report snow water equivalence values in
excess of 4".
- Because of solidly frozen topsoils and high snow water content in
west central Minnesota, the National Weather Service warns of a high
risk of moderate to major spring flooding along the Red River. This
could lead to an ironic paradox where most of the soil profile will
remain dry after floodwaters recede.
- The U.S. Drought Monitor continues to place large portions of
Minnesota in the Extreme Drought category. In total, 70% of Minnesota's
landscape is considered to be in Extreme Drought or Severe Drought. This
is down from 84% in late January. A one-category improvement was
assigned to some west central and north central Minnesota counties due
to heavy February snowfall.
- Despite the amount of water on the landscape, the drought situation
will likely remain unchanged until spring. The deeply and solidly
frozen soil assures that very little winter precipitation will make it
into the ground. As of late autumn, the soil moisture content in the
plant rooting zone was near an all-time low evel at many locations.
Without
abundant spring rains, a number of critical drought issues involving
agriculture, forestry, horticulture, tourism and public water supply
will begin to emerge.
Flood Risk Increases With March Snowfall. Fargo's
INFORUM has more details on the snow pack over the Red River Valley impacting the (growing) risk of spring river flooding: "
Early
March snowfall has raised the risk of major flooding on the Red River,
the National Weather Service said today in its latest flood outlook.
In Fargo, the chances of the Red River topping major flood stage of 30
feet jumped from 79 percent to 88 percent since the last flood outlook
on Feb. 21. There’s a 50 percent chance the river will rise above 33.8
feet, up from a 50 percent chance at 33.2 feet in the Feb. 21 outlook.
The Red has a 5 percent chance of surpassing 38.2 feet, up from 37.8
feet in the last outlook. City officials say Fargo is well-protected to
38 feet without the need for sandbagging..."
In A Warming World Storms May Be Fewer, But Stronger. Here's a clip of a story at
NASA's Earth Observatory: "...
Given
all the change that has already take place, it’s reasonable to wonder
if climate change has affected storms as well. “After the tornadoes in
2011, I was flooded with calls from reporters,” says Anthony Del Genio,
a climatologist at NASA’s Goddard Institute for Space Studies (GISS).
“People wanted quick, definitive answers. The trouble is that’s not
where the science is.” Historically, research on tornadoes, hurricanes,
and other types of storms has focused on short-term forecasting, not on
understanding how storms are changing over time. Reliable, long-term
records of storms are scarce, and the different reporting and observing
methods have left many scientists and meteorologists feeling
skeptical. But the study of storminess and climate has begun to mature,
says Del Genio, and a consensus is emerging: for several types of
storms, global warming may prime the atmosphere to produce fewer but
stronger storms..."
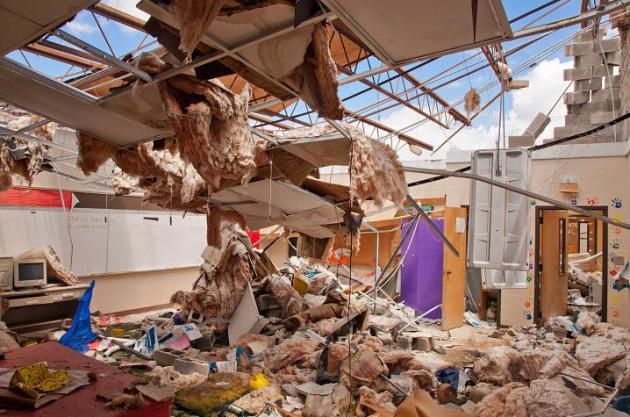
Photo credit above: "
Hackleburg High School in Alabama was destroyed by a tornado in April 2011." (
Photograph courtesy Federal Emergency Management Agency.)
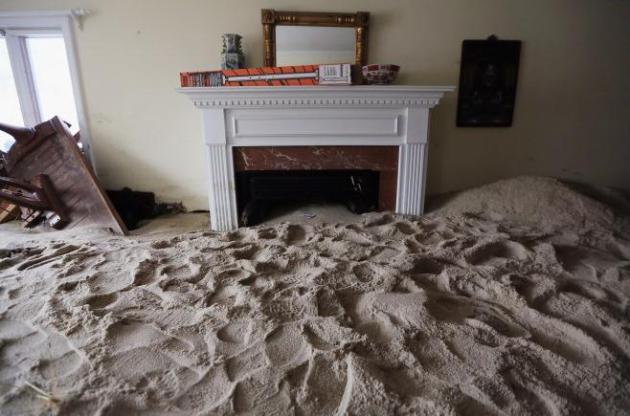
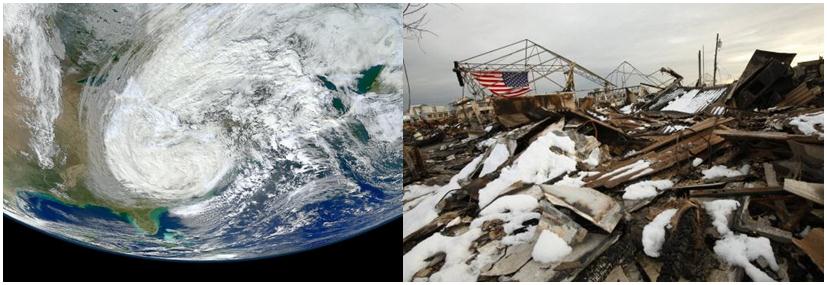
Storm Aftermath Photos That Will Leave You Looking For Higher Ground.
Suddenly Minnesota's lakes look even more inviting. They freeze up in
winter, you can drive on them, but at least we don't have to worry about
towering storm surges. Here's an excerpt from
Wired: "
Mario Tama
spent more than his fair share of 2012 in a helicopter, surveying and
photographing the destruction of some of that year’s many powerful
storms. But it was on the ground where he felt the real impact, as he
photographed the people affected by these extreme meteorological
events. Like Melanie Martinez, a resident of Braithwaite, Louisiana, as
she looked through her flooded house after Hurricane Isaac. “There was
no specific plan to focus on climate change in 2012, as much of what
we do as photojournalists is reactive,” says Tama, a photojournalist
for Getty Images.
“But I suppose the evolution of the project was a natural progression
given the multitude of weather-related events of 2012 in this country.”
His edit of these photos, titled 2012 Climate Change: A New Normal in
America?, just won a Judge’s Special Recognition award in the Environmental Awareness Award category
at Picture of the Year International contest. Climate change is a
broad, diffuse subject, and it’s hard to illustrate it with photographs,
but Tama’s photos capture the sheer size of the destruction while also
humanizing the impacts..."
Photo credit above: "
A living room filled with sand washed in by Superstorm Sandy on Nov. 14, 2012 in Point Pleasant Beach, New Jersey."
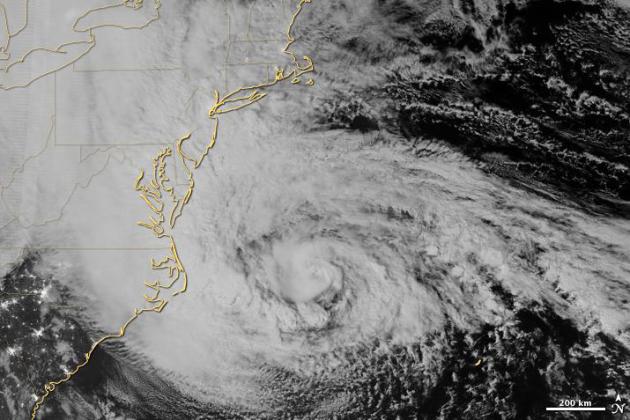
Arctic Ice Loss Amplifed Superstorm Sandy Violence. Details in this post from
Cornell University: "...
The
researchers assert that the record-breaking sea ice loss from summer
2012, combined with the unusual atmospheric phenomena observed in late
October, appear to be linked to global warming. A strong atmospheric,
high-pressure blocking pattern over Greenland and the northwest
Atlantic prevented Hurricane Sandy from steering northeast and out to
sea like most October hurricanes and tropical storms from the
Caribbean. In fact, Sandy traveled up the Atlantic coast and turned
left "toward the most populated area along the eastern seaboard" and
converged with an extratropical cyclone; this, in turn, fed the
weakening Hurricane Sandy and transformed it into a monster tempest.
Superstorm Sandy's extremely low atmospheric pressure and the strong
high-pressure block to the north created violent east winds that pushed
storm surge against the eastern seaboard. "To literally top it off, the
storm surge combined with full-moon high tides and huge ocean waves to
produce record high water levels that exceeded the worst-case
predictions for parts of New York City," write the researchers." (Image above: NASA Earth Observatory).
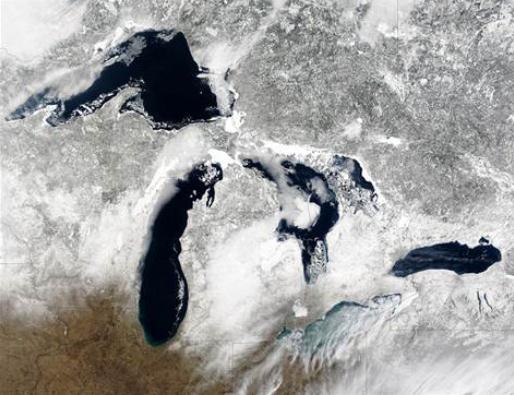
Shrinking Ice Worries Great Lakes Scientists. Here's an excerpt of an article at
The News-Messenger: "..
.Ice
cover has decreased nearly 70 percent on the five Great Lakes since
the early 1970s, according to the National Oceanic and Atmospheric
Administration. The five Great Lakes hold 20 percent of the world’s
fresh water and have more than 11,000 miles of shoreline.
Every one of the lakes has endured the winter meltdown:
• Lake Ontario saw the most dramatic decrease with an 88 percent drop in ice coverage.
• Lake Superior lost 76 percent of its ice.
• Lake Michigan saw a decrease of 77 percent..."
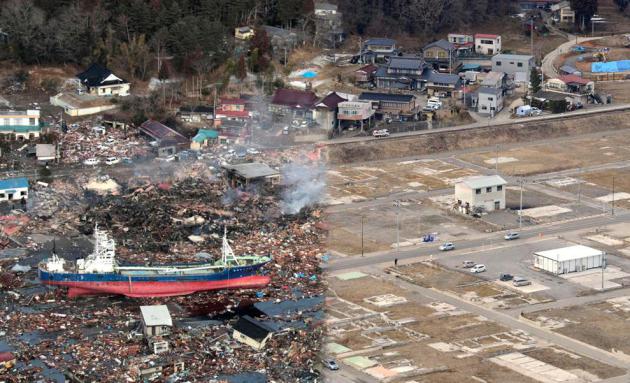
Japan Earthquake, 2 Years Later: Before And After. The Atlantic
has a remarkable story about the Japan earthquake and tsunami, with
some of the most incredible photos I've ever seen; damage on an
unimaginable scale: "
In a few days, Japan will mark the 2nd
anniversary of the devastating Tohoku earthquake and resulting tsunami.
The disaster killed nearly 19,000 across Japan, leveling entire
coastal villages. Now, nearly all the rubble has been removed, or
stacked neatly, but reconstruction on higher ground is lagging, as
government red tape has slowed recovery efforts. Locals living in
temporary housing are frustrated, and still haunted by the horrific
event, some displaying signs of post-traumatic stress disorder.
Collected below are a series of before-and-after interactive images.
Click on each one to see the image fade from before (2011) to after
(2013)..."
Photo credit: "
The tsunami-devastated Kesennuma in Miyagi
prefecture, is pictured in this side-by-side comparison photo taken
March 12, 2011 (left) and March 4, 2013 (right), ahead of the two-year
anniversary of the March 11 earthquake and tsunami that damaged so much
of northeastern Japan."
(Reuters/Kyodo)
You Spend 23 Days/Year On Your Phone, Survey Says.
CNET has the amazing details. Photo:
mashable.com.
 Climate Stories...
Global Temperatures Highest In 4,000 Years
Climate Stories...
Global Temperatures Highest In 4,000 Years. Here's a snippet of a story from Justin Gillis at
The New York Times: "
Global
temperatures are warmer than at any time in at least 4,000 years,
scientists reported Thursday, and over the coming decades are likely to
surpass levels not seen on the planet since before the last ice
age. Previous research had extended back roughly 1,500 years, and
suggested that the rapid temperature spike of the past century,
believed to be a consequence of human activity, exceeded any warming
episode during those years. The new work confirms that result while
suggesting the modern warming is unique over a longer period. Even if
the temperature increase from human activity that is projected for
later this century comes out on the low end of estimates, scientists
said, the planet will be at least as warm as it was during the warmest
periods of the modern geological era, known as the Holocene, and
probably warmer than that..." (Apollo 17 image courtesy of NASA).
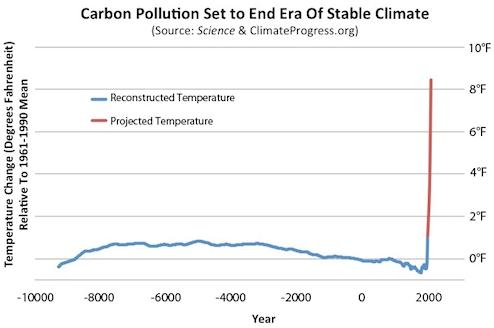
Graphic credit above: "
Temperature change over the past
11,300 years (in blue, via Science, 2013) plus projected warming this
century on humanity's current emissions path (in red, via recent
literature)." Courtesy:
Think Progress.
 Rate Of Warming Since 1900 Is 50 Times Greater Than Rate Of Cooling In Previous 5000 Years
. Here's an excerpt from
Think Progress: "
A
stable climate enabled the development of modern civilization, global
agriculture, and a world that could sustain a vast population. Now, the
most comprehensive “Reconstruction of Regional and Global Temperature for the Past 11,300 Years”
ever done reveals just how stable the climate has been — and just how
destabilizing manmade carbon pollution has been and will continue to be
unless we dramatically reverse emissions trends..." (photo: Wanda Brandt).
 Documentary "Greedy Lying Bastards" Targets Climate Change Deniers
. Here's a clip from Politico: "
The
new documentary “Greedy Lying Bastards” takes on contributors to and
deniers of climate change and accuses many in the energy industry of
lying and putting profits before people. And although director Craig
Rosebraugh says it’s an unfortunate coincidence, he says that recent
events could have helped the marketing of the film. “I don’t think we
could have asked for a better time to release the film,” Rosebraugh
told POLITICO, noting that “thankfully — if you can call it thankfully —
the climate has responded with the severe weather patterns in 2011 and
2012...”
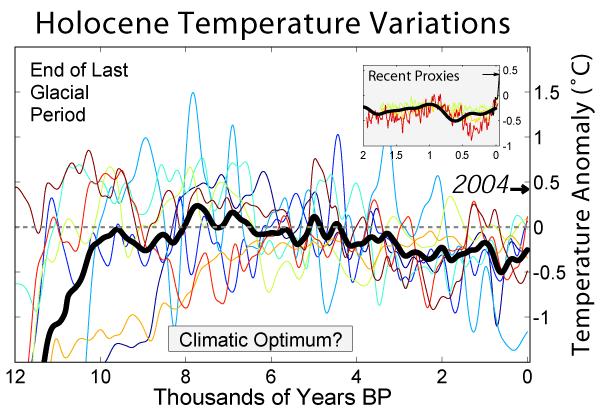
Study: In Just A Century, Globe Shifted From One Of The Coldest Decades In 11,000 Years To Warmest.
The Star Tribune has the story; here's an excerpt: "...
Research
released Thursday in the journal Science uses fossils of tiny marine
organisms to reconstruct global temperatures back to the end of the
last ice age. It shows how the globe for several thousands of years was
cooling until an unprecedented reversal in the 20th century. Scientists
say it is further evidence that modern-day global warming isn't
natural, but the result of rising carbon dioxide emissions that have
rapidly grown since the Industrial Revolution began roughly 250 years
ago. The decade of 1900 to 1910 was one of the coolest in the past
11,300 years — cooler than 95 percent of the other years, the marine
fossil data suggest. Yet 100 years later, the decade of 2000 to 2010
was one of the warmest, said study lead author Shaun Marcott of Oregon
State University. Global thermometer records only go back to 1880, and
those show the last decade was the hottest for this more recent time
period.
In 100 years, we've gone from the cold end of the
spectrum to the warm end of the spectrum," Marcott said. "We've never
seen something this rapid. Even in the ice age the global temperature
never changed this quickly...." (graphic credit
here).
* Andrew Revkin has more on this story at
The New York Times.
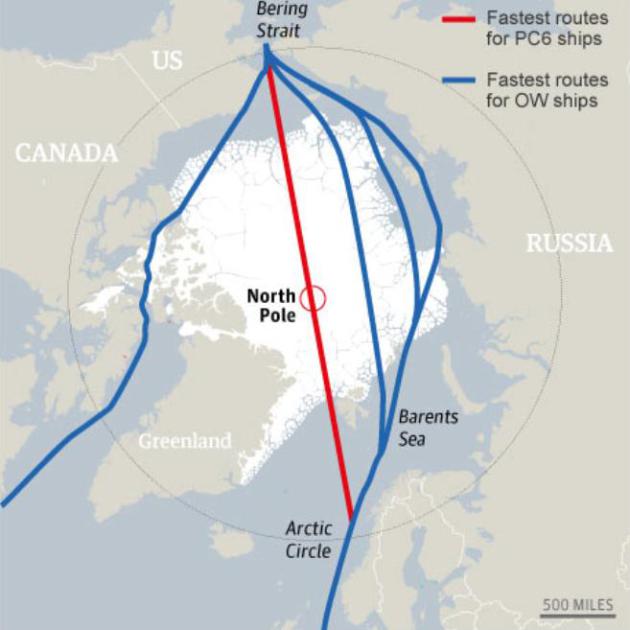
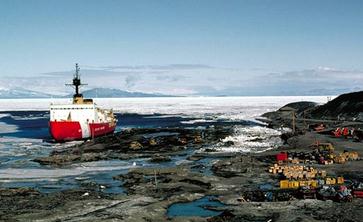
Ships To Sail Directly Over The North Pole By 2050, Scientists Say.
Well this is certainly great news! Who needs that polar ice anyway?
It's probably just there for show - it can't possibly serve a purpose in
nature, right? Here's an excerpt from
The Guardian: "
Ships
should be able to sail directly over the north pole by the middle of
this century, considerably reducing the costs of trade between Europe
and China but posing new economic, strategic and environmental
challenges for governments, according to scientists. The dramatic reduction in the thickness and extent of late summer sea ice
that has taken place in each of the last seven years has already made
it possible for some ice-strengthened ships to travel across the north
of Russia via the "northern sea route". Last year a total of 46 ships
made the trans-Arctic passage, mostly escorted at considerable cost by
Russian icebreakers. But by 2050, say Laurence C. Smith and Scott R.
Stephenson at the University of California in the journal PNAS on Monday,
ordinary vessels should be able to travel easily along the northern
sea route, and moderately ice-strengthened ships should be able to take
the shortest possible route between the Pacific and Atlantic Oceans,
passing over the pole itself. The easiest time would be in September,
when annual sea ice cover in the Arctic Ocean is at its lowest extent..."
Graphic credit above: "
Projected Arctic shipping routes." Photograph: guardian.co.uk
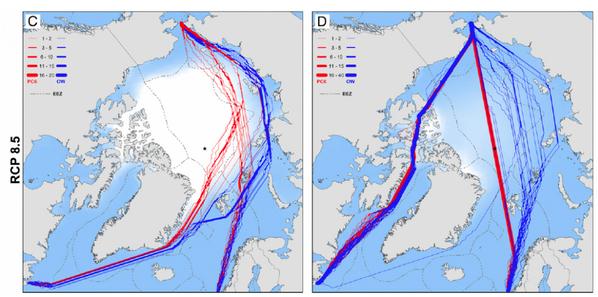
Climate Change Might Open Up Northwest Passage To Shipping By The Middle Of The Century. Here's an excerpt from
Scientific American: "
Investigating
what is sometimes seen as one of the more favorable effects of climate
change, a pair of scientists from UCLA has done a careful analysis
of the melting of Arctic sea ice and concluded that it could lead to
ships traversing the ice-free Northwest Passage (NWP) by 2050. It would
also lead to much shorter transit times through the existing North Sea
Passage (NSR). These developments may greatly reduce the time and cost
of shipping but would also lead to unforeseen economic and geopolitical
complications..."
Graphic credit above: "
Differences in transit routes for
two kinds of vessels (red and blue) enabled by shrinking Arctic ice
levels and opening of the Northwest Passage by 2050." (Image: Smith and Stephenson, PNAS, Early Edition)
Climate Change Will Open Up Surprising New Arctic Shipping Routes. The Washington Post has the story - here's an excerpt: "
Right
now, the Arctic Ocean is still too icy and treacherous for open-water
ships to traverse with any regularity. The Northwest Passage is only
navigable during the summer months once every seven years or so. Too
unreliable for commercial shipping. But that will soon change. As the
planet keeps warming, the Arctic’s summer sea ice is vanishing at a
stunning pace. That rapid melt is expected to have all sorts of sweeping impacts,
from speeding up climate change to wreaking havoc on weather patterns.
On the flip side, the loss of sea ice could also open up some
potentially lucrative new trade routes between the Atlantic and Pacific
Oceans."
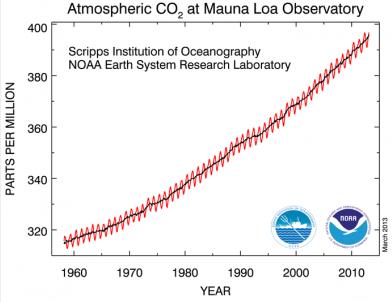
An Inevitable Headline in 2014? CO2 Levels Pass 400 PPM For First Time In Human Existance. Here's the intro to a story at
scienceblogs.com: "
Sometime,
about one year from now, the front pages of whatever decent newspapers
are left will carry a headline like the one above, announcing that for
the first time in human existance (or in nearly a million years, or 3
million years, or 15 million years), the global atmospheric
concentration of carbon dioxide - the principal gas causing climate
change - will have passed 400 parts per million. That’s a significant
and shocking figure. Unfortunately, it is only a temporary marker on
the way to even higher and higher levels. Here (Figure 1 below) are the
most recent (March 2013) data from the Mauna Loa observatory showing
the inexorable increase in atmospheric CO2 and the rapid approach to 400
ppm..."
Graphic credit above: "
The concentration of CO2 in the
atmosphere measured by Scripps/NOAA at Mauna Loa. We’re rapidly
approaching 400 parts per million."
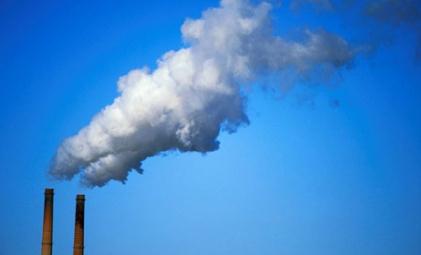
Most Insurers Lack A Plan To Address Climate Change, CERES Says.
Bloomberg has the story - here's a clip: "
Almost 90 percent of insurance companies lack a comprehensive plan to address climate change
and fewer than half of them view it as a likely source of financial
losses, according to a report released today. Only 23 of 184 insurers
surveyed demonstrated a “comprehensive climate change strategy” and 88
said they consider climate change a future loss driver, Boston-based Ceres
said today in a report. “Climate change exists, it’s happening, it’s
going to have an impact,” Mike Kreidler, Washington State insurance
commissioner, said in a phone interview. “It has the potential of being
a real game changer” for investments and underwriting..."
Climate Change And The U.S. Strategy. AOL Energy has an interesting story about the viability of a tax on carbon - here's a clip: "
At
a federal level, major regulation is not foreseeable in the near
future because it will not receive bipartisan support. However,
according to Dr. Joseph Aldy (Assistant Professor of Public Policy, Harvard Kennedy School), a carbon tax
policy project is more possible now than ever before. Dr. Gilbert
Metcalf (MIT's Joint Program on the Science and Policy of Global Change)
supported this view noting that fiscal problems faced by the US are
driving government to seriously consider a carbon tax that will generate
around $100 billion in revenue. Most of the regulation within the next
few years will probably be generated at a state level, where the new EPA director, Gina McCarthy, will closely work with states to create new approaches to tackle the climate change problem..."
Critical Part Of Keystone XL Report Done By Firms With Deep Oil Industry Tries.
Inside Climate News has the story; here's a clip: "
The State Department's recent conclusion
that the Keystone XL pipeline "is unlikely to have a substantial
impact" on the rate of Canada's oil sands development was based on
analysis provided by two consulting firms with ties to oil and pipeline
companies that could benefit from the proposed project. EnSys Energy has worked with ExxonMobil, BP and Koch Industries,
which own oil sands production facilities and refineries in the
Midwest that process heavy Canadian crude oil. Imperial Oil, one of
Canada's largest oil sands producers, is a subsidiary of Exxon..."
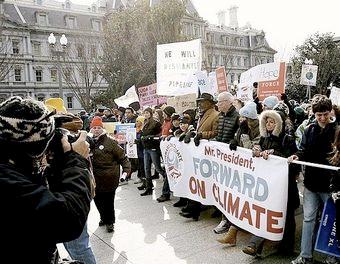
Kevin Trenberth: So What Should Be Done About Climate Change And The Vested Interests? Who
are the real radicals? Is it the people protesting the Keystone XL
Pipeline? Or is it the fossil fuel CEO's who are selling a product that
is altering the chemical composition of our atmosphere? Kevin Trenberth
is one of America's leading climate scientists; here's a portion of
his commentary related to a new documentary about climate denial ("Greedy Lying Bastards") which is being released this month: "...
This
is a global problem. It is an international problem. It involves not
just the environment, but also the economy, trade, foreign policy,
security, sustainability, and the human condition. It involves not
just the current peoples of the Earth but future generations. And many
small countries are powerless to influence their own fate. The huge
denial machine exposed by the documentary “Greedy Lying Bastards” is
very well funded by vested interests. Too many politicians in the
United States are bought and sold, and owned by their supporters for
their own selfish interests, and with nary a care about the well being
of the planet. This necessarily is a problem of the “tragedy of the
commons”. In this case the commons is the global atmosphere, shared by
all. The air over China one day resides over the United States five
days later, and then Europe five days after that. But the atmosphere
is a dumping ground for all sorts of pollution..."
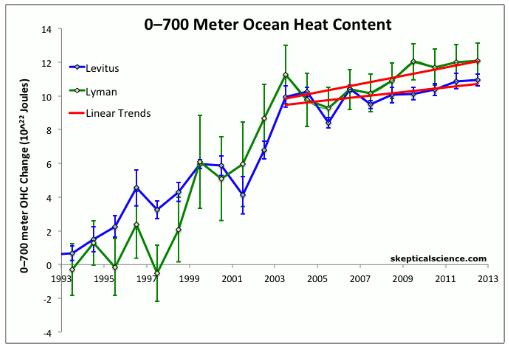
Cherrypicking To Deny Continued Ocean and Global Warming.
As much as 90-93% of all the additional heat from greenhouse warming is
going into the oceans, specifically deep-ocean waters. Here's an
excerpt of an interesting post at
Skeptical Science: "...
Despite showing a larger ocean warming trend than Levitus, climate
contrarians likely prefer the Lyman data because it does not include
the ocean layers below 700 meters. However, even if we cherrypick this
shallow ocean data and cherrypick 2003 as the starting point, the 0–700
meter ocean heat accumulation for 2003–2012 in the Lyman PMEL data is equivalent to 1.2 Hiroshima atomic bomb detonations per second over the past decade.
For 1993–2012, this rate increases to the equivalent of 3.7
detonations per second, and when including global heat accumulation in
Nuccitelli et al. (2012) including the 0–2,000 meter oceans, the Earth
has accumulated the equivalent of 4 Hiroshima atomic bomb detonations
per second over the past decade. When we consider all the
available data, it becomes quite clear that ocean and global warming
continue unabated at a rapid rate. Cherrypicking cannot change that
reality..."
Graphic credit above: "
0–700 meter ocean heat content data from NOAA NODC (Levitus) and NOAA PMEL (Lyman) using the same baseline. The yellow arbitrary denialist line is shown, followed by the linear trends for 2003–2012 and 1993–2012 in red. Standard error bars are also shown."