 32
32 communities from Colorado to Indiana just posted their hottest temperatures ever recorded from June 28-29.
118 F.
at Norton Dam, Kansas Thursday - 2 degrees hotter than the July average
for Death Valley. Details from The Christian Science Monitor below.
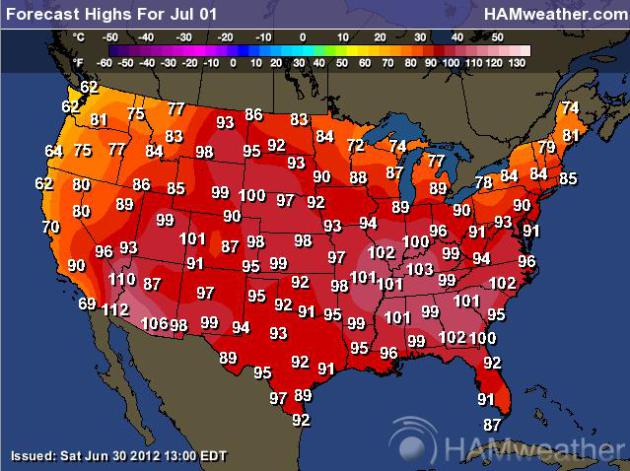
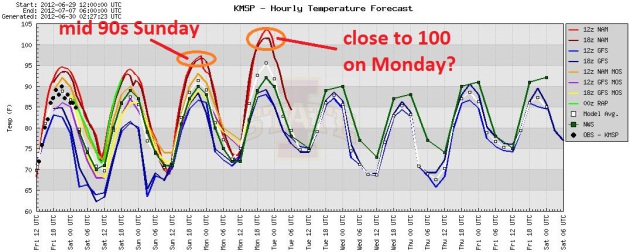
Serious 90s. Here is the latest (U.S.) model
ensemble, showing highs in the low 90s today, mid 90s Sunday, and at
least 2 models (NAM) are predicting highs over 100 Monday. We'll see,
but you're been forewarned. Graph: Iowa State.
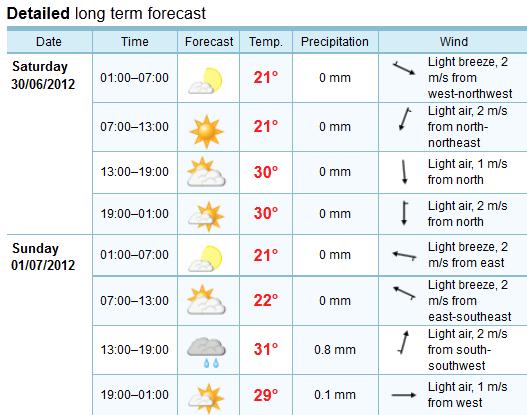
Weekend Details. A light north breeze is likely
today, highs topping 90. The ECMWF is predicting the best chance of a
few stray T-storms Sunday afternoon, as highs reach the low to mid 90s.
The only thing that would keep us cooler: persistent clouds and showers
lingering much of the afternoon - possible, but not likely right now.
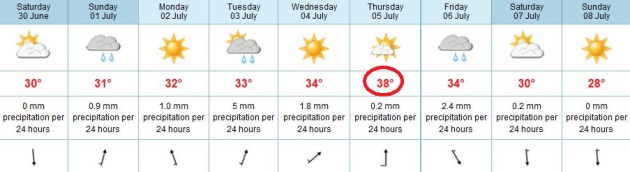
9 Days In A Row At Or Above 90? Yes, I guess that
technically fits the definition of a heat wave. The ECMWF keeps us
consistently in the 90s next week. I suspect Monday and Thursday will be
the two hottest days; highs well up into the 90s to near 100 south/west
of the MSP metro area.
Dew Point Prediction:
62 Today
68 Sunday
70 Monday
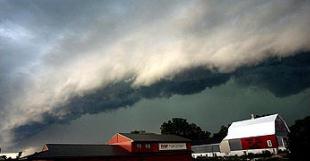
91 mph. straight-line wind gust at Fort Wayne,
Indiana Friday afternoon. Thanks to meteorologist Mace Michaels, who
captured this photo near Urbana, Iowa - part of the same squall line
that blasted the Chicago area with golfball-size hail, sparking intense
winds into northern Indiana Friday afternoon.
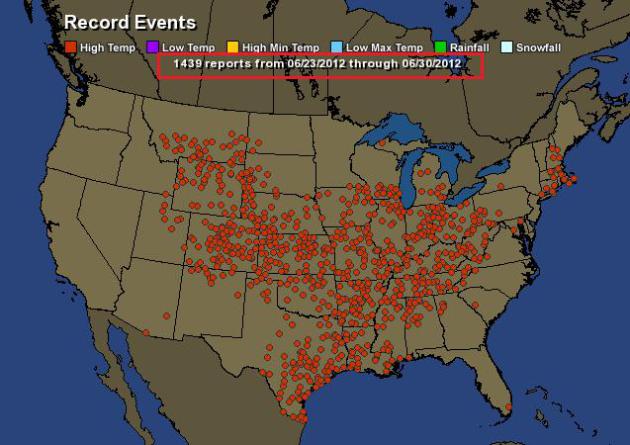
Record Heat on Friday:
97 F. Pittsburgh, Pennsylvania
101 F. Georgetown, Delaware
102 F. Washington D.C. (Dulles)
103 F. Roanoke, Virginia
103 F. Indianapolis, Indiana
104 F. Danville, Virginia
104 F. at Charlotte, North Carolina
109 F. at Nashville, Tennessee
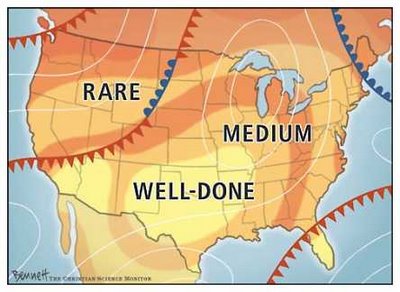
 Death Valley Heat In Kansas? How The End Of June Got So Hot
. Here's an excerpt of a fascinating story from
The Christian Science Monitor: "...
Between June 27 and June 28, 32 communities stretching from Colorado to Indiana
posted the highest temperatures on record ever for their locations –
with a handful tying or topping records set only a few days before,
according to data kept by the National Climatic Data Center in Asheville, N.C. Norton Dam, Kan., for instance, recorded an all-time record of 118 degrees F. on Thursday, two degrees above Death Valley's
July average. The 118-degree reading shattered Norton Dam's previous
record of 113 degrees F. – set just three days before. More
than 350 sites across a broad swath of the continent's interior have
posted daily record highs since June 27, with heat advisories on Friday
covering all or parts of 23 states from Kansas east to the Carolinas and
into the Northeast, and from Wisconsin south to Mississippi and Alabama."
Map above courtesy of the College of Dupage meteorology department.
"Assuming a constant cost of energy, this season's heating bills were roughly one-quarter less than average." - Greg Spoden, Minnesota State Climate Office
5,852 heating degree days in the Twin Cities in the
last 12 months; a new record low for energy consumption. Previous record
was 6,611 HDD during the winter of 2005-2006. Source: Dr. Mark Seeley -
more details below.
“
We’re seeing a window into what global warming really looks like. It looks like heat, it looks like fires,” Oppenheimer said." - from a story at The Summit County Citizens Voice; details below.
“
It appears that we’re about to cross a threshold in summer . . .
you might even call it a tipping point as we go into a net energy
absorption” of the higher elevations, Box said. “Then we’ll see the melt
area expanding abruptly and potentially covering the entire ice sheet
in summer for the first time in observations.” - from a Climate Central story below focused on a possible tipping point for Greenland.
"
The take-home message of our study is that if you do an
integration of 20 years following the development of the gas, shale gas
is worse than conventional gas and is, in fact, worse than coal and
worse than oil," Howarth said. "We are not advocating for more coal or
oil, but rather to move to a truly green, renewable future as quickly
as possible. We need to look at the true environmental consequences of
shale gas." - from Cornell University; full story below.
"Ultimately, (ExxonMobile CEO) Tillerson said humanity
would simply adapt to the effects of a warmer earth. “We have spent our
entire existence adapting, OK? So we will adapt to this,” he said." - from an MSNBC.com article, details below.
90-Degree Days In The Twin Cities Since 1980. Thanks to Greg Spoden at the Minnesota Climatology Office for sending me
this link.
17 days at or above 90 last summer and 2010. If we see more than 27
days above 90 (starting to think that's likely) this could wind up being
the hottest summer - in terms of number of 90s - since 1988, when MSP
endured 44 days above 90.
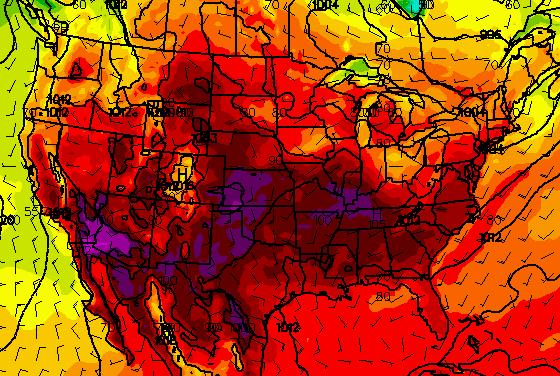
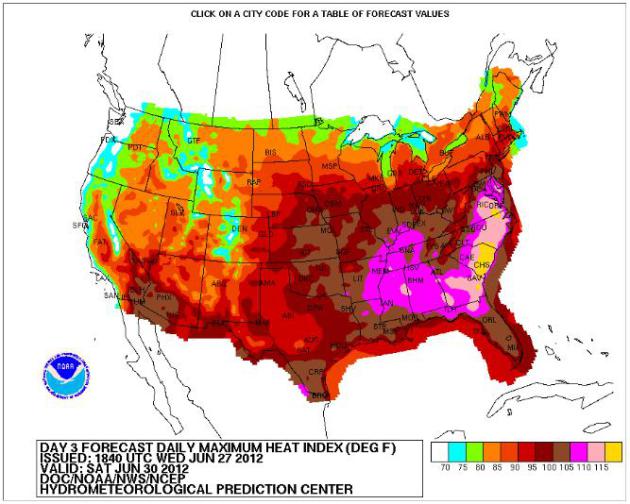
Massive "Debilitating" Heat Wave Expands East. More details on the expanding, deepening heat wave from meteorologist Andrew Freedman from
Climate Central: "
An
historic heat wave that has helped create tinderbox conditions in
Colorado and other Western states is moving east, with record-breaking
temperatures expected in at least 13 states Thursday, from Oklahoma to
Ohio. Already during the past seven days, 1,701 warm temperature records
had been tied or set across the U.S., compared to 401 cool temperature
records during the same period. As occurred during the March 2012 heat
wave, some of the records that have fallen eclipsed readings not seen
since the Dust Bowl-era of the 1930s. The National Weather Service is
describing the heat as “debilitating,” warning millions of Americans
affected to take precautions against heat-related illness."
Map credit above: "
The maximum heat index forecast for June 30. Click on the image to see a larger version." Credit: NWS.
It's Getting Warmer Out There. Here's an excerpt of Dr. Mark Seeley's always-excellent weekly post at
WeatherTalk,
focused on HDD, or heating degree days - which are a measure of how
much electricity we consume to keep our homes and offices warm during
the cold season here in Minnesota.
"New Record Low Annual Heating Degree Days for the Twin Cities"
"
The Minnesota State Climatology Office noted this week as the
annual Heating Degree Day (HDD) season (July 1 to June 30) comes to an
end, that 2011-2012 brought a new record low number for HDD with only
5852. The previous record low value was 6611 recorded in 2005-2006.
HDD are calculated using the mean daily temperature when it falls below
a base of 65 degrees F. Thus on a day with a mean daily temperature
value (maximum + minimum/2) of 50 F, the HDD value would be 15. These
are accumulated daily as an index for energy use to heat homes and
commercial buildings."
"
As Mark Seeley points out in his commentary this morning (http://climate.umn.edu/weathertalk/)
the Twin Cities heating degree day summation for the 2011-2012 heating
season is the lowest on record. See table below. This season's total of
5852 is 23% percent less than the modern normal of 7581. Assuming a
constant cost of energy, this season's heating bills were roughly
one-quarter less than average." - Greg Spoden, Minnesota State Climate Office.
Photo above: Walt Kruhoeffer.
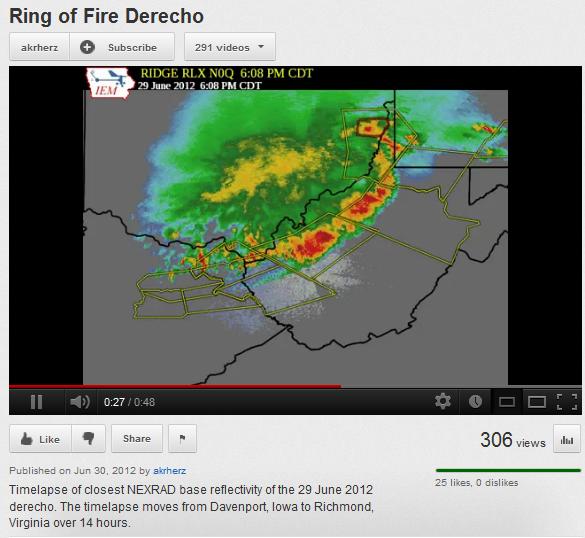
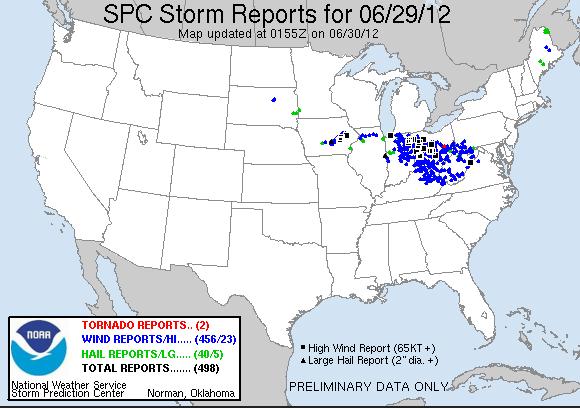
446 separate reports of severe wind damage across the Midwest and Ohio Valley as of 9 pm Friday, from the first "
derecho", a long-lasting line of severe storms capable of hurricane-force wind gusts. Source: SPC. File photo above: Wikipedia.
Peak Wind Gusts Friday:
91 mph...Ft. Wayne, IN
90 mph...Marengo, IA
84 mph...Paulding, OH
84 mph...Findlay, OH
83 mph...Gahanna, OH (1 injury)
82 mph...Wapakoneta, OH
82 mph...Dayton, OH
82 mph...OSU Airport(believe this is near the campus in OH)
81 mph...Lancaster, OH
80 mph...Versailles, OH
80 mph...Bellefontaine, OH
80 mph...Dublin, OH
80 mph...Mount Gilead, OH
80 mph...Ladora, IA
80 mph...Springville, IA
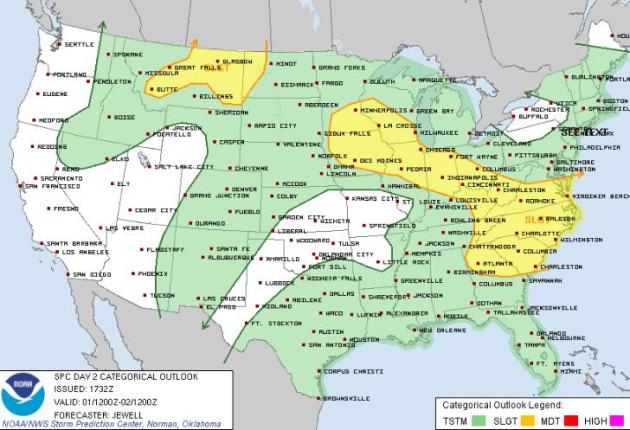
100 Degree Heat - Violent Thunderstorms. Along the
northern periphery of 100-degree, blast-furnace heat, severe storms
bubbled up, sparking straight-line winds topping 90 mph. at times
Friday, traveling over 800 miles in the span of 12 hours yesterday. Map
above:
SPC.
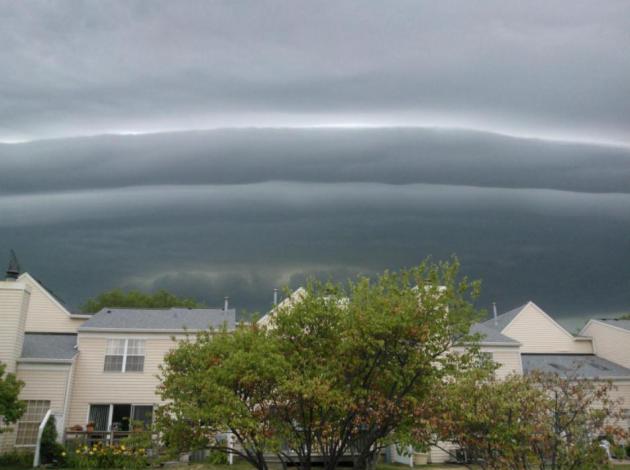
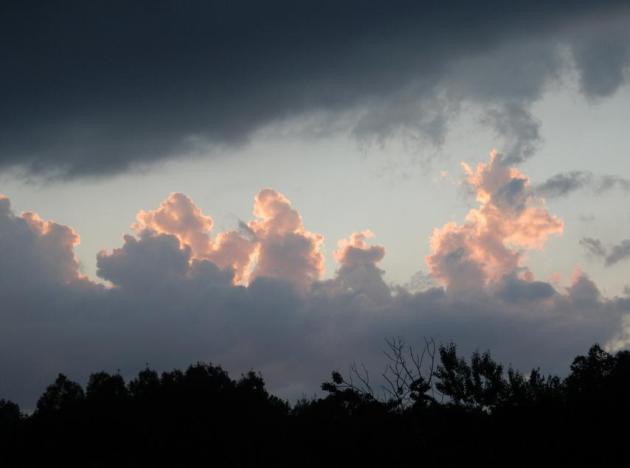
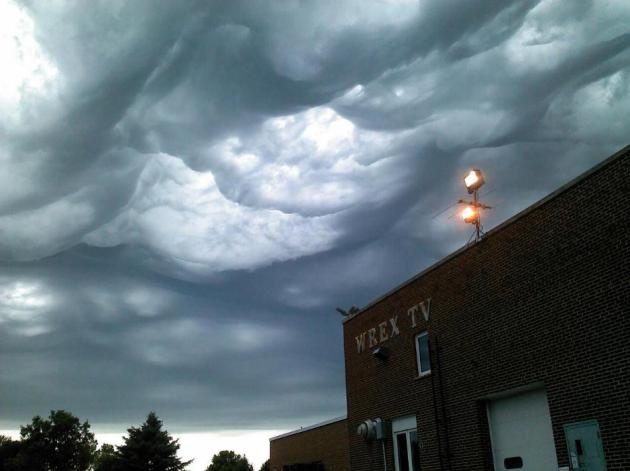
A Wild Display. Thanks to Jeannie Hayes from WREX-TV
in Rockford, Illinois for sharing these wild (wave) clouds, part of the
same squall line that carpet-bombed parts of the Midwest with large
hail and hurricane-force wind gusts yesterday.
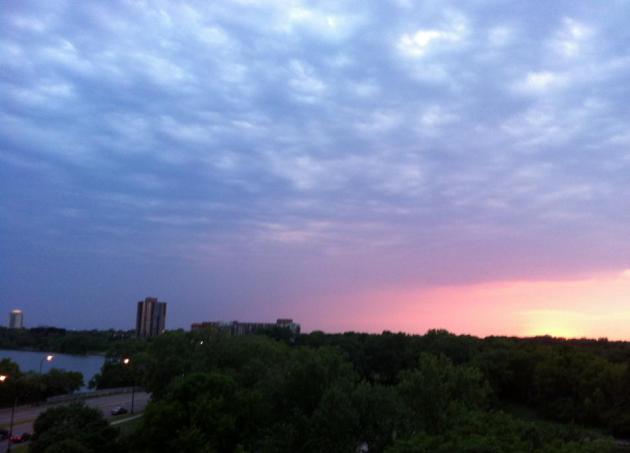
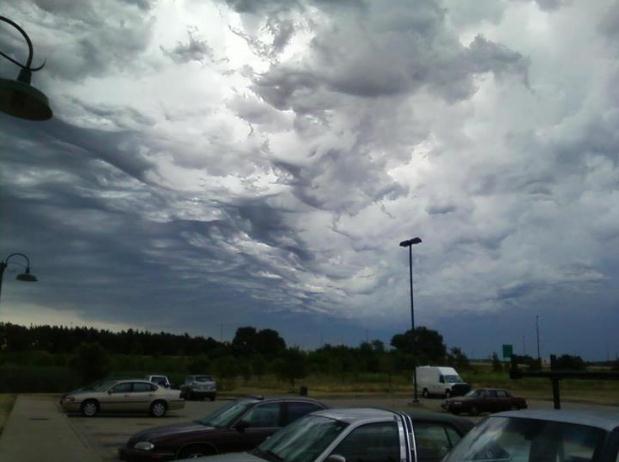
Eerie Sky. Thanks to David Hendrickson, who snapped
this photo in South Beloit, Wisconsin yesterday. A temperature inversion
4,000 to 6,000 feet above the ground created some wild-looking wave
clouds.
87 MPH Wind Gusts At Romeoville. The Chicago office
of the NWS (located in Romeoville, in Will County, far southwest suburbs
of Chicago) observed a straight-line wind gust to 87 mph. at 9:53 pm
last night.
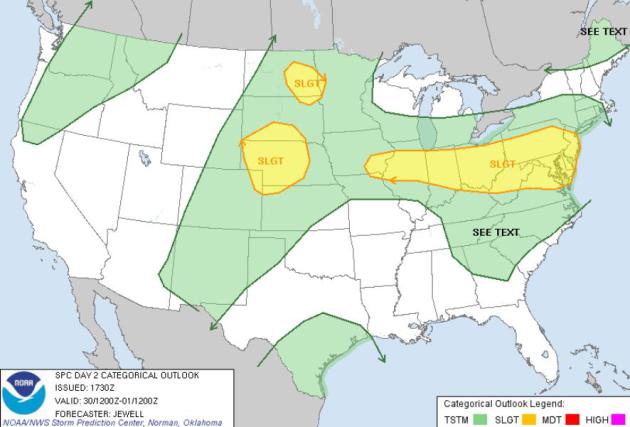
Saturday Severe Storm Threat. More strong to severe
storms are likely today from the Red River Valley and central Nebraska
east to Peoria, Indianapolis, Columbus, Philadelphia and the Washington
D.C. area, according to SPC.
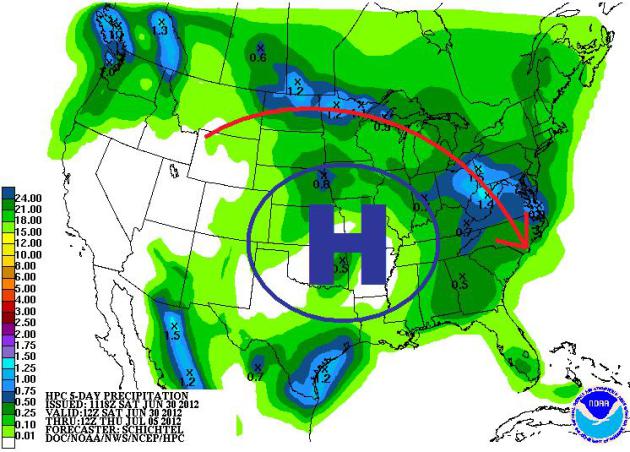
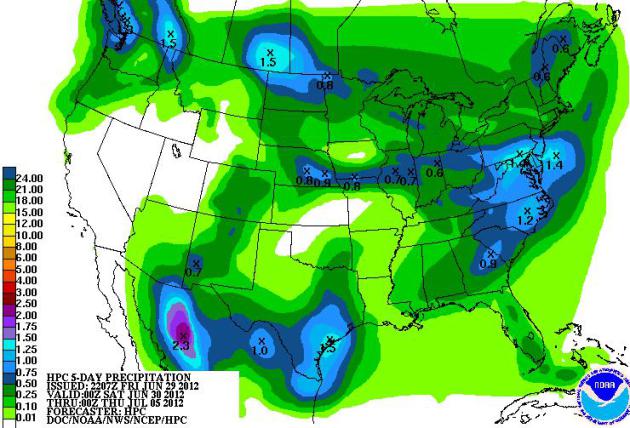
5-Day Rainfall Prediction. NOAA's HPC is predicting
widely scattered T-storms over the Mid Atlantic Region, a few may be
severe over the weekend. The best chance of storms: Chicago westward to
Omaha and North Dakota. South Texas may pick up some 1"+ rainfall
amounts by Thursday.
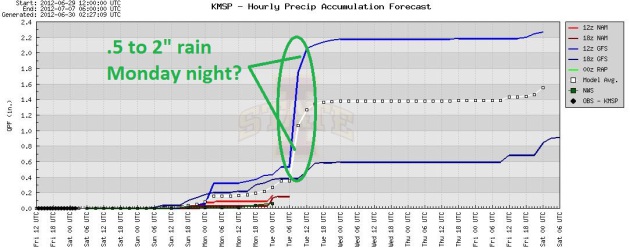
Too Early To Celebrate. Models show the best chance
of heavy T-storms Monday night and early Tuesday. Please keep in mind
that next Wednesday is a major holiday. The 4th of July has an uncanny
ability to
attract storms - so I'm keeping my guard up.
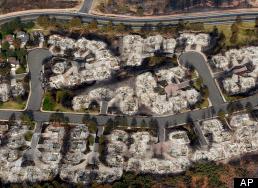
Waldo Canyon Fire: New Aerial Photos Reveal Horrifying Devastation To Homes.
Huffington Post has photos and videos of the surreal damage to the Mountain Shadows neighborhood of Colorado Springs; here's an excerpt: "
Officials said that approximately 346 homes were destroyed by the Waldo Canyon fire
making it the most destructive wildfire in Colorado history -- and
newly released aerial photos reveal the extent of the horrible
destruction in the region. These aerial photos in the slideshow below,
taken on Thursday, June 28, show the destructive path of the Waldo
Canyon fire in the Mountain Shadows subdivision area of Colorado
Springs. The Waldo Canyon fire burning near Colorado Springs began
burning on Saturday, June 23 and by Sunday -- fueled by record heat,
high winds and dryness -- it grew rapidly and forced the evacuation of
11,000 residents. After several days of Red Flag Warnings, conditions
were ripe for further growth, and by Tuesday, June 26, Waldo Canyon
Fire exploded."
Photo credit above: "
This aerial photo shows the
destructive path of the Waldo Canyon fire in the Mountain Shadows
subdivision area of Colorado Springs, Colo., Thursday, June 28, 2012.
Colorado Springs officials said Thursday that hundreds of homes have
been destroyed by the raging wildfire." (AP Photo/Denver Post, RJ Sangosti)
Waldo Canyon Blaze 25% Contained. No T-storms Friday
meant no sudden wind shifts, and firefighters were able to make
progress, the Colorado Springs (worst in Colorado history) now 25%
contained. Details from
inciweb.com:
| Total Personnel |
1,287 |
| Size |
17,073 acres |
| Percent Contained |
25% |
| Estimated Containment Date |
Monday July 16th, 2012 approx. 12:00 AM |
| Fuels Involved |
Brush, hardwood slash, Mountain shrub, oak, grass, Pinon juniper, Ponderosa pine, Douglas fir, spruce, Limber pine, White pine
|
| Fire Behavior |
Active surface fire with unassisted burning of interior
islands. Isolated single and group tree torching. Conditions have been
favorable for burnout to secure line construction.
|
| Significant Events |
Two civilian fatalities have been reported by the city
of Colorado Springs. Structure damage assesment continues with 346
reported destroyed and 24 damaged. Evacuees were allowed to return late
yesterday afternoon and evening to most of the evacuation area in west
Colorado Springs. Two large interior islands to the west of the Air
Force Academy burned off late in the afternoon. Thunderstorm outflow
winds tested containment lines. Direct line construction and a small
burnout in Division D began early in the morning and is expected to be
successful. Spotfires north of Rampart Reservior are expected to be
lined today. Crews worked with Colorado Springs to ensure that all
structures that were destroyed present no threat of fire spread.
|

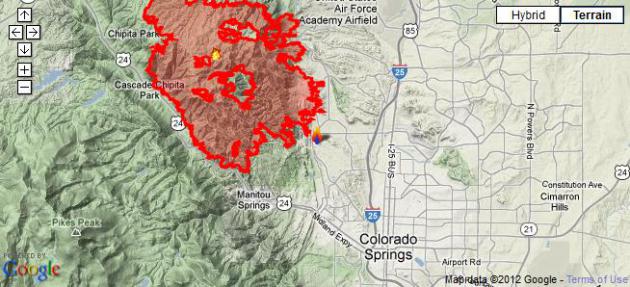
Social Media Mash-Up. Kudos to
The Denver Post
for one of the best interactive mapping tools I've ever seen
(anywhere). You can zoom into any active fire, click on photos, YouTube
clips, track storms, wind conditions, wildfire perimeters - even check
on wildfire potential. An amazingly powerful tool.
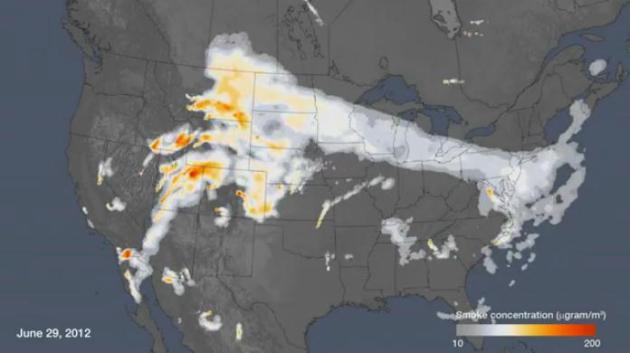
Modeling Smoke Dispersion. Yesterday I discovered that NOAA is modeling smoke plumes from western wildfires. More in this
YouTube clip: "
When
volcanoes erupt, toxic plumes are released, or wildfires burn, NOAA's
HYSPLIT model is used to answer some fundamental questions: where will
it go and how concentrated will it be? The HYSPLIT wild fire smoke
model run on June 29th, 2012 at 6z shows the cloud of smoke being
emitted from many of the wildfires raging in the Western U.S. The
actual locations of these point-source pollutants can be seen as very
high concentration smoke areas. The ability of the GOES satellite
todetect aerosols is an important input to these models, as are the wind
measurements derived from GOES infrared imagery."
HYSPLIT Model:
www.arl.noaa.gov/HYSPLIT_wildfire.php
NOAA air quality website:
airquality.weather.gov
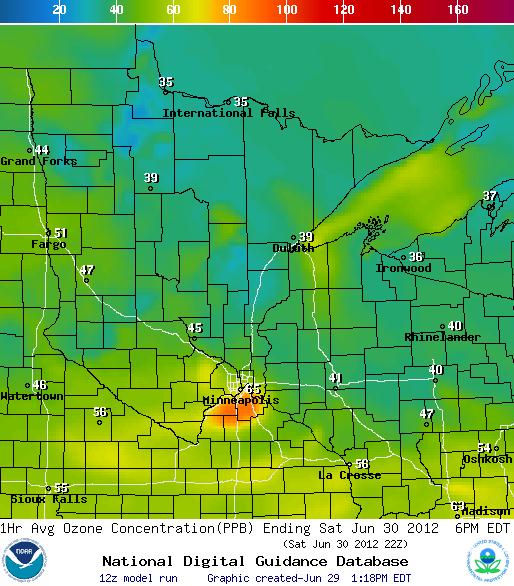
Ozone Concentrations. NOAA provides
real-time forecasts
of ozone, dust, smoke and other pollutants. The map above shows
expected ozone concentrations at 6 pm today, moderate levels over the
south metro. Ozone is critical in the stratosphere, where it shields
Earth from harmful UV radiation. But the combination of man-made
pollutants and sunshine can trigger ozone (smog) at ground-level. Ozone
is a lung irritant - of greatest concern to people with asthma and
respiratory problems.
"Ask Paul". Weather-related Q&A:
"Hello Paul - I see you are giving dew point
predictions in your forecast. Why aren’t all forecasters including dew
point readings in there forecasts along with temperature, wind, humidity
and precipitation?"
Thanks
Paul Bernards

Thanks Paul - I'm just responding to reader requests. Over the years,
as more and more Minnesotans have "discovered" the merits of dew point
(vs. relative humidity) I've received more pleas to include dew point in
the forecast, both print and blog. One number, and you know (instantly)
how it's going to feel out there. Unlike relative humidity, dew point
doesn't bounce around with the temperature. Why don't others include it?
Not sure. You'd have to ask them - I suspect they may be concerned
about alienating (older) viewers, who may be more comfortable with
relative humidity. There's another possible factor: data fatigue. If you
throw up too many numbers on the screen it's a sure-fire recipe that
most of what you say will be quickly forgotten. In a perfect world (it
ain't, by the way) I'd include not only dew point, but a "Confidence
Level" in the forecast, based on whether the models are in agreement,
etc. But at some point you have so much...crap...up on the screen that
people tune out. Their eyes glaze over. On the blog I have more space
and latitude to include additional details that would be tough to
squeeze in on the videos we update, so I'm testing some things here, to
see how well they're received. For now dew point predictions will
continue, at least through Labor Day.
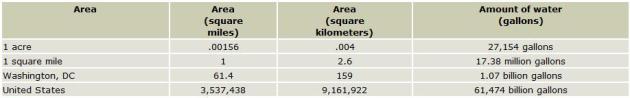
Water Statistics. I thought this was an interesting
link, as I was doing some rough calculations about how much water really
fell on northeastern Minnesota during the historic Duluth flood. Here's
some food for thought from
USGS:
How much water falls during a rainstorm?
Have you ever wondered how much water falls onto your yard during a
rainstorm? Using a 1-inch rainstorm as an example, the table below gives
example of how much water falls during your storm for various land
areas.
There are 640 acres in a square mile.
Once on the land, rainfall either seeps into the ground or becomes
runoff, which flows into rivers and lakes. What happens to the rain after it falls depends on many factors such as:
- The rate of rainfall - A lot of rain in a short period tends to run off the land into streams rather than soak into the ground.
- The topography of the land -
Topography is the lay of the land -- the hills, valleys, mountains, and
canyons. Water falling on unlevel land drains downhill until it becomes
part of a stream, finds a hollow place to accumulate, like a lake, or
soaks into the ground.
- Soil conditions - There is a lot
of dense clay in the southeastern United States that rain has a hard
time soaking into. Contrast that to the sandy soils in more desert
areas, which allow water to quickly be absorbed, at least initially.
- Density of vegetation - It has
long been known that plant growth helps decrease erosion caused by
flowing water. If you look at hills without vegetation you'll see
gullies dug out by running water. Land with plant cover slows the speed
of the water flowing on it and thus helps to keep soil from eroding.
- Amount of urbanization - As a city is being built, a lot of money and construction goes into moving water out of built-up areas. Roads, pavement, and parking lots create impervious areas
where water can no longer seep into the ground. Rather, water is
funneled into creeks and streams that were never meant by nature to
handle so much runoff. This can cause problems in urban areas.
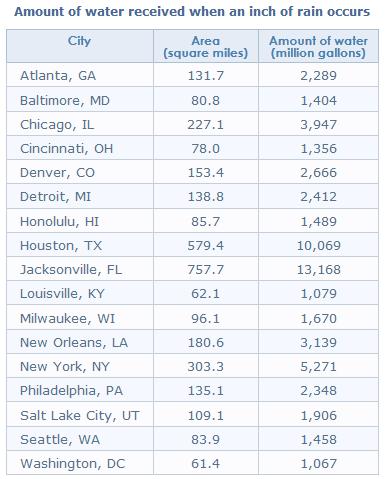
The table below gives example of how much water (in millions of
gallons) falls within the city limits of selected cities when one inch
of rainfall occurs.
Information above courtesy of the
U.S. Geological Survey and the
U.S. Census Bureau.
* photo above: ThinkStock.
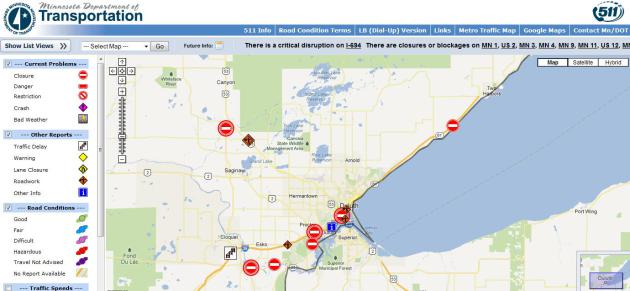
Road Closures. The recent (1-in-500 year) flood in
the Duluth washed out scores of roads - it IS possible to get up north,
but you may encounter a few detours on your way to Ely, the BWCA and
North Shore. Best to check
MnDOT's 511 web site for specific closures before hitting the highways.
Hottest 12 Months On Record. Here's an update from
The Onion. I'm not sure, but I think it's satire: "
The period between May 2011 and April 2012 was the hottest since record-keeping began in 1895. What do you think?"
New Vaccine Could Provide Lifetime Immunity To Nicotine Addiction. This one caught my eye, thanks to the uber-geeks (compliment) over at
gizmag.com: "
Researchers
at Weill Cornell Medical College have developed a vaccine that could
help existing smokers quit for good and prevent those yet to try
cigarettes from ever becoming addicted. The vaccine turns the
recipient’s kidney into a factory continuously churning out antibodies
that clear the bloodstream of nicotine before it has a chance to reach
the brain and deliver it’s addictive rush. Unlike previously tested
nicotine vaccines that only last a few weeks, the effects of a single
dose of this new vaccine should last a lifetime."
Will Google's Personal Assistance Be Creepy Or Cool? Here's a preview of coming (Google) attractions, including an introductory video from
The New York Times: "
One
day, people won’t have to type queries into a box to search for
information. It’ll be delivered to them, via their various screens,
based on where they are, who is nearby and what they might like and need
to know. Google gave a glimpse of that future on Wednesday at its
developer conference in a feature called Google Now, which will act as a kind of automated personal assistant on Android smartphones. The service, which will roll out as part of the next update
to Google’s mobile operating system, will do things like remind an
Android owner of a lunch date — but also who it is with, how to get
there and when to leave, based on current traffic congestion. And based
on your past Google searches, it will keep you up to date on flight
information and sports scores."
"Google Glasses" Now Available For Developers - Consumers Will See Them In 2014. Yep, this is pretty cool, but I fear I'll never take my Google Glasses off. Do they work in the shower?
Gizmag.com has more details: "
Google's
Project Glass has intrigued many since it was unveiled in April. It
was then that a compelling video showing how the company imagined this
technology would be used made people sit up and take notice. In the
three months that have followed, Google employees have been seen
wearing the Project Glass devices, ably led by company co-founder
Sergey Brin. Fittingly it was Brin who took to the stage at the Google
I/O developers conference to offer more details on Project Glass,
including the pricing and availability."
Paul's Big Birthday Present. I turned 54 on June 12.
Yeah...a Gemini. Not sure I buy into the astrology game, but in my
case, with two names (who am I today, "Paul" or "Doug") it kind of fits.
So back in May I send my wife, Laurie, an e-mail URL of a typewriter
(and a doggy Hawaiian shirt) from Hammacher Schlemmer, basically mocking
the company for featuring something so...dumb. Who in their right mind
would buy this stuff?
http://www.hammacher.com/Product/Default.aspx?sku=81898
http://www.hammacher.com/Product/Default.aspx?sku=81798&promo=search&query=jh-81798
My wife, not recognizing sarcasm, thinks it's a hint. So my birthday
comes and I unwrap a nice, big gift and what do I find? A "Royal"
typewriter. It's a relic, a museum piece, and now it's in my office,
displayed proudly. Yes, I'm a Tech-Luddite, but when all the computers
go down, the grid gets fried by some Romanian hacker, I'll be the only
one able to get word out. On my "typewriter". Ugh.
Then again, there's always the ongoing zombie threat....
The Wheels You're Really Going To Need For The Zombie Apocalypse - From Hyundai. As a loyal "Walking Dead" fan, I'm sorely tempted to put my order in, but do they make a hybrid?
Gizmag.com has some answers: "
Hyundai
is getting in on the incessant zombie trend with an actual concept car
designed to mow down the fearsome hordes of undead brain suckers. It's
called the Zombie Survival Machine, and it looks exactly like what it
sounds like. Hyundai has partnered with Robert Kirkman, creator of the
famed comic book and graphic novel The Walking Dead, in building the
concept for Comic-Con. "I don't know a lot about cars, but I do know a
lot about the zombie apocalypse and what I would like to have to
survive," Kirkman explains in the video below. "I think that I'll be
able to come up with something that looks cool, but may not be very
practical or effective, because I'm not good with physics and things
like that."
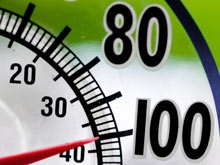
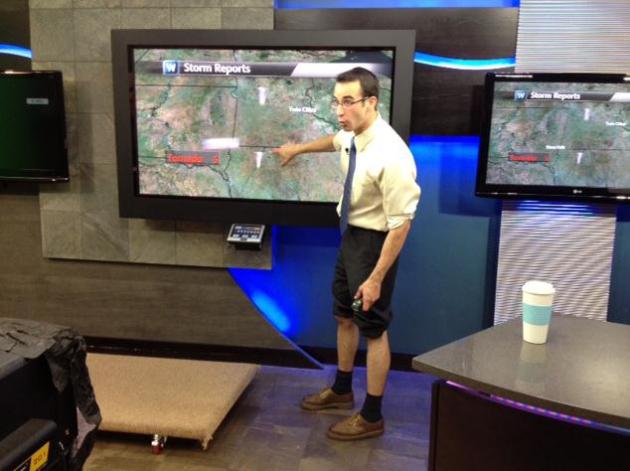
Yeah...It's That Hot Out There. In spite of state-of-the-art air conditioning in our
WeatherNation TV studios, meteorologist Aaron Shaffer felt the need to roll up his pants and go to work. Did we really need to see this?
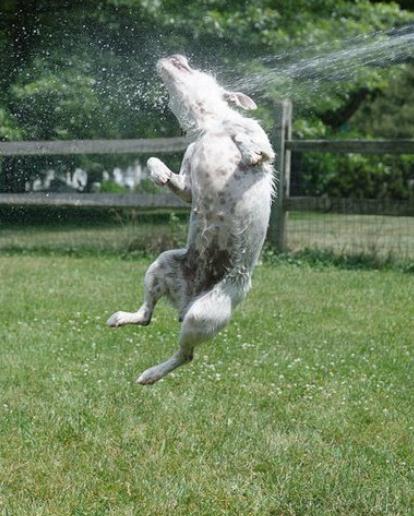 Dog Days, Part II
. Thanks to Sarah Long Hendershoot for a great pic!
Probably Not On Angie's List. Well, that's one way to repair an air conditioning unit. Probably not OSHA-approved.
Small Cooler Advisory
Let's be honest. We wait for 7 months, twiddling
our thumbs, daydreaming about thawing out up at the cabin. The long
slow burn of summer. And then, so often, summer brings cool fronts and
swarms of weekend-fouling storms. Rarely are we..satisfied.
I want to go on record predicting that you will
MOST DEFINITELY get your fill of summer heat this year. By August we may
be fantasizing about school buses, football and fresh, clean,
dew-point-free Canadian air.
For much of America this could wind up being the
hottest summer since 1988. The MSP metro enjoyed/endured 44 days above
90 that summer.
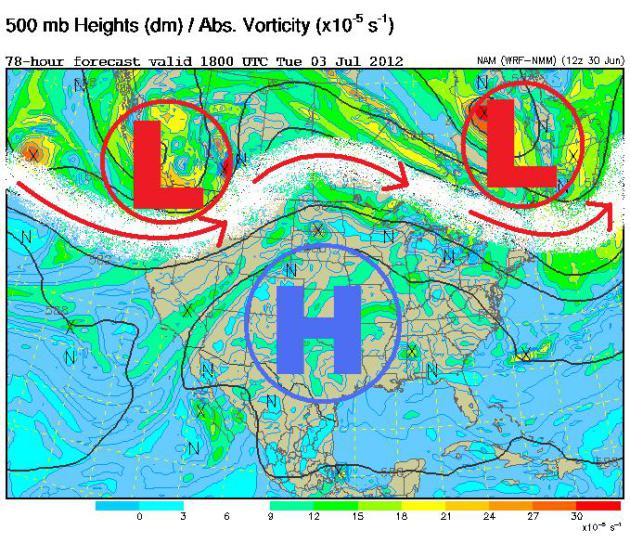
Average is 14. At the rate we're going I suspect
we'll wind up with 30 days over 90 F. That's a gut feel (nausea?) based
on how the weather pattern is setting up: a massive "heat-pump" high
stalled over the Plains. Surges of blistering 90 and 100-degree heat
will expand northward; we should top 90 every day next week.
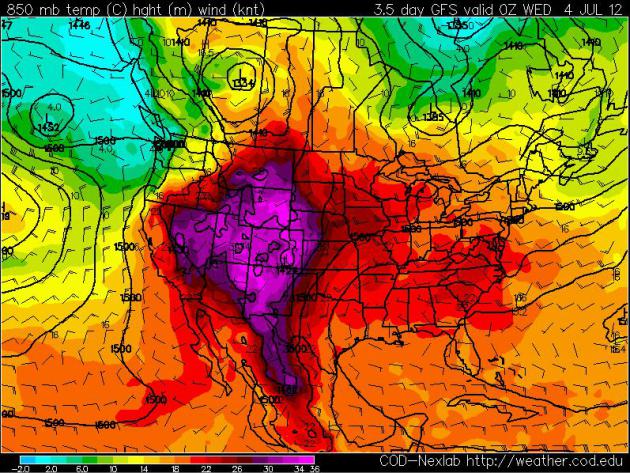
The ECMWF solution hints at highs near 100 a few
days next week. The dew point tops 70 F, making it feel like 100-110 F.
next week.
A few T-storms sprout Sunday, again Tuesday - the first chance of slight relief the second week of July. Think cool thoughts.
Hey, a real summer this year! No kidding Paul....
* photo above courtesy of
icanhascheezburger.com.
No Worries! Thanks to verydemotivational.com for passing this one along...
Climate Stories....
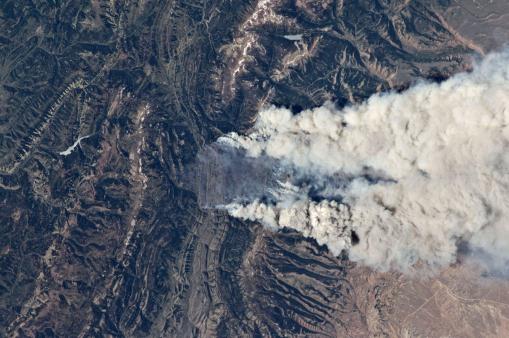
West's Wildfires A Preview of Changed Climate: Scientists. Reuters has the details: "
Scorching
heat, high winds and bone-dry conditions are fueling catastrophic
wildfires in the U.S. West that offer a preview of the kind of disasters
that human-caused climate change could bring, a trio of scientists
said on Thursday. "What
we're seeing is a window into what global warming really looks like,"
Princeton University's Michael Oppenheimer said during a telephone
press briefing. "It looks like heat, it looks like fires, it looks like
this kind of environmental disaster ... This provides vivid images of
what we can expect to see more of in the future."
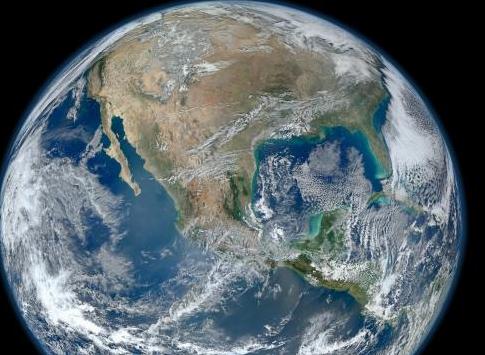
Image credit above: "
In
this Wednesday June 27,2012 photo released by NASA showing wild fires
burning at the south end of the Wyoming Range in southwestern Wyoming
taken aboard the International Space Station, 240 miles above earth.
These particular fires, of unknown cause, are burning at the south end
of the Wyoming Range in southwestern Wyoming, and have affected 17,000
acres." (AP Photo/NASA)
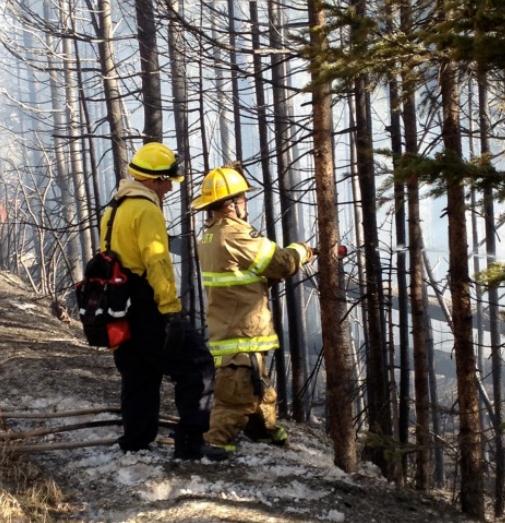 Colorado: Global Warming A Factor In Severe Wildfires
. Here's an excerpt from a story at the
Summit County Citizens Voice: "A rapidly intensifying fire season across the West is a warning of
what to expect in a world that’s heating up, according to a panel of
climate scientists and environmental advocates who this week held a
teleconference to point out links between global warming and wildfires. “We know that climate is already warming. The disastrous fires we’ve
seen fit into a pattern of increased fire risk … it’s a vivid image of
what we can expect more of as the world warms more, said Princeton
professor
Michael Oppenheimer, a long-time member of the Intergovernmental Panel on Climate Change."
Photo credit above: "
Firefighters in Summit County, Colorado, battle a small fire in late
March, 2012, while standing on a berm of snow, a testament to unusually
early wildfire conditions."
Photo by Bob Berwyn.
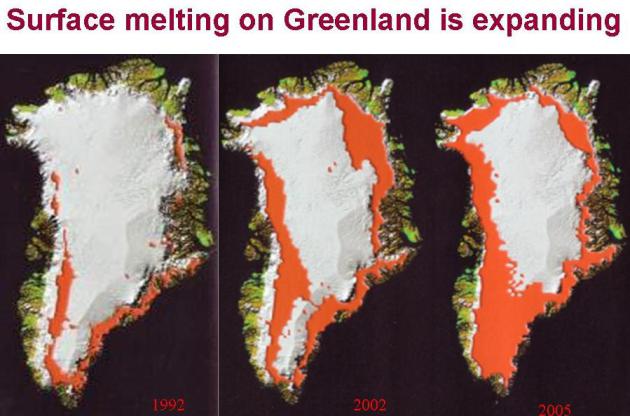
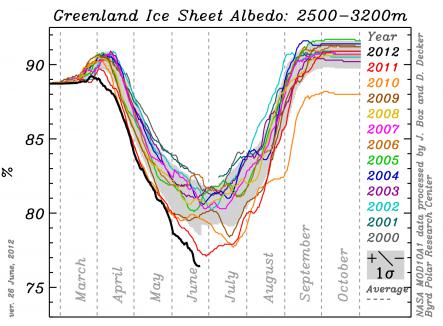
Greenland Ice Sheet Melt Nearing Critical "Tipping Point".
Separating out the signal from the noise can be daunting with climate -
what should we be most concerned about on any given day? Good question.
Climate scientists talk about non-linear systems - nature rarely
travels in a state line. Are we near a tipping point? No one really
knows, but I wanted to share a recent story from meteorologist Andrew
Freedman at
Climate Central that got my full, undivided attention: "
The
Greenland ice sheet is poised for another record melt this year, and
is approaching a "tipping point" into a new and more dangerous melt
regime in which the summer melt area covers the entire land mass,
according to new findings from polar researchers. The ice sheet is the
focus of scientific research because its fate has huge implications for
global sea levels, which are already rising as ice sheets melt and the
ocean warms, exposing coastal locations to greater damage from storm surge-related flooding."
Graphic credit above: "
Trend in the reflectivity of high elevation ice in Greenland, showing the record low as of June 26, 2012." Credit: Meltfactor.org.
 Confirming The Human Footprint In Global Ocean Warming.
 Much of the warming has been in the world's oceans;
Think Progress has a story about the implications - here's an excerpt: "
Although over 90% of overall global warming goes into heating the oceans, it is often overlooked, particularly by those who try to deny that
global warming is still happening. Nature Climate Change has a new
paper by some big names in the field of oceanography, including
Domingues, Church, Ishii, and also Santer (Gleckler et al. 2012).
The paper compares ocean heat content (OHC) simulations in climate
models to some of the newest and best OHC observational data sets from Domingues (2008), Ishii (2009), and Levitus (2009) which contain important corrections for systematic instrumental biases in expendable bathythermograph (XBT) data. The paper makes several important points.
- The 0-700 meter layer of the oceans warmed on average 0.022°C to 0.028°C per decade since 1960."
ExxonMobil CEO Assailed For Claims On Climate Change.
Can we "engineer" our way out of this problem, an unfortunate
by-product of growth and a dependence on fossil fuels to power our
economies? Good question. Here's a full report from
MSNBC.com; here's an excerpt: "
Rex
Tillerson's acknowledgement that fossil fuel consumption contributes
to climate change should have been a PR coup for ExxonMobil when the company's CEO gave a major address this week. Instead, environmentalists blasted Tillerson's assertion that the impact of climate change is not as serious as "lazy" journalists and an “illiterate” public believe. Tillerson
won praise for reversing the company's long-standing denial of a
correlation between climate change and the burning of fossil fuels. But
environmentalists said Tillerson's remarks won’t sit well with many
Americans, especially those affected by extreme weather, climate-related
natural disasters and pollution."
Photo credit above: Bazuki Muhammad / Reuters. "
It's an engineering problem and there will be an engineering solution," ExxonMobil CEO Rex Tillerson said of climate change."
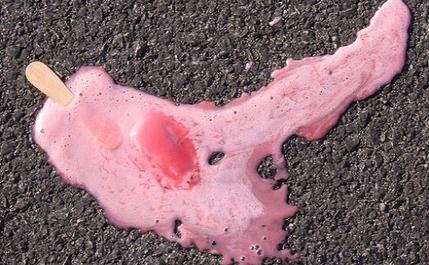
Climate Change: A Parent's Worst Nightmare. Here's an excerpt of a story from The Nature Conservancy and
Care2 Healthy Living: "
...But increasingly, getting kids away from electronics and out into nature can be stymied by weather disruptions.
Summers are getting hotter, storms are getting wetter, and seasons are
being thrown out of whack, with extreme events projected to occur more
frequently in the future. That’s because carbon pollution is not only warming the Earth, but also increasing erratic and weird weather. And we parents will feel the effects all year long. While
average temperature increases may seem small (the Earth has warmed 1.3
degrees Fahrenheit since the early 20th Century), the big fluctuations
are difficult to manage around. Our lives – from school schedules to
sports to crop cycles
– are built around expected “normals,” and large shifts from those
normals are incredibly disruptive, especially for kids who thrive on
routines."
Photo credit above: "
A casualty of summer heat. Credit: Flickr user Neil Fitzgerald, via a Creative Commons license."
Benefits vs. risks of hydro-fracking for natural gas:
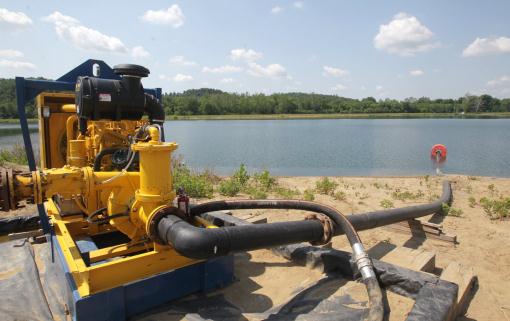
Fracking: Where's The Debate About Its Climate Change Risks? Here's a snippet from an article at
The Guardian: "
Rarely a day goes by, it seems, when "fracking" isn't in the news. It's either being hailed as a miracle energy source, or it is being condemned as yet another polluting fossil fuel. Today's headlines largely focus on the findings of a joint report (pdf) by the Royal Society and the Royal Academy of Engineering
which concludes that hydraulic fracturing of shale gas – "fracking" –
should be allowed to proceed in the UK, but only with tight regulation
and monitoring. Published ahead of the government's anticipated "green light" for fracking
later this summer, the report calls for a long parade of checks and
balances, as you might expect it to: "Monitoring should be carried out
before, during and after shale gas operations to inform risk
assessments. Methane and other contaminants in groundwater should be
monitored, as well as potential leakages of methane and other gases
into the atmosphere."
Photo credit above: "
The pump and collection hose can be seen in a
private lake at a Chesapeake Energy Corporation water collection
station at a sand and gravel pit on May 31, 2012, in Carroll County,
Ohio." (Mike Cardew/Akron Beacon Journal/MCT)
Natural Gas From "Fracking" Could Be Dirtier Than Coal, Cornell Professors Find. Here's an excerpt of an article from
Cornell University: "
Extracting
natural gas from the Marcellus Shale could do more to aggravate global
warming than mining coal, according to a Cornell study published in
the May issue of Climatic Change Letters (105:5). While natural gas has
been touted as a clean-burning fuel that produces less carbon dioxide
than coal, ecologist Robert Howarth warns that we should be more
concerned about methane leaking into the atmosphere during hydraulic
fracturing. Natural gas is mostly methane, which is a much more potent
greenhouse gas, especially in the short term, with 105 times more
warming impact, pound for pound, than carbon dioxide (CO2), Howarth
said, adding that even small leaks make a big difference. He estimated
that as much as 8 percent of the methane in shale gas leaks into the
air during the lifetime of a hydraulic shale gas well -- up to twice
what escapes from conventional gas production."
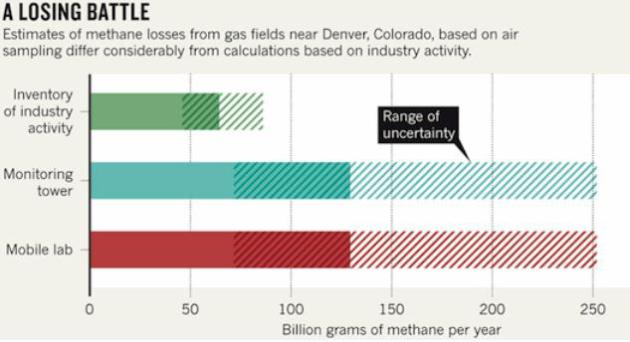
Bombshell Study: High Methane Emissions Measured Over Gas Field "May Offset Climate Benefits Of Natural Gas". Details in a story earlier this year from
Think Progress; here's an excerpt: "
How much methane leaks during the entire lifecycle of unconventional gas has emerged as a key question in the fracking debate. Natural gas is mostly methane
(CH4). And methane is a far more potent greenhouse gas than (CO2),
which is released when any hydrocarbon, like natural gas, is burned.
Even without a high-leakage rate for shale gas, we know that “Absent a Serious Price for Global Warming Pollution, Natural Gas Is A Bridge To Nowhere.”
Graphic credit above:
"Natural-gas operations could release far more methane into the atmosphere than previously thought." [Source: Nature]
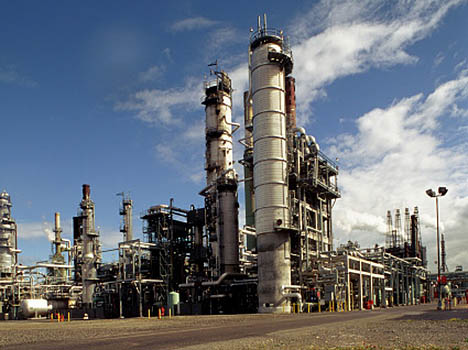
"The Sky Is Pink". We may have more than 100 years
of natural gas fields opening up due to hydro-fracking techniques,
injecting high-pressure water and chemicals deep underground to harvest
gas. Sadly, that old adage about "no free lunch" may hold true.
Thefracking process may contaminate groundwater and release vast
quantities of methane, a potent greenhouse gas. Here's a
Vimeo clip previewing a new film focused on the known hazards of "fracking": "
An
emergency short film from Josh Fox, the Oscar-nominated director of
GASLAND addressing the urgent crisis of drilling and fracking in New
York state. Go to NYAgainstfracking.org for more info and to get involved."
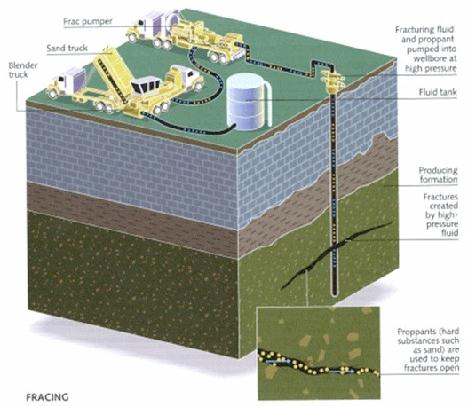
Fracking Is Hardly Leakproof. Here's an excerpt from a story at
The Times Union: "
Recently,
politicians and publications have conditionally endorsed so-called
"safe fracking" as a part of the nation's energy mix. But safe fracking
is an impossibility, and the industry's claims for it are knowingly
based on false premises. Chief among them is the notion that a
"leakproof well" is possible. We've heard time again that strict
regulation is the key to moving forward on fracking, and that new
regulations should make sure that industry constructs leakproof wells
that do not pollute the water table. There is no such thing as a
leakproof gas well. The gas industry knows this; in fact, it has known
it for decades." Image above courtesy of
Wikipedia.
EarthTalk: Is Renewable Energy Sustainable? Here's another interesting article, an excerpt from a recent story at
thehour.com:
Dear EarthTalk: "
Renewable
energy production in the solar and wind markets currently receives
about $7 billion in government subsidies annually, but is still not
competitive against fossil fuels on a large scale. To what extent
should the U.S. continue to prop up these industries as they compete
against dirty energy?"
-- Jack Morgan, Richmond, VA
"
Given the importance of abundant amounts of energy for
Americans, the federal government tends to subsidize all forms of
energy development, including fossil fuels and renewables. A recently
released report by the Congressional Budget Office (CBO) found that in
2011 the federal government spent $16 billion of our tax dollars in
subsidies for the development of renewable energy and increased energy
efficiency, and only $2.5 billion in subsidies to the fossil fuel
industry in the form of tax breaks. But this breakdown in favor of
larger subsidies to alternative renewables is a recent product of
President Obama’s stated goal of cutting back on subsidies to the
hugely profitable oil industry."


