 1 hour
 of extra daylight by tomorrow. Translation: since the Winter Solstice on December 21 we've picked up an additional 60 minutes of daylight here in the MSP metro area.
7.1 F. warmer than average so far in January here in the Twin Cities.
23.3 F. predicted final average temperature in January, the 8th warmest on record. Source: meteorologist Belinda Jensen during Monday's 6 pm newscast.
5 of the last 8 months have been "Top 10 Warmest" months at MSP. Ever since last July the atmosphere has been locked in an unusually mild and dry pattern.
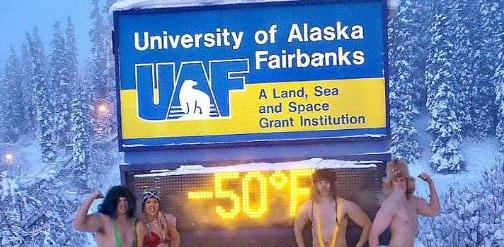
16 days colder than -40 F. so far in Fairbanks during January (most since 1971).
* Photo above was taken Sunday at 9am, posted by Allison Donovan on the University of Alaska Facebook page. She calls it the "50 Below Club".
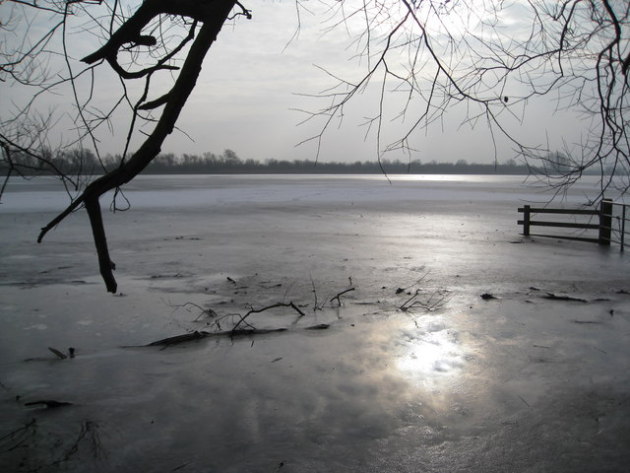
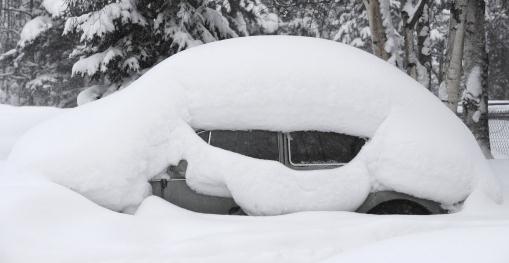
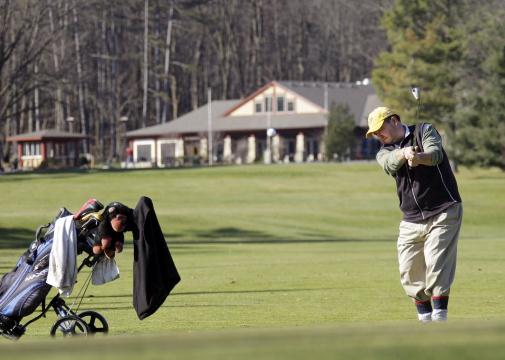
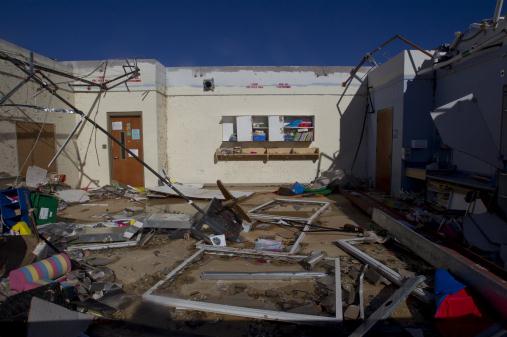
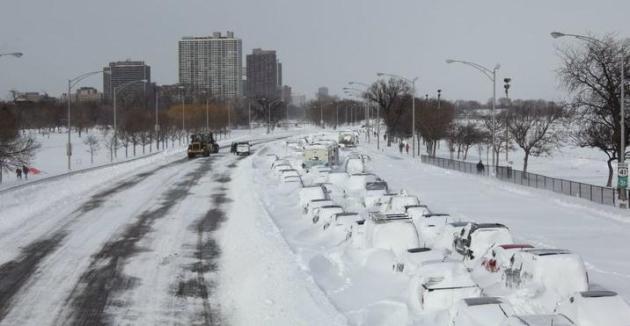
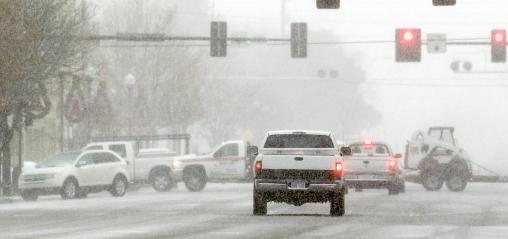
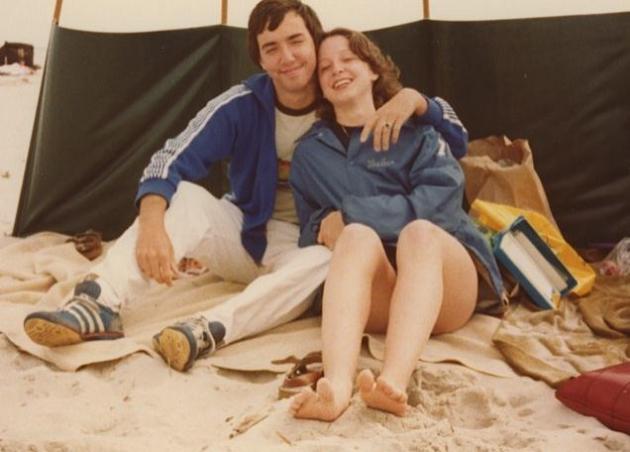
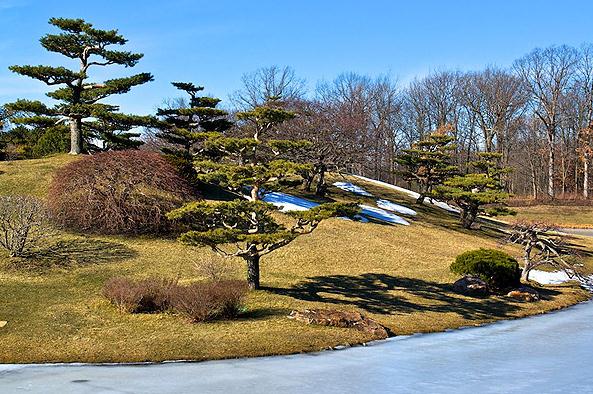
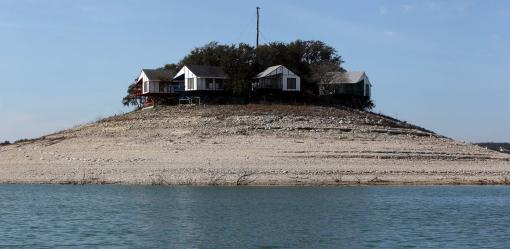
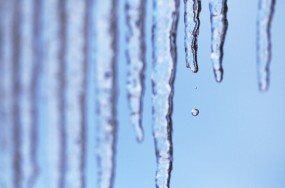
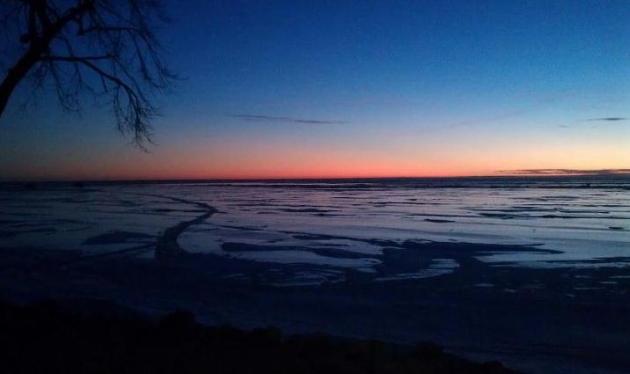
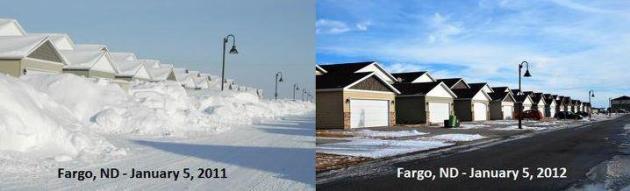 Is The Worst Of Winter Behind Us?
 Photo comparison above courtesy of
InForum.com. My tentative, humble and respectful answer is yes. It's been one of the mildest winters on record; at the rate we're going this will easily be a "Top 10 Warmest Winter" in the Twin Cities. So far we've had 3 nights below zero. Average is close to 28 nights of negative numbers. A few more subzero nights by late February, but no more numbing cold fronts are imminent. Are we really seeing fewer nights below zero at MSP, or is our imaginations? How much of this can be chalked up to the "Urban Heat Island" (metro buildings, industry and dark, asphalt roads releasing heat at night, keeping nighttime lows milder than they would be 30 miles outside the metro area?) Then again, although the metro was marginally smaller in the 70s, there was still an urban heat island a generation ago. Here's the raw data since 1970, thanks to Pete Boulay at the Minnesota State Climate Office:
Year Jan Feb Mar Apr May Jun Jul Aug Sep Oct Nov Dec Annual
1970 18 10 0 0 0 0 0 0 0 0 0 5 33
1971 19 8 0 0 0 0 0 0 0 0 0 6 33
1972 18 12 3 0 0 0 0 0 0 0 0 14 47
1973 9 3 0 0 0 0 0 0 0 0 0 6 18
1974 14 6 2 0 0 0 0 0 0 0 0 0 22
1975 10 8 3 0 0 0 0 0 0 0 0 5 26
1976 12 4 2 0 0 0 0 0 0 0 3 13 34
1977 26 3 0 0 0 0 0 0 0 0 4 10 43
1978 21 13 3 0 0 0 0 0 0 0 0 11 48
1979 21 13 1 0 0 0 0 0 0 0 0 2 37
1980 12 8 2 0 0 0 0 0 0 0 0 5 27
1981 7 9 0 0 0 0 0 0 0 0 0 10 26
1982 22 11 2 0 0 0 0 0 0 0 0 2 37
1983 3 3 0 0 0 0 0 0 0 0 0 16 22
1984 11 3 5 0 0 0 0 0 0 0 0 6 25
1985 15 9 0 0 0 0 0 0 0 0 5 16 45
1986 6 9 1 0 0 0 0 0 0 0 1 2 19
1987 4 0 0 0 0 0 0 0 0 0 0 2 6
1988 17 11 0 0 0 0 0 0 0 0 0 5 33
1989 6 14 4 0 0 0 0 0 0 0 0 13 37
1990 0 2 0 0 0 0 0 0 0 0 0 10 12
1991 14 4 0 0 0 0 0 0 0 0 3 8 29
1992 6 0 0 0 0 0 0 0 0 0 0 6 12
1993 11 8 2 0 0 0 0 0 0 0 0 7 28
1994 16 12 0 0 0 0 0 0 0 0 0 1 29
1995 3 9 4 0 0 0 0 0 0 0 0 5 21
1996 17 8 7 0 0 0 0 0 0 0 4 9 45
1997 15 3 1 0 0 0 0 0 0 0 1 1 21
1998 8 0 0 0 0 0 0 0 0 0 0 5 13
1999 14 0 0 0 0 0 0 0 0 0 0 5 19
2000 8 0 0 0 0 0 0 0 0 0 0 14 22
2001 6 14 0 0 0 0 0 0 0 0 0 0 20
2002 1 0 1 0 0 0 0 0 0 0 0 0 2
2003 8 11 5 0 0 0 0 0 0 0 0 1 25
2004 11 3 0 0 0 0 0 0 0 0 0 6 20
2005 7 0 0 0 0 0 0 0 0 0 0 4 11
2006 0 2 0 0 0 0 0 0 0 0 0 1 3
2007 3 12 0 0 0 0 0 0 0 0 0 3 18
2008 13 8 2 0 0 0 0 0 0 0 0 12 35
2009 15 4 3 0 0 0 0 0 0 0 0 4 26
2010 11 0 0 0 0 0 0 0 0 0 0 3 14
2011 7 7 1 0 0 0 0 0 0 0 0 0 15
2012 3 - - - - - - - - - - - 3
Average 11.7 7.8 1.6 0.0 0.0 0.0 0.0 0.0 0.0 0.0 0.8 6.2 27.8
Subzero Nights At MSP. Here are the averages, per decade:
1970-79: 34.1
1980-89: 22.7
1990-99: 33.9
2000-2012 (to date): 21.4
* looking at nighttime lows below zero at MSP, the 90s were colder than the 80s, the 13 winters since 2000 have been significantly warmer than previous decades. Since 2002 we've experienced 3 winters with fewer than 3 subzero nights. Will we see more subzero weather in the metro by late March? Probably, but the odds are dropping off with each passing day.
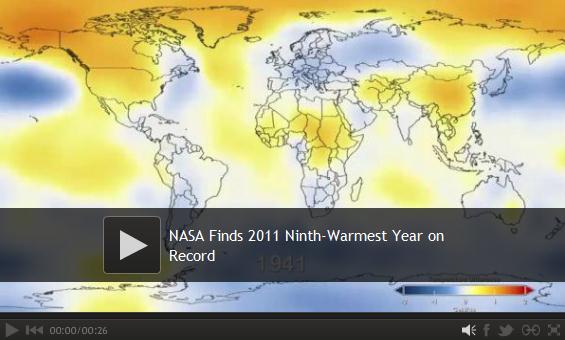
2011: 9th warmest year on record, worldwide, according to NASA (in spite of a lingering La Nina cooling phase of the Pacific ocean). Details below.
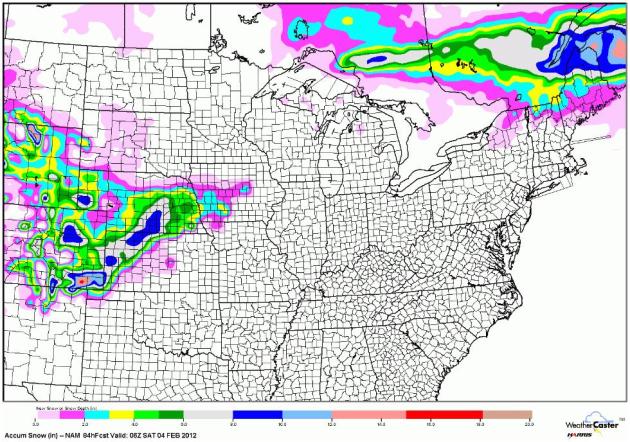
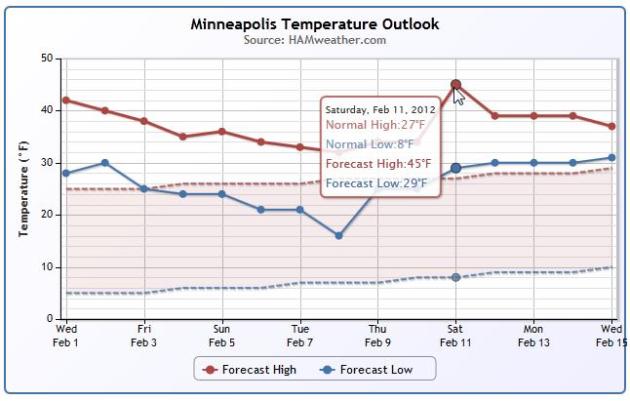
 Close Call This Weekend?
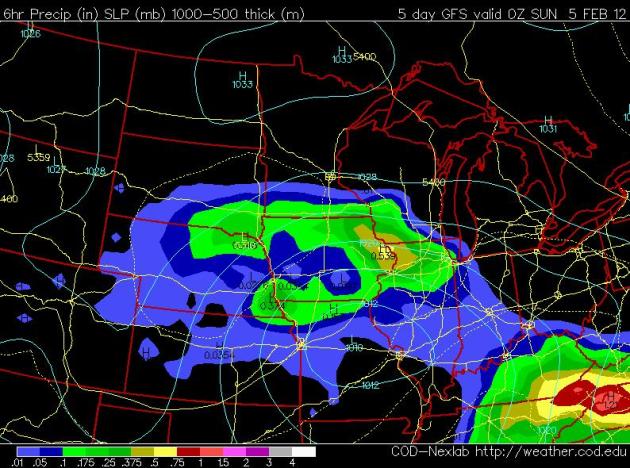
 The 00z GFS model brings a storm into far southern Minnesota during the PM hours Saturday, the atmosphere warm enough for a rain/snow mix, with a couple inches of slush not out of the question from Albert Lea to Winona - the brunt of the moisture (once again) sliding off south of MSP. What do we have to do to get a real storm here?
* the ECMWF model keeps the Saturday storm well south/east of Minnesota. I doubt we'll see any significant snow (or rain) from this system. Why should this weekend be any different? We're in a drought, and the longer it drags on the more I fear that drought will be one of the biggest weather stories of 2012 for Minnesota. Hope I'm wrong.
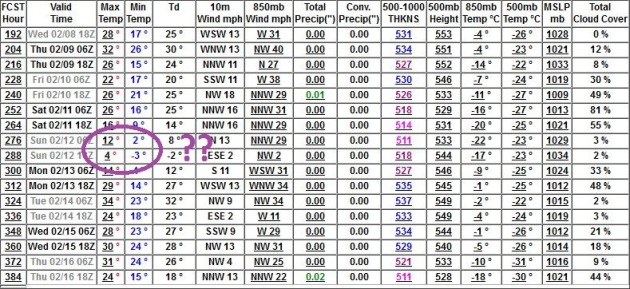
 Wildly Gyrating Models
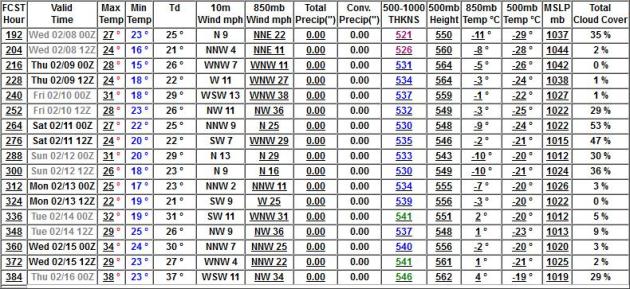
. The 12z run of the GFS brought subzero weather into MSP around Feb. 10-12, but the latest (00z) run keeps bitter air well north/east of Minnesota, with highs consistently in the 30s through mid February. We'll see.
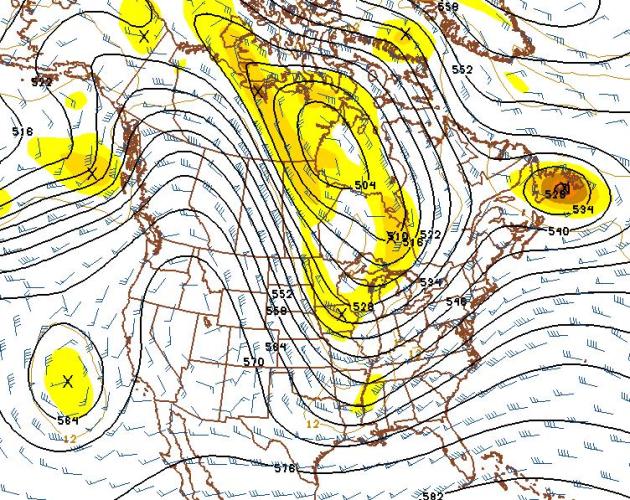
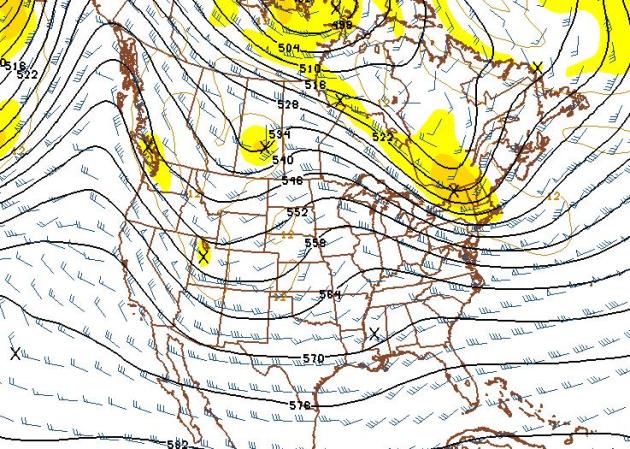 February 15...or March 15?
 The GFS solution above shows 500 mb (18,000 foot) winds aloft on February 15, with a persistent westerly flow from the Pacific air, numbing, subzero air still dammed up 300-600 miles north of MInnesota. The map above looks like something out of mid March, not mid February. Could the worst of winter be behind us?
I suspect that's the case.
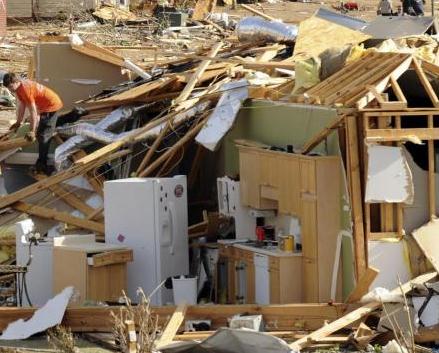
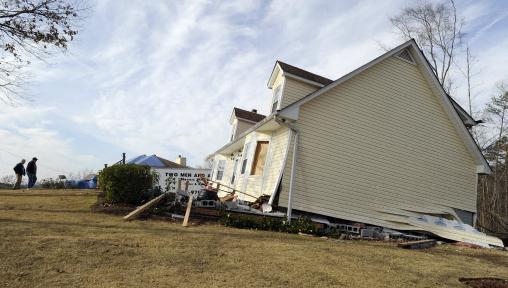
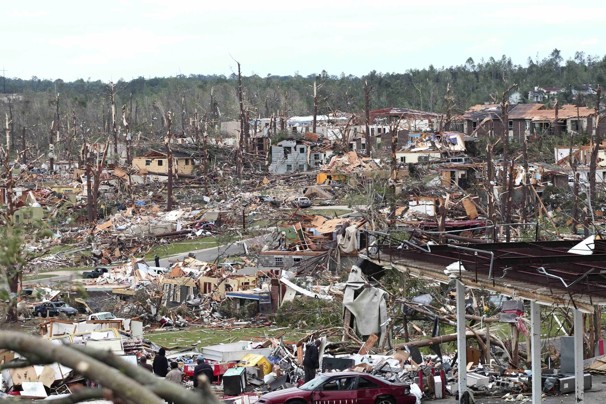
An Early Tornado Season. "
Stan and Jeanne Leo survived the Jan. 23rd tornado in their custom built home built in 1986. Stan designed the home and built it to withstand high winds. It did just that. Meteorologist Tim Coleman saw the intact house that did slide off of the foundation by 20 feet and stopped at the house while doing tornado assessment after the storm. The Leo's survived in their bedroom and were rescued by firefighters. The home now rests at a 15 degree angle, fully intact. (AP Photo/The Birmingham News, Joe Songer)."
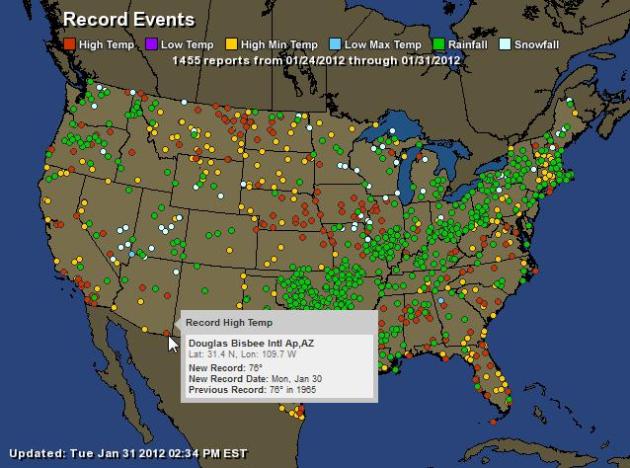
68 tornadoes so far this year; third highest number on record, to date (SPC).
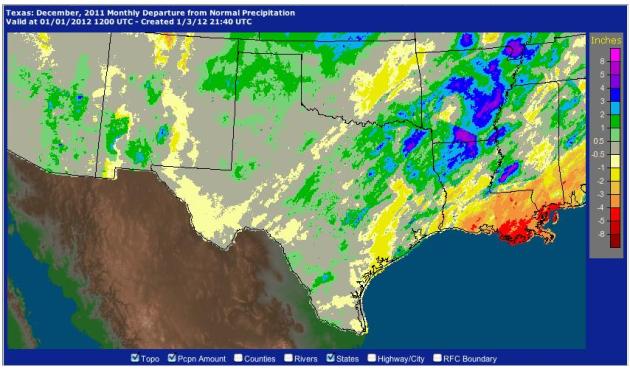
6.18" rain in Dallas this month; second wettest January on record.
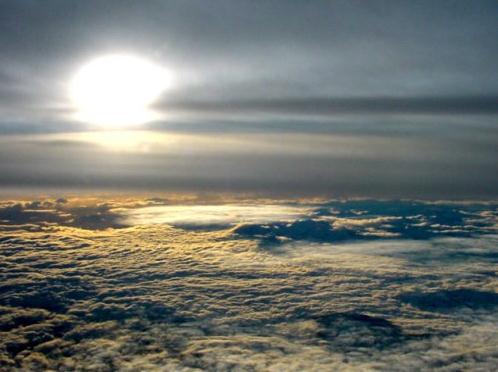
Why Head South? As I mentioned in today's print column, I went a little overboard last fall scheduling time away from Minnesota this winter. I love snow (2 Polaris sleds help a lot), but the older I get the tougher it gets rationalizing subzero cold and nasty ice. Like everyone else - I was a little freaked out by CPC's predictions of "much colder/snowier" for the northern tier states. That 'dang La Nina would bite us again, right? Wrong. The long range prediction couldn't have been more wrong. So back in September I make arrangements to be gone 4 weeks during the height of winter, including a cruise last week with my father and sister. It was a good week, highs in the 70s and low 80s in the Caribbean, plenty of good times at the buffet (where I gained 6 pounds). Only one thing was missing: the urge to call/text/e-mail friends back in Minnesota with weather updates from Nassau, Charlotte Amalie and St. Maarten. Why bother when it's in the 40s back home? Snowbirds are at a rare (and welcome) loss for words this winter...some wondering why they even went south this winter. Or should I say, "winter"? We're not out of the woods just yet, odds favor a few more subzero nights (maybe by the end of next week) but I still suspect that looking at nighttime lows and wind chill readings the worst of winter, a winter that's setting warm weather records left and right, is probably behind us now. Now, back to my fast....
* photo above courtesy of funtoosh.com.
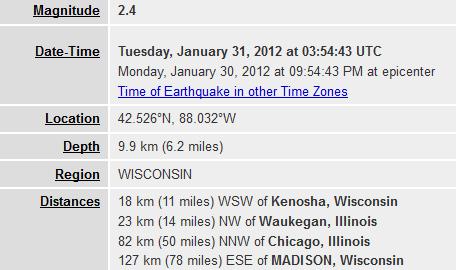 Wisconsin Tremor
. A 2.4 quake on the Richter Scale 11 miles west southwest of Kenosha, Wisconsin? The data above is from
USGS. Now I've (officially) seen everything.
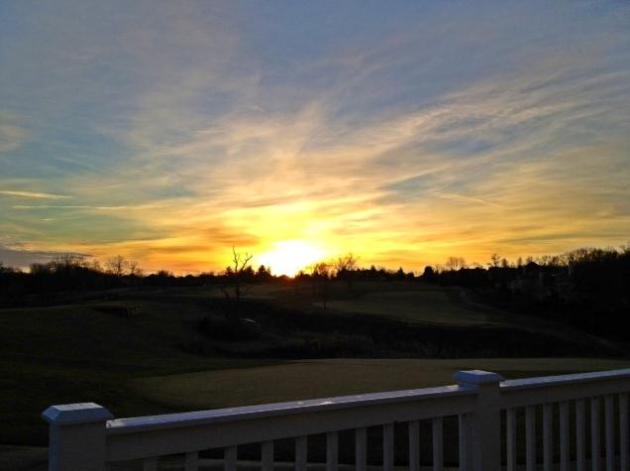
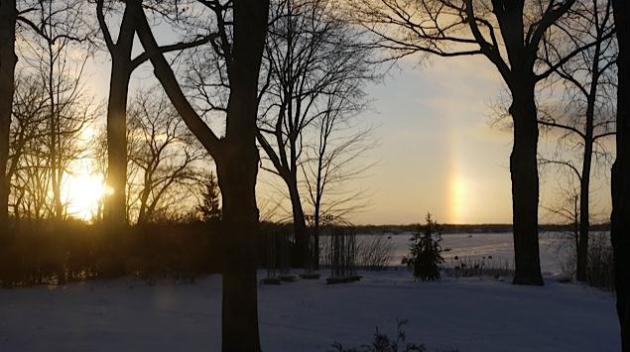
Kentucky Sunrise. Thanks to Maureen Kudravy, who took this photo of the Polo Grounds in Louisville, Kentucky with her trusty iPhone.
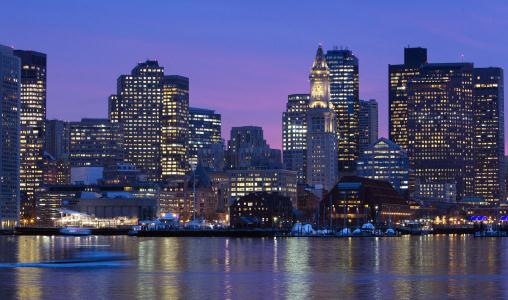
Boston's Growing Snow Drought:
Total snowfall as of yesterday: 7.6 inches for the Boston area.
Average total snowfall (30 years) as of Jan. 25: 20.8 inches.
Total snowfall by Jan. 25, 2011: 50.4 inches.
Annual average total snowfall for the last 30 years: 41.8 inches
Total snowfall for the winter of 2010-2011: 81 inches.
Latest snowfall: May 8-9, 1977. Boston received a half inch of snow. Worcester received about a foot.
Since 1892 there have been 10 years with less than 20 inches of total snowfall.
Least total snowfall: 9 inches for the winter of 1936-1937.
Second most least: 10.3 inches for the winter of 1972-1973.
Third least: 12.7 inches for the winter of 1979-1980.
Haverhill spent about $2.2 million on snow plowing and associated operations last winter. The city has spent approximately $275,000 this year, Haverhill's public works Director Michael Stankovich said.
Source:
http://www.eagletribune.com/haverhill/x1296870112/What-a-difference-a-year-makes (thanks to Chad Merrill at Earth Networks for passing this on).
* Boston skyline photo above courtesy of Michael Dwyer, AP.
Twisters: Scientists Come Closer To Finding Method To Predict Tornadoes. Here's an interesting, and potentially promising, story from The Christian Science Monitor and
The Alaska Dispatch: "
Scientists have developed a fledgling ability to predict monthly tornado activity in the US up to one month in advance. The technique, which uses existing weather-forecasting tools, is not yet ready for prime time. But in initial tests, the approach showed "statistically significant skill" in predicting regional tornado activity during most months of the year, including the peak of the spring tornado season, the researchers say. If the approach can be honed sufficiently, eventually it could allow forecasters to identify portions of states facing the highest risk for tornadoes in an upcoming month."
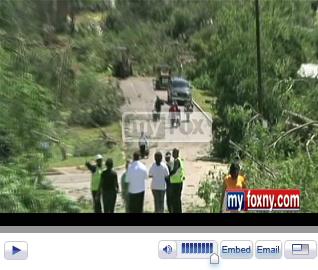
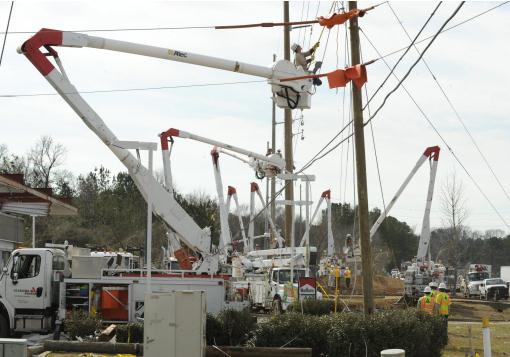
Photo credit above: "
Alabama Power crews work to restore power lines at Hwy 79 and Winewood Road in Birmingham, Ala., Jan. 25, 2012. Recovery and clean up continues in the areas affected by the January 23rd tornado (AP Photo/The Birmingham News, Joe Songer)."
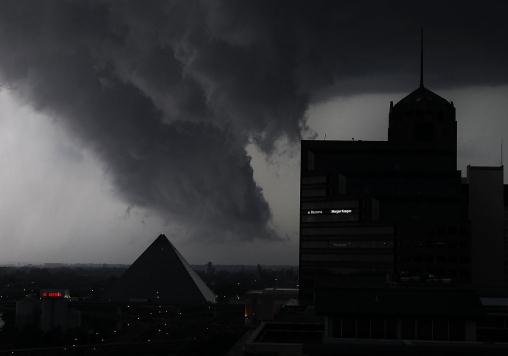
Tornado Mindset Takes Hold In Alabama. What is going on with tornadoes and the state of Alabama? Forget "Tornado Alley" - now "Dixie Alley" is generating most of the headlines, injuries and tornado-related deaths, especially the last 3 years.
The Birmingham News has more on the (new) mindset emerging among Alabama residents: "
In Alabama, tornadoes never go out of season. Last week's storms that killed two people, flattened communities and pounded a school offered a stark reminder of that fact. While tornadoes are most common in March and April, they can strike at any time of year, and experts say Alabamians can't afford to wait until spring to be ready. "We need to be prepared year-round," said Allen Kniphfer, the director of Jefferson County's Emergency Management Agency. The trick is knowing what that means."
Photo credit above: "
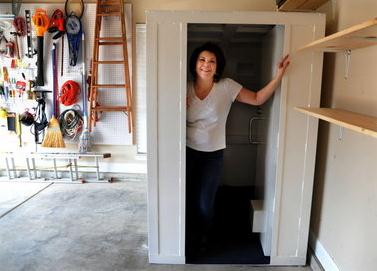
Susan Legate had an above-ground, 4-foot-by-6-foot storm shelter installed in her garage by Supercell Shelters in her Helena home. (Birmingham News Photo Linda Stelter)."
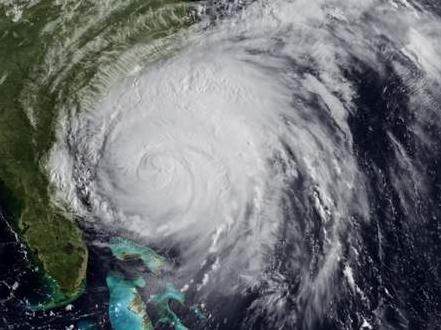
Researchers Study Cost-Effectiveness Of Storm Protection. The
Tartan Online has the story: "
Last year was plagued with monetary losses from tropical cyclones — Hurricane Irene was estimated to cost over $7 billion in damages alone, according to ABC News. With some scientists predicting an increase in intense weather due to the sea’s rising surface temperatures, it is becoming increasingly important to protect coastal populations. Researchers at Carnegie Mellon and Massachusetts Institute of Technology have collaborated to study the cost effectiveness of different approaches to storm management and to look at possibilities for the future."
Tornadoes In Unusual Places. Here is an update on a small tornado that touched down on Pakenham, a suburb of Melbourne, Australia, courtesy of
The Berwick Leader: "
Video footage has shown a tornado passing through Pakenham today. The 26 second video has been posted on Twitter following severe storms in Melbourne’s outer east. Weather bureau duty forecaster Michael Efron said he would have to closely study the video before confirming it was a tornado, but the natural phenomena were not unusual in severe weather. “We probably see a couple every second summer,” Mr Efron said. Today’s wild weather has passed, Mr Effron said. “The worst is over for Melbourne and the outer south east, but we will see showers redeveloping later in the evening,” he said."
*
video clip courtesy of yfrog.com.
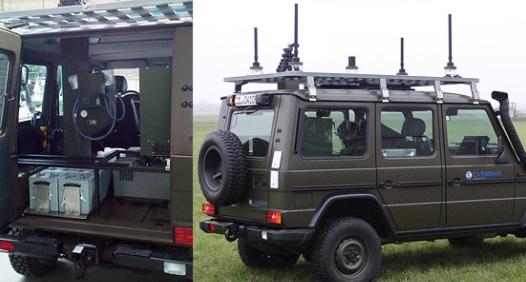
Next-Generation "Vehicle Protection Jammer" Protects Against IEDs. Here's an interesting story from
gizmag.com: "
Improvised Explosive Devices, or IEDs, are one of the largest sources of coalition casualties in Iraq. Many of these IEDs take the form of roadside bombs, which are hidden on or alongside a road, then detonated when a moving vehicle passes near them. While there is more than one way of causing these bombs to detonate, they are often set off by a hidden human observer, using a radio-control device. Forces using the new Vehicle Protection Jammer from EADS subsidiary Cassidian, however, should find themselves at a greatly-reduced risk of such attacks. The Jammer works by detecting and classifying radio signals that could be used to set off a bomb. It responds in less than a microsecond, by transmitting jamming signals tuned specifically to that band."
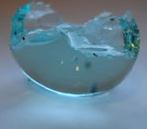
A Shower Of Blue Balls? Just when you think you've seen it all, along comes an odd story from
neatorama.com: "
Add this to the list of mysterious things that fell from the sky: Steve Hornsby from Bournemouth said the 3cm diameter balls came raining down late on Thursday afternoon during a hail storm. He found about a dozen of the balls in his garden. He said: "[They're] difficult to pick up, I had to get a spoon and flick them into a jam jar." [...]
Snowbird Trainee?
I'm feeling...guilty. For 28 winters I've been making fun of snowbirds, those wise and wimpy refugees who flee south for the winter, thumbing their collective noses at cold and snow.
Last fall NOAA's Climate Center was predicting a much colder and snowier winter for the northern USA. For the record I thought we'd have a drier winter with a continuation/escalation of the drought, but we were ALL caught off-guard by how mild it's been, in spite of La Nina.
5 of the last 8 months will wind up in the "Top 10 Warmest" category for the Twin Cities. Yes, it's a trend. Snow lovers are pretty despondent, while everyone else feels like they've won the Weather Lotto; more of a Louisville winter. "What happened to winter, Paul?" I hear this everywhere I go.
The pattern is locked: still no significant snow (or cold). This week will feel like March; 3 or 4 days above 40. Models are hinting at a cooler front by the end of next week, and I wouldn't be surprised to see 1 or 2 more nights below zero in February, but no numbing air is imminent. We're not quite out of the woods just yet, but (amazingly), I still suspect the worst winter is probably behind us now.
I do love the snow, but the older I get the harder it becomes to rationalize bitter cold and ice. So I scheduled 4 weeks off to "study tropical weather patterns". Duh. The reality: this winter we've all been transformed into reluctant snowbirds.
Climate Stories...
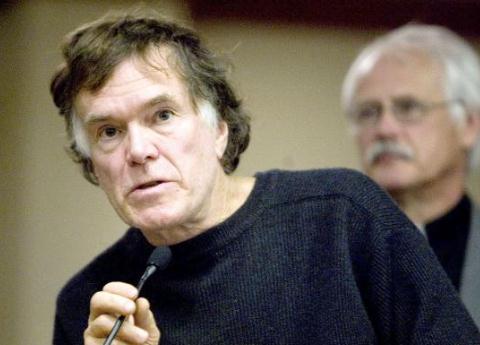 Will Steger: Make America Climate-Literate
. Here's an Op-Ed in the
Star Tribune: "
Even though I am most known as a polar explorer, my career and lifelong passion has been as an educator. As soon as I graduated from the University of St. Thomas in 1967, I taught middle-school science. At the time, scientists thought global warming was something that we would start seeing far into the future. I had no idea I would become an eyewitness to so many changes in my own lifetime. It wasn't until 2002, when the Larsen B ice shelf disintegrated from western Antarctica -- an ice shelf formed more than 12,000 years ago that my expedition team took a full month to ski across -- that the facts of global warming prompted me to take action."
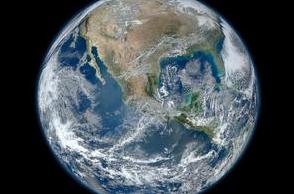
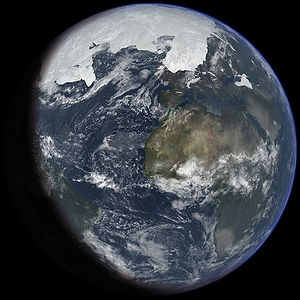
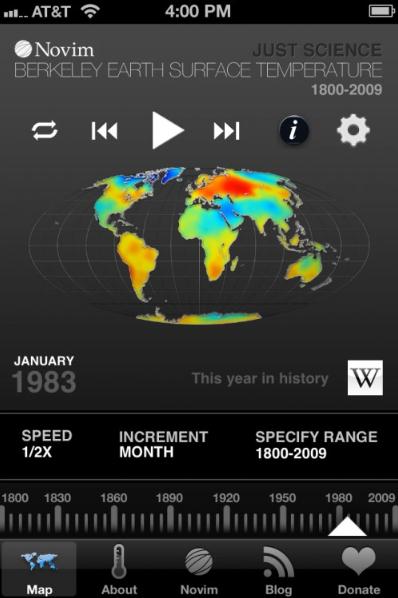
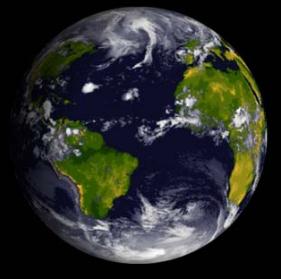
NASA Claims 2011 Was 9th Warmest Year On Record Worldwide.
Huffington Post has the details: "
Where did 2011 stand in comparison to global temperatures from past years? NASA recently released a visualization that depicts global temperature changes since 1880. Although nine of the 10 warmest years on record have occurred since 2000, 2011 was only the ninth warmest year on record, according to NASA. The world's average temperature in 2011 was 0.92 degrees Fahrenheit warmer than the mid-20th century baseline period of 1951 to 1980, NASA's press release explained. James E. Hansen, director of NASA's Goddard Institute for Space Studies in New York, said, "We know the planet is absorbing more energy than it is emitting. So we are continuing to see a trend toward higher temperatures. Even with the cooling effects of a strong La Niña influence and low solar activity for the past several years, 2011 was one of the 10 warmest years on record."
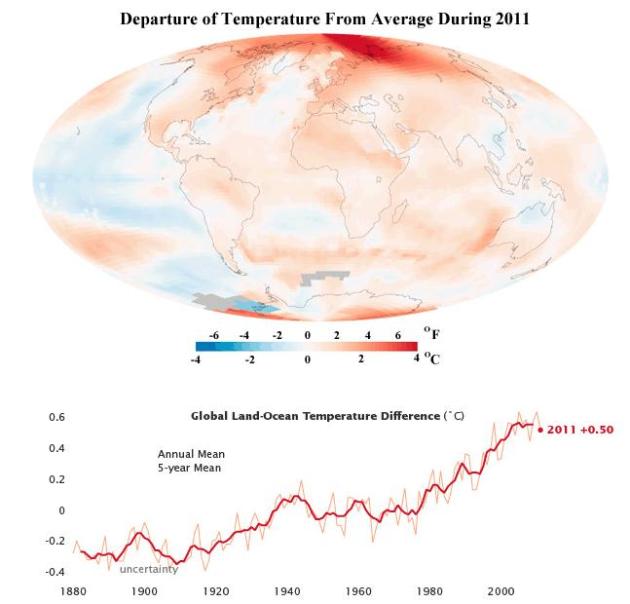
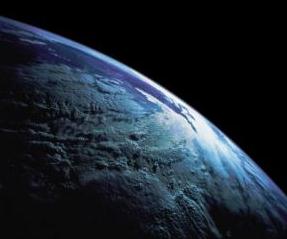
2011: Earth's 11th Warmest Year; Where Is The Climate Headed? Here's an important
recent post from Dr. Jeff Masters at Weather Underground: "
The year 2011 tied with 1997 as the 11th warmest year since records began in 1880, NOAA's National Climatic Data Center said last week. NASA rated 2011 as the 9th warmest on record. Land temperatures were the 8th warmest on record, and ocean temperatures, the 11th warmest. For the Arctic, which has warmed about twice as much as the rest of the planet, 2011 was the warmest year on record (between 64°N and 90°N latitude.) The year 2011 was also the 2nd wettest year over land on record, as evidenced by some of the unprecedented flooding Earth witnessed. The wettest year over land was the previous year, 2010." Graphic above courtesy of NASA's Earth Obser vatory and Weather Underground.
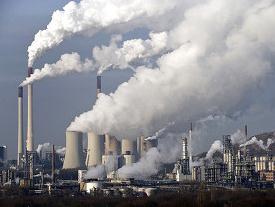
 New NASA Study Confirms Man-Made Influence Over Global Warming
.
Click Green has the story: "
A new NASA study confirms the fact that greenhouse gases generated by human activity - not changes in solar activity - are the primary force driving global warming. The study offers an updated calculation of the Earth's energy imbalance, the difference between the amount of solar energy absorbed by Earth's surface and the amount returned to space as heat. The researchers' calculations show that, despite unusually low solar activity between 2005 and 2010, the planet continued to absorb more energy than it returned to space. James Hansen, director of NASA's Goddard Institute for Space Studies (GISS) in New York City, led the research. Atmospheric Chemistry and Physics recently published the study. "
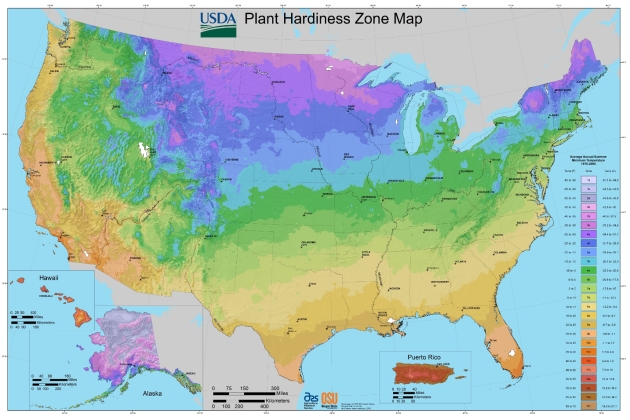
U.S. Dept. of Agriculture New "Hardiness Zones" Show Impact of Global Warming. Patterns are shifting north, to the tune of 100-150 miles, certain species of plants, flowers, shrubs and trees growing in places they couldn't grow a generation ago. The U.S. Department of Agriculture has updated their maps accordingly. Here's a press release from
prweb.com: "
Gardeners who have noticed some unusual goings-on in their yards had their suspicions confirmed this week when the US Dept. of Agriculture released its new map of plant hardiness zones. The map confirms what many gardeners have already figured out about global warming and the impact it is having on plants. Hardiness zones, based on minimum winter temperatures, are marching northward. This means that plants that wouldn’t have survived through winter in some regions just 20 years ago are now making it. Comparing the new 2012 map to the last map published in 1990 shows some significant shifts, especially across the Great Plains. Though the USDA cautions that not all the changes to the map can be attributed to climate change, it is clear that the major shifts are related to warmer temperatures. For example, Iowa and Nebraska used to straddle Zones 4 and 5, but now fall almost entirely within the warmer Zone 5."
 On Climate Change, Weathercasters May Be Misguiding Their Viewers
. The story from
Huffington Post: "
If you are like most Americans, the weather forecast on tonight's evening news may be your only exposure to science all day. And there's a good chance that your trusted local weathercaster is your only regular source of information on climate change. This seeming monopoly on the public's exposure to a critical issue has consequences, according to environmental advocates. Recent studies have found that more than half of the reporters relaying weather on television do not believe humans are the primary drivers of global warming -- despite a consensus among scientists who specialize on the topic."
Activists Want Climate Change On Local TV Weather Reports. Climate science doesn't lend itself to pithy, 10 second TV soundbites. Meteorologists are given 2-4 minutes to explain the weather; there's precious little time alloted to cover climate science. Not to say it's impossible to weave it into the weather narratives (since weather and climate are flip sides of the same coin), but it's not easy, trust me.
The Houston Chronicle has the latest on a campaign to expose climate "deniers", but are TV meteorologists even equipped to be able to provide accurate updates of the state of climate science? Who else is going to be able to share this with the viewing public on a regular basis? "
The fight for hearts and minds when it comes to climate change has moved to a new battleground: your television set. Climate change activists have launched a campaign, dubbed Forecast the Facts, that outs television meteorologists who are "deniers" of mainstream climate change science. Led by several groups, including 350.org, the League of Conservation Voters, and the Citizen Engagement Lab, the campaign was spurred by recent surveys finding that half or more of TV forecasters hold contrarian climate change views. "TV meteorologists have as much, if not more, opportunity to talk to the American public about climate change than anyone," said Daniel Souweine, director of the Forecast the Facts drive. "Ultimately, our goal is to change how the entire profession of meteorology reports on climate change," Souweine said."
Are Houston's TV Forecasters Climate Change Skeptics? Eric Berger, The "SciGuy" at
The Houston Chronicle, has more details: "
This weekend the Chronicle ran a story I wrote on the Forecast the Facts campaign, which essentially seeks to out TV meteorologists who hold contrarian views on climate change science. As part of that I asked the region’s main TV forecasters, when it comes to climate change, whether they’re more in agreement with statements by concurring organizations or non-committal statements. Here are their responses:
GENE NORMAN, KHOU-TV
“I’ve been studying this subject for a while; in fact, I’m currently reading “The Climate Fix” by Roger Pielke Jr. Sometimes perception is reality, proven by scientific measurement. I do see changes in weather patterns and increases in extreme weather but the linkage to human activity isn’t fully clear to me."
* photo of Gene Norman above courtesy of The Houston Chronicle.
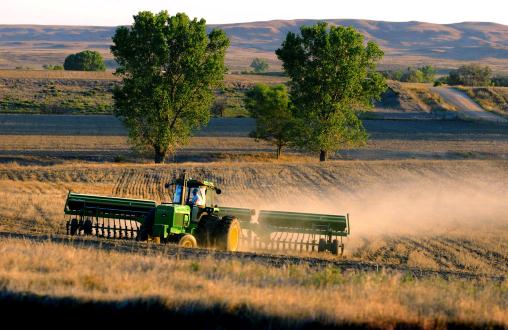
Research Shows Climate Change May Shrink Wheat Crop. The
ABC Network in Australia has the story: "
MARK COLVIN: New research predicts that climate change will have a far greater impact on wheat crops than expected. Scientists from Stanford University found that a two degree increase in temperatures would reduce the growing season by nine days, yielding 20 per cent less wheat. This could have a dire effect on global food security. Meredith Griffiths reports. MEREDITH GRIFFITHS: Wheat is the world's second biggest crop and provides a fifth of the world's protein. But it doesn't grow well in the heat."
Photo credit above: "
In a Sept. 28, 2011 (file) photo, Arlyn North plants a field to winter wheat as the early evening sun paints the hills with color along the Smoky Hill River southwest of Hays, Kansas. The nation's farmers seeded more winter wheat this season amid higher prices and easing drought conditions in Kansas, Oklahoma and Texas. The National Agricultural Statistics Service reported Thursday, Jan 12, 2012 that the 41.9 million acres of winter wheat planted for harvest in 2012 is up 3 percent from 2011 and up 12 percent from 2010. (AP Photo/The Hays Daily News, Steven Hausler)."
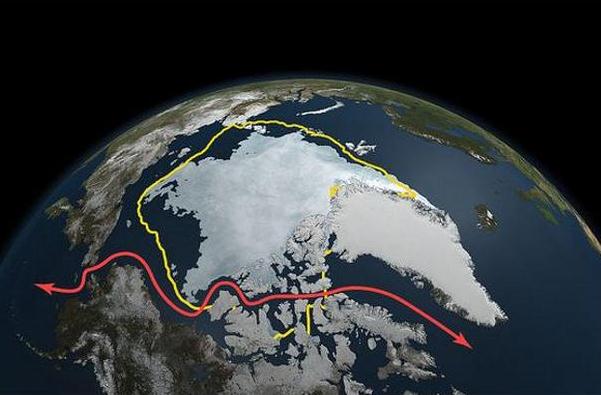
Arctic Ice Melt Lifts Hopes For Russian Maritime Trade.
Reuters has an update: "
SEVERODVINSK, Russia, Jan 27 (Reuters) - When severe snowstorms prevented life-sustaining fuel supplies from reaching the frozen Alaskan town of Nome, U.S. officials turned to a Russian company for help. The relief mission through perilous, ice-choked seas was the first mid-winter fuel delivery to western Alaska, capping a year of pioneering shipping as oil and gas development and climate change increase traffic along northern trade routes sought by centuries of Arctic explorers."
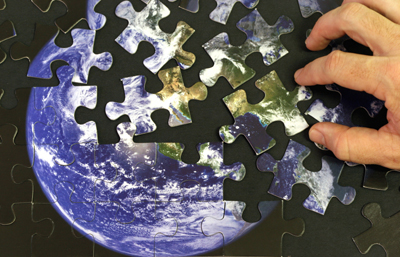
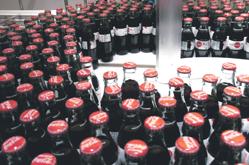
Big Business Adapting To Climate Change.
The Business Mirror has the story: "
THE world’s largest companies, once wary of the costs and risks of dealing with climate change, now realize they may provide key business opportunities in the years ahead. Over the past few years, big businesses began to realize that climate change was a business imperative that needed to be dealt with. The approach to environment issues has changed greatly, making it now a company’s core strategy, according to the United Nations’ climate agency that launched over the weekend a new online database showcasing successful business strategies in climate-change adaptation. The database, which can be accessed through the UN’s Framework Convention on Climate Change (UNFCCC) web site www.unfccc.int, features more than 100 examples from companies, such as Coca-Cola, Levi’s, Microsoft and Starbucks, which share the details of their business-friendly adaptation practices."