Super-Sized Clipper
Alberta Clippers usually elicit a shrug and a
yawn. Named after (speedy at the time) 19th century clipper ships, these
swirls of low pressure sneezed southward from the direction of Calgary
move too fast to tap moisture from the Gulf of Mexico. They're fickle; a
slight jog in track and a narrow 150-mile wide carpet of snow can shift
suddenly.
Think of the slow-moving, lumbering storm moving in
Monday as a clipper on steroids. What it lacks in moisture it'll make up
for in persistence.
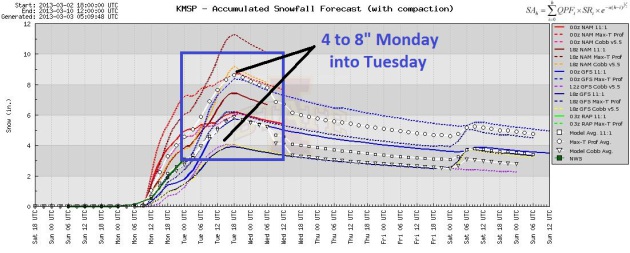
This may be a 36-48 hour snow event -
temperatures aloft cold enough for all snow. How much? It looks ery
plowable; a band of 4-8 inches setting up near or over the metro area.
Travel goes from bad to worse late Monday into Tuesday morning, but a
surface temperature from 25-30 F. means MnDot crews MAY be able to keep
freeways slow and slushy. A March snow is a different beast than a cold,
powdery January storm. Expect less ice, more slush.
Leave extra time to get around town late Monday
into Tuesday. This looks like an early "Tournament Storm"; as much as 1
inch of liquid water - more evidence the pattern may be shifting.
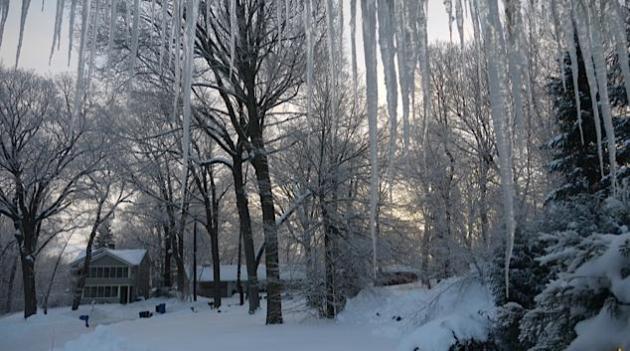
Get out and romp in it - a week from now we may see 40+ and rain.
Why Meteorologists Have Gray Hair and Ulcers.
Alberta Clippers are notoriously fickle, a slight jog in the storm track
can make a difference between flurries and 6" of flurries. The GFS has
the heaviest snow bands just south/west of the Twin Cities. More changes
are likely between now and when the flakes start to fly later in the
day Monday. Count on it.
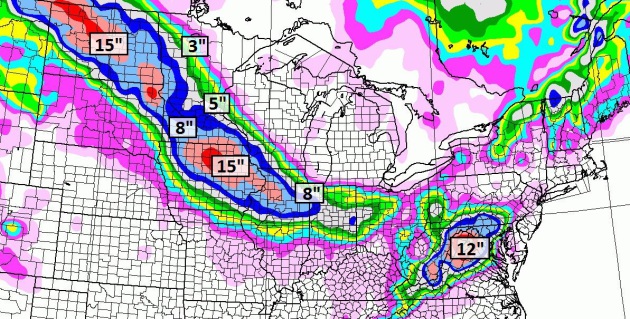
A Wide Range. Confidence levels are rising that
we'll see a plowable snowfall in the Twin Cities metro (and much of
central and southern Minnesota for that matter). There's still a
formidable range in expected amounts, most models aligning between 4-8"
by Tuesday evening. Graphic: Iowa State.
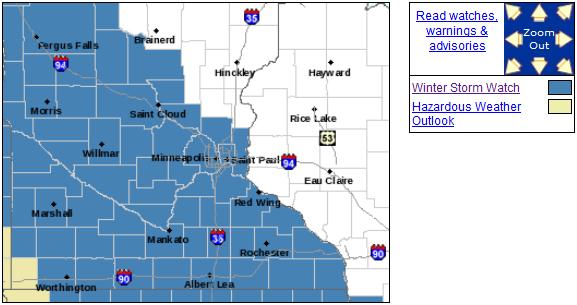
Winter Storm Watch. The National Weather Service has
issued a Winter Storm Watch, meaning a potential for at least 6" of
snow - best chance of higher amounts south/west of MSP. Details from the
local National Weather Service:
...SNOWFALL EXPECTED FROM SUNDAY NIGHT INTO TUESDAY...

.A WINTER STORM IS EXPECTED TO IMPACT THE NORTHERN PLAINS AND
UPPER MIDWEST FROM SUNDAY THROUGH TUESDAY. THIS SYSTEM MAY BRING
SNOWFALL ACCUMULATIONS OF 6 INCHES OR MORE TO MUCH OF CENTRAL AND
SOUTHERN MINNESOTA. AT THIS TIME... THE GREATEST THREAT FOR HEAVY
SNOW IS ALONG AND WEST OF A LINE FROM LITTLE FALLS TO ALBERT LEA.
CONFIDENCE HAS INCREASED ENOUGH THAT WINTER STORM WARNINGS MAY BE
ISSUED LATER TONIGHT FOR PORTIONS OF THE REGION. PLEASE CHECK
LATER WINTER WEATHER MESSAGES FOR MORE DETAILS AND POSSIBLE
WARNINGS.


...WINTER STORM WATCH REMAINS IN EFFECT FROM SUNDAY EVENING
THROUGH LATE MONDAY NIGHT...

A WINTER STORM WATCH REMAINS IN EFFECT FROM SUNDAY EVENING
THROUGH LATE MONDAY NIGHT.

* TIMING: ACCUMULATING SNOW DEVELOPING SUNDAY NIGHT IN WEST
  CENTRAL MINNESOTA AND THEN SPREADING EAST AND SOUTH ON MONDAY.
  THE SNOWFALL WILL CONTINUE THROUGH MONDAY NIGHT...BEFORE
  DIMINISHING ON TUESDAY.

* MAIN IMPACTS: SNOW ACCUMULATION OF 6 INCHES OR MORE POSSIBLE
  ALONG WITH DIFFICULT TRAVEL CONDITIONS.

PRECAUTIONARY/PREPAREDNESS ACTIONS...

A WINTER STORM WATCH MEANS THERE IS A POTENTIAL FOR SIGNIFICANT
SNOW...SLEET...OR ICE ACCUMULATIONS THAT MAY IMPACT TRAVEL.
CONTINUE TO MONITOR THE LATEST FORECASTS.
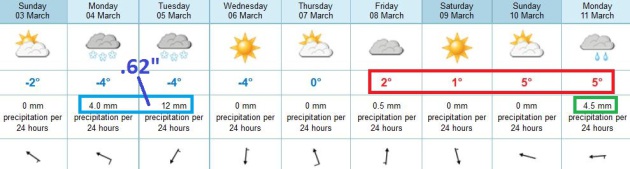
Looks Like March: Snow and Rain In The Same Outlook.
The ECMWF model prints out about .62" liquid Monday and Tuesday. With
surface temperatures between 25-31 that should equate into a snow/rain
ratio of closer to 10/1, or about 6" of snow (if you buy the European
solution). We warm up late next week, low 40s possible early next week;
even a little rain a week from tomorrow. Something for the entire
family.
Preliminary February Climate Summary. Here's an excerpt of Mark Seeley's always-excellent weekly edition of
WeatherTalk: "
Most
observers in Minnesota reported a mean monthly temperature for
February that was 2 to 4 degrees cooler than normal. Since June of 2011
(a 21 month period), February 2013 is only the 2nd month with a
statewide average temperature that is cooler than normal (the other was
October 2012). Extremes for the month were 45 degrees F at Grand
Rapids on the 27th and -39 degrees F at International Falls on the 2nd.
Precipitation was generally abundant during the month of February,
except for small portions of southwestern Minnesota. It was the wettest
February statewide since 2007. Many observers reported over 2 inches
of precipitation, most of which came as snowfall..."
March 2013: Nothing Like March 2012. Last year we
had late May in mid-March, nearly 14,000 warm weather records. It was
the warmest March in U.S. history. This year the pattern is dramatically
different, the core of the jet stream farther south, more Canadian air
spilling south of the border. In today's edition of
Climate Matters I compare March 2012 and March 2013, and track another potential Nor'easter late next week: "
Almost
half the country started March with snow on the ground. What's in
store the rest of this month? Meteorologist Paul Douglas doesn't think
it will be anything like the March of 2012 when nearly 14,000 warm
weather records were broken. In fact, fresh snow could be in store for
many over the next week."
How The Sequester Impacts Weather And Hurricane Reporting. Here's a story that caught my eye; an excerpt courtesy of
Central Florida News 13: "
How
you are protected and receive information about extreme weather
conditions from the government could be affected by the sequester. The
National Oceanic and Atmospheric Administration, which runs the
National Weather Service and the National Hurricane Center, stands to
take a large hit if the sequester takes effect, according to the Obama
administration. The Department of Commerce, oversees NOAA, stated that
the budge cuts could potentially impact the public in a storm. In an
emailed statement, a spokesman wrote:
“These cuts would result in a gap in
weather satellite coverage, diminishing the quality of weather forecasts
and the warnings of severe weather events like hurricanes and
tornadoes...These impacts directly affect NOAA employees and
partners throughout the country: up to 2,600 NOAA employees would have
to be furloughed, approximately 2,700 positions would not be filled,
and the number of contractors would have to be reduced by about 1,400.
If sequestration is enacted, NOAA will face the loss of highly trained
technical staff and partners. As a result, the government runs the risk
of significantly increasing forecast error and, the government's
ability to warn Americans across the country about high impact weather
events, such as hurricanes and tornadoes, will be compromised..".
Photo credit above: "
(FILE/Kimberly Prosser, Brevard County Emergency Management) "Hurricane
hunter aircraft like this one in Brevard County could be forced to
reduce flight hours under budget cuts as outlined in the March 1, 2013
sequester."
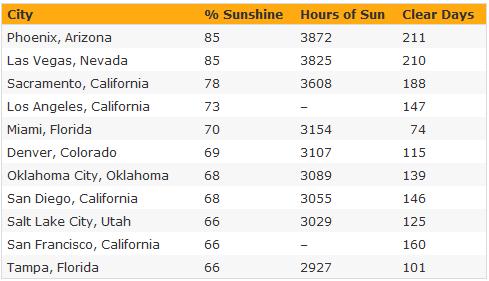
Percentage Annual Sunshine. The list above
highlights America's sunniest cities. Phoenix and Las Vegas get top
honors for the most sunshine (85% of daylight hours are sunny, on
average). As a point of comparison 58% of daylight hours in the Twin
Cities are clear to partly cloudy, a higher number than Chicago,
Milwaukee, Detroit or Boston. Source:
currentresults.com.
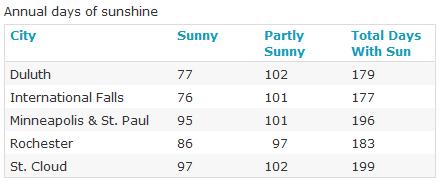
If Anyone Asks (Doubtful) St. Cloud Is Sunnier Than The Twin Cities. Who knew? I dug around the
currentresults.com web site and found the nugget above: St. Cloud is the sunniest (large) city in Minnesota. It should be a trivia question.
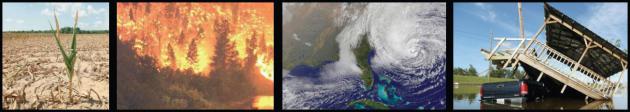
2012 U.S. Extreme Weather Overview. Here's a portion of an excellent recap and summary (PDF) of America's weather extremes during 2012 from
Climate Nexus: "
With
oppressive heat waves, devastating droughts, ravaging wildfires, and
hard-hitting storms, 2012 was one for the record books. Thousands of
precipitation and temperature records were broken, plaguing almost all
of the United States this year and underscoring the connection between
increasingly frequent and intense extreme weather and climate change.
With climate change, we’ve set the table for precisely this kind of
extreme weather, and unfortunately, our changing climate threatens to
alter the weather for years to come.
A year of extremes: 2012 was the second
most extreme year on record for the nation, according to the
U.S.Climate Extremes Index. The year had 11 disasters costing $1 billion
or more. The only year on record that had more billion dollar disasters
was 2011, which had 14. According to Munich Re, extreme weather caused
$107.2 billion worth of damage in the U.S in 2012...."
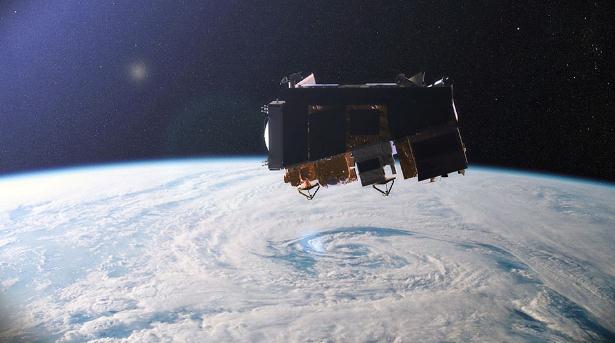
Going Blind: The Coming Satellite Crisis. The USA
has 24 earth-observing satellites in orbit right now; several of the
polar-orbiting satellites are about to go dark, and replacements may not
be available for a period of time, resulting in a potential
forecast-accuracy-gap. Some predictions have only 6 earth-observing
satellites in operation by 2020. More from
PBS Nova: "...
That’s
where polar orbiting satellites come in. They complement geostationary
satellites by trading frequent updates for sharper images. Polar
orbiting satellites sit much closer to Earth—generally about 500 miles
up—and complete a trip around the globe every 100 minutes or so. Most
Earth-observing satellites, weather and otherwise, fly in polar orbits.
With the right sensor, they can image the entire planet twice a day,
once on the day side, once on the night side. Their role in meteorology
is unquestionable. “The polar orbiting satellites give us the ability
to do long term weather forecasts,” says Jane Lubchenco, outgoing
administrator of the National Oceanic and Atmospheric Administration.
“Currently, NOAA’s forecasts go out 7 to 10 days. If we don’t have a
polar orbiting satellite, we would do 2 to 3 day forecasts. That’s a
huge difference...”
Image credit above: "
Suomi NPP is a weather satellite in low-Earth orbit—the only one the U.S. currently operates for civilian uses."
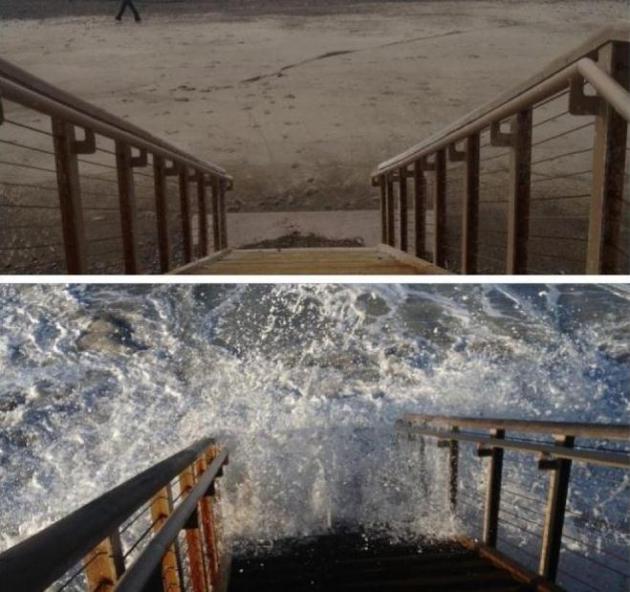
The King Tides. What Happens When The Sea Level Rises. This is the first I've heard the expression "King Tides"; here's a segment of an article at
Huffington Post: "
Did
California just get a glimpse of what future sea level may look like?
California experienced King Tides, especially high tides, during early
February. The King Tides come three times a year, predicted because of
the orbit and alignment of the Earth, sun, and moon. I was interested
in tracking them because I am an advocate for low-lying islands and
coastal communities, and I frequently write about issues facing these
islanders from an eyewitness perspective. The timing of the latest King
Tide in California turned out to be poignant, as the Solomon Islands
experienced an earthquake and subsequent tsunami that took lives and
again challenged the world to think about the way communities are
shaped and sometimes traumatized by the water..."
Photo credit above: "
Drowning Islands Facebook fan Tracey
Coleman took this before and after photo in San Clemente, California to
highlight the before and after effect of the King tide. Of all the
submissions received, this was my favorite - what a great shot."
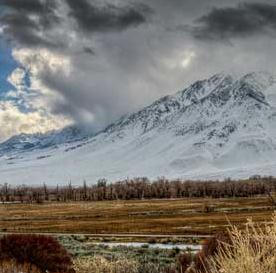
Asian And African Dust Influences North American Weather. Here's a snippet of a very interesting article at
Scientific American: "
In the western United States, winter precipitation is key to providing the water
states like Colorado and California need to survive their dry summers.
The snow and rain that comes in the cold season runs off into
reservoirs, where it is stored for drinking water, agriculture,
hydropower and other uses. Now, researchers have linked airborne dust
and other particles from as far away as the Sahara and Asian deserts
with the precipitation that falls over California's Sierra Nevada
mountains..."
Photo credit above: "
Researchers
have linked airborne dust from the Sahara and Asian deserts with the
precipitation that falls over California's Sierra Nevada mountains.
Pictured: mountains outside of Bishop, CA."
Image: Flickr/Justin in SD.
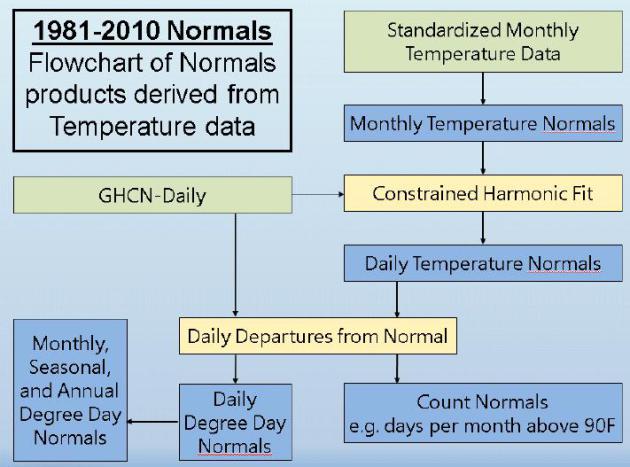
Ask Paul. Weather-related Q&A:
Hi Paul,
I am wondering how the 30 year average daily highs and lows are
measured. As someone who works with statistics, I would think that just
using mean average of 30 data points would make the measure unstable.
For example, if the last 30 years of data for January 20th had several
very warm high temperature outliers, the average may be moved up several
degrees, say to 26 degrees. Then if January 21 had several very cold
temperature outliers within 30 years, the average might be 17 degrees.
Yet when I look them up the temperatures seem relatively smooth from day
to day. Is there a special process used?
Brent Metfessel
Eden Prairie
Brent - I teed up your question with Greg Spoden, Minnesota's State
Climatologist. You are definitely on the right track with your
reasoning. Here is Greg's response to your question:
Dear Paul,
Your reader is right on the mark...the daily temperature normals are
derived using more math than simple arithmetic. If Brent wants to see
how the sausage is made, the National Climate Data Center (NDCD)
describes their methodology in
this document.
The "constrained harmonic least squares fit" technique used by NCDC
smooths day-to-day variations, plus assures that the mean monthly
normals are consistent with the means of the daily normals for a
particular month.
Greg Spoden
Minnesota State Climatologist.
House of Cards.
Netflix
is shaking up the TV world by making all 13 hour-long episodes of this
Washington D.C. based thriller available at once. And it's very, very
well done. Binge TV viewing anyone?
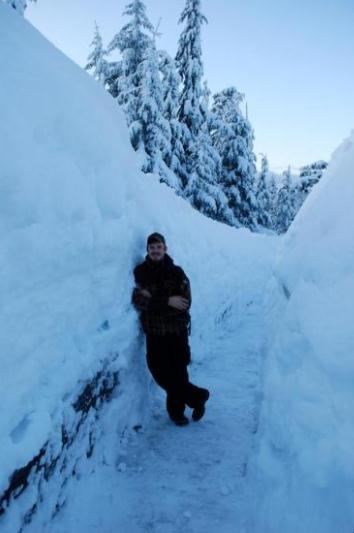
How Much? No, not this much.
Climate Stories...
Trapped As Climate Changes, Giant Gusts Of Hot Air Trigger Weather Extremes. Here's the intro to a story at
smithsonian.com that caught my eye: "
During the month of July 2011, the United States was seized by a heat wave so severe that roughly 9,000 temperature records were set, 64 people were killed and
a total of 200 million Americans were left very sweaty. Temperatures
hit 117 degrees Fahrenheit in Shamrock, Texas, and residents of Dallas
spent 34 consecutive days stewing in 100-plus-degree weather. For the
past couple of years, we’ve heard that extreme weather like this is tied to climate change, but until now, scientists weren’t sure exactly how the two were related. A new study published yesterday in the journal Proceedings of the National Academy of Sciences
reveals the mechanism behind events such as the 2011 heat wave. What it
comes down to, according to scientists at Potsdam Institute for
Climate Impact Research (PIK), is that higher temperatures caused by
global warming are disrupting the flow of planetary waves that
oscillate between Arctic and tropical regions, redistributing the warm
and cold air that usually help regulate the Earth’s climate. “When they
swing up, these waves suck warm air from the tropics to Europe, Russia,
or the US, and when they swing down, they do the same thing with cold
air from the Arctic,” lead author Vladimir Petoukhov of PIK explained in a statement...."
Photo credit above: "
Scientists have identified a link between global warming and extreme weather events such as heat waves." Photo by Flickr user
perfectsnap
Our View: America, Pick Your Climate Choices. Climate deniers and birthers in the same Op-Ed? Here's an excerpt from
USA Today: "
One
way to deal with a problem is to pretend it doesn't exist. This
approach has the virtue of relieving you from having to come up with a
solution, spend money or make tough choices. The downside, of course, is
that leaky faucets and other problems rarely solve themselves and, in
fact, usually get worse if ignored. Such is the case with climate
change, a threat that too many members of Congress, most of them
Republicans, have decided to manage by denying the science. That
head-in-the-sand approach avoids messy discussions of higher energy
prices, but it just got harder to justify..."
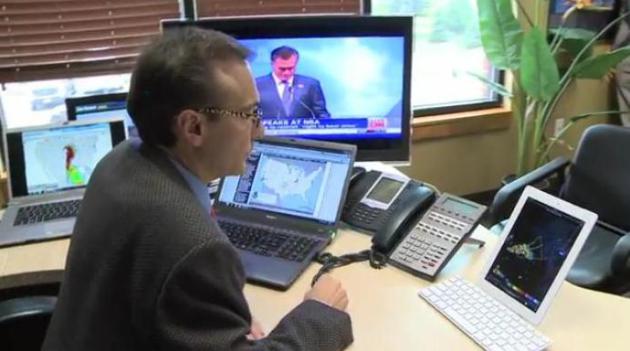
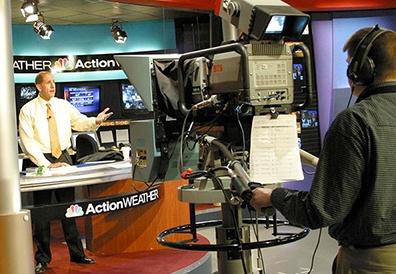
Climate Change, Conflict and TV Weather. Don't get
me started. I began talking about climate change and the trends I was
witnessing with Minnesota's increasingly manic weather back in the late
90s on WCCO-TV. I was looking at science, not policy implications or
politics, but even then there were some who saw this as evidence of a
vast, global conspiracy. Since then more TV meteorologists are talking
about climate change on the air, but it's a daily struggle. Why? Not
enough time allotted to accurately tell the story, and a desire to be
loved (by all). Because when you start talking about climate change on
the air you just know that 20-30% of viewers, especially older viewers,
will see this as a negative. Ratings and research drive local TV news;
every news director I've ever worked with told me "not to be
controversial". No negatives. Which is why talking about climate trends
can be kryptonite for TV meteorologists. Here's an excerpt of an article
from
NCAR: "...
Yet
in a 2011 survey of more than 400 weathercasters led by GMU’s Edward
Maibach, only 19% agreed that global warming was real and primarily
caused by humans, whereas 35% felt it was due to a mix of human and
natural causes and 29% believed it was primarily a natural phenomenon.
To get a clearer picture of what’s motivating or demotivating
weathercasters, the GMU group conducted 49 in-depth interviews with
weathercasters and moderated a workshop that drew on methods used for
conflict analysis and resolution. Analyzing their feedback, Schweizer
identified three main types of barriers.
- Occupational: Given that local TV news is a
highly competitive business, some weathercasters fear that discussing
climate change could cast them or their stations in a negative light.
- Social: Because climate change is such a highly charged topic, there’s a natural tendency to avoid conflict by avoiding the subject.
- Cultural: Among the 35% of weathercasters
in the above-mentioned survey who cited both natural and human factors
in climate change, many stressed the uncertainties inherent in any
research conclusion. Some also feared that politics might be affecting
the research itself, including the ways in which scientists presented
and discussed their policy-relevant findings. The 29% of weathercasters
who viewed climate change as primarily natural had even deeper
reservations about the process of climate science, including peer
review and funding decisions..."
Photo credit above: "
Gary Lezak (KSHB, Kansas City) is
among TV weathercasters who deliver occasional reports on the global
and local implications of climate change." (©UCAR. Photo by Carlye Calvin).
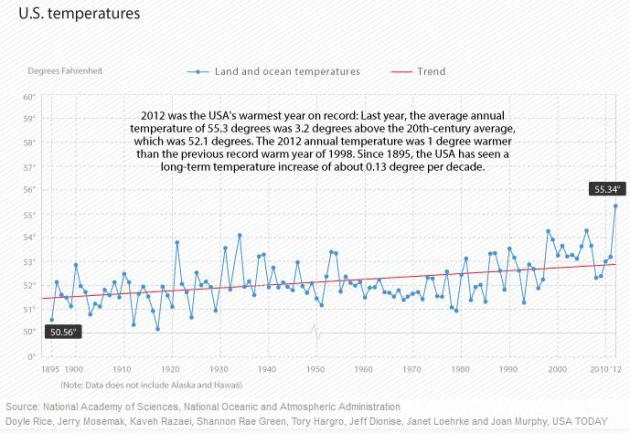
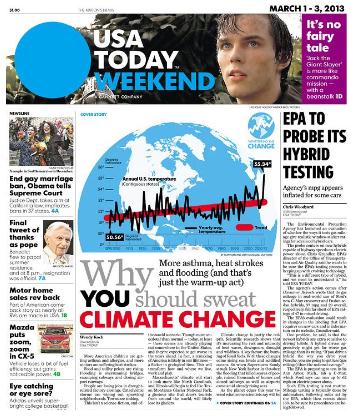
Why You Should Sweat Climate Change.
USA Today has some good interactive graphics that help to tell the climate story and the implications of a warmer, stormier pattern.
USA Today's Climate Change Series Comes At A Critical Time.
Media Matters has the story - here's the intro: "
USA TODAY announced
in its cover story today that it will be doing a year-long series on
climate change, sending reporters around the U.S. to examine how climate
change is already affecting Americans. The series, "Weathering The
Change," comes at time when climate change coverage -- including at USA
TODAY -- has been relatively low in the U.S.
USA TODAY covered climate change the least of the major national newspapers in the context of the 2012 presidential election. It entirely ignored how
climate change has worsened fire risks in the Western U.S. in its
print coverage of the destructive 2012 wildfires. It only mentioned
ocean acidification once between January 2011 and June 2012, and ignored a
study that found that the Great Barrier Reef has declined by 50
percent in the past 27 years largely due to human activities. And it closed its green blog in September 2012..."
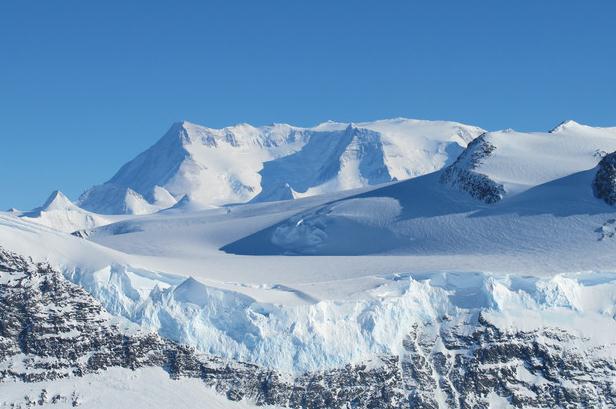
Study Of Ice Age Bolsters Carbon And Warming Link. Here's an excerpt of a story from Justin Gillis at
The New York Times: "
A
meticulous new analysis of Antarctic ice suggests that the sharp
warming that ended the last ice age occurred in lock step with increases
of carbon dioxide in the atmosphere, the latest of many indications
that the gas is a powerful influence on the earth’s climate. Previous
research suggested that as the world began to emerge from the depths of
the ice age about 20,000 years ago, warming in Antarctica preceded
changes in the global carbon dioxide level by something like 800 years.
That relatively long gap led some climate-change contrarians to assert
that rising carbon dioxide levels were essentially irrelevant to the
earth’s temperature — a side effect of planetary warming, perhaps, but
not the cause..." (Photo: James Yungel, NASA).
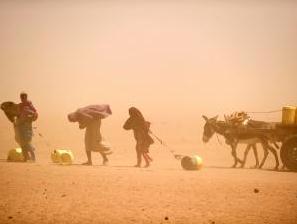
Humanitarian Disaster Blamed On Climate Change.
NewScientist has the story; here's the introduction: "
For
the first time, we have proof that climate change has led to a
humanitarian disaster. The East African drought of 2011, which resulted
in a famine that killed at least 50,000 people,
was partly caused by human emissions of greenhouse gases. The drought
was brought about by the failure of two consecutive rainy seasons: the
"short rains" in late 2010 and the "long rains" at the start of 2011.
Climatologist Peter Stott
of the Met Office Hadley Centre in Exeter, UK, and his colleagues ran
climate models, with and without a human influence on climate, and
compared the likelihood of the rains failing. Humanity's activities had
no effect on the short rains – they failed because of a strong La Niña
in the Pacific. "That's natural," says Stott. But climate change did
affect the long rains, making them more likely to fail (Geophysical Research Letters, doi.org/kmv). The model could only reproduce the scale of the drought if it included greenhouse gas emissions..."
Photo credit above: "
Was climate change to blame?" (Image: Reuters/Jakob Dall/Danish Red Cross/Handout)