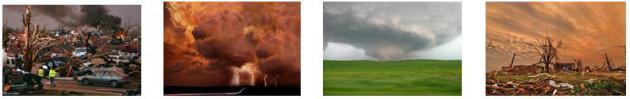
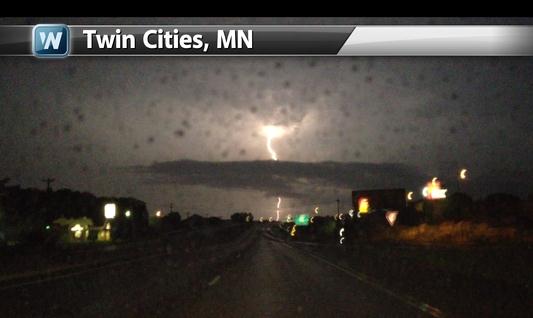
Monsoon Season. Here's what 3-4"+ in a short period of time is capable of. The photo in the upper left is from
KARE-11,
showing the minutes leading up to Lifetime Fitness's Triathlon, which
was delayed by flash flooding and lightning. Mark Kangas snapped the
photo of Minnehaha Falls on Saturday.
2.72" rain fell at MSP
International yesterday, a new daily record for July 13. 3-6" amounts were reported over the western and southern suburbs.
"
In 2011-2012, the United States experienced 25 floods, storms,
droughts, heat waves and wildfires that caused at least $1 billion in
damages each. An analysis
by the Center for American Progress found that the federal government,
or taxpayers, spent $136 billion from 2011 to 2013 in disaster relief –
equivalent to almost $400 per household per year...." - from a Think Progress story; details below.
Technical Difficulties
The toughest challenges in meteorology? Whether a
rotating T-storm will go on to tornado, will a hurricane get stronger
or weaker with time, how many inches of snow for my yard, and WHAT TIME
will that T-storm reach my house?
It was a simple question from one of our
clients, Lifetime Fitness. "Will there be lightning for the Saturday
morning triathlon?" We know when the atmosphere is ripe for T-storms,
but they're usually too small to show up on computer models. A new
generation of high-res NOAA models going out 15 hours offers more skill,
but most days we still can't determine, with any consistent skill,
whether T-storms will produce severe flooding more than 1-3 hours in
advance.
Saturday's warm frontal squall dumped over 4 inches on the southwest suburbs; about 5 week's worth of rain in 5 hours.
Guam-like rains.
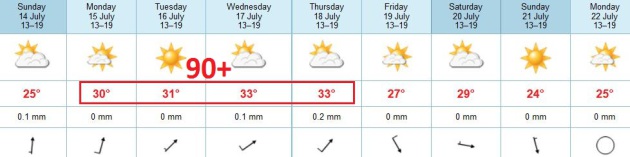
More T-storms pop today; enough hazy sun
trickling thru the murk for upper 80s. I expect 4 days above 90F in a
row this week - tomorrow into Thursday. The Dog Days.
I estimate at least 900 square miles of
southwest suburbs picked up 4" rain Saturday. That works out to 62
billion gallons of water, or 1.5 billion bathtubs full of water. Some
watery perspective.
Image above courtesy of
WeatherNation TV meteorologist Addison Green, who writes:
"
Our WeatherNation Studios are located in the suburbs of Minneapolis and
as I was driving to work early this morning (“Gotta Make the Donuts!”) ,
the lightning flashes were getting bigger and brighter. I took out my
phone and took some videos and wow, were the flashes really bright. I
was able to screen grab a few of the lightning bolts, like this one.
There were over a 1000 reported lightning strikes at one point from this
cluster of storms. The booms of thunder were so loud at one point, my
car shook! And in the studios, once I got to work, you could hear the
boom of thunder very clearly through the walls..."
Putting Excessive Rains Into Perspective. I
estimated a 30 by 30 mile area of the western and southwestern suburbs
picked up 4" or more of rain (it's a WAG, but I think it's in the
ballpark). Yes, you too can calculate how many bathtubs full of water
fell on the metro area, thanks to the
USGS.
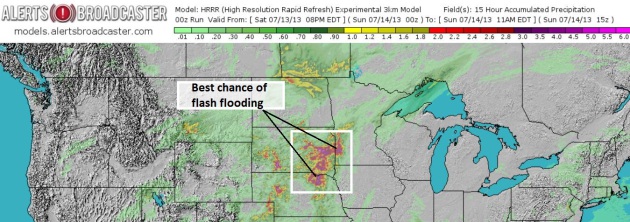
Sunday Flash Flood Potential. High-res NOAA models
are suggesting the best chance of excessive rains over eastern South
Dakota and far southwestern Minnesota into midday Sunday. Graphic: Ham
Weather and Alerts Broadcaster.
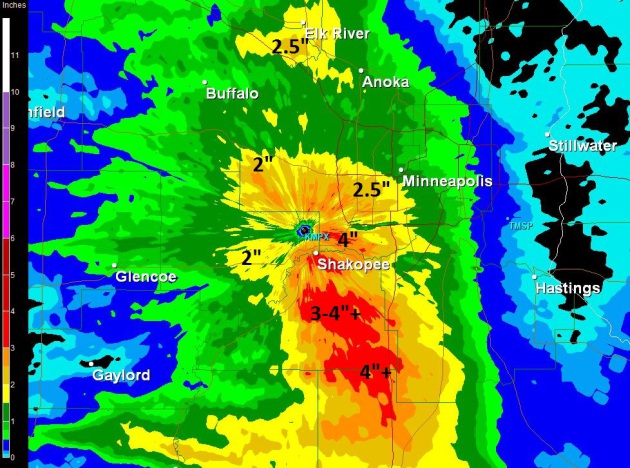
Rainfall Estimates. Here is a rough estimate of how
much rain fell overnight, based on MPX (Twin Cities) Doppler overlaid
over GR3: an impressive swath of 2-5" from Elk River across the
western suburbs into the Minneapolis area. The far southwestern
suburbs experienced the most rain; over 4" estimated from Eden Prairie
and Chanhassen to Lakeville, Shakopee and Prior Lake.
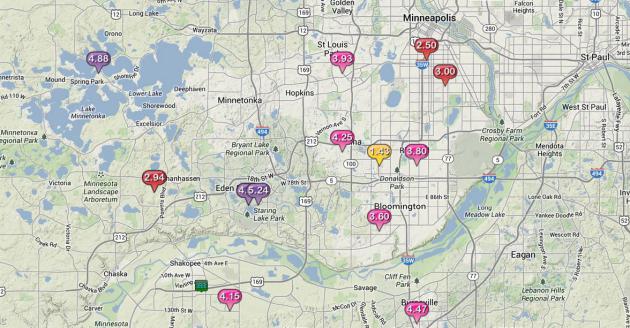
Serious Rains. 6.7" at Crystal Bay, near Lakeville.
That's nearly 2 months worth of rain falling in about 4-5 hours. Over 5"
at Eden Prairie and Northfield - 4+" of rain fell at Independence, Eden
Prairie, Chanhassen, Apple Valley, Shakopee and Prior Lake, 3" reported
in South Minneapolis, but under .5" for St. Paul. Amazing.
A Month's Worth Of Rain. A vast area of the western
and southern suburbs picked up 3-4" or more of rain early Saturday,
anywhere from 3 to 5 week's worth of rain in about 4-5 hours. The
result: serious flash flooding in many communities. A complete list of
storm damage from NOAA is
here.
A Little Dog Day Action. We got off to a slow start
in June, but maybe we'll make up for lost time in July. ECMWF guidance
shows highs at or above 90 Monday into Thursday, maybe a few days around
midweek with highs in the mid 90s. Summer heat may peak in the next 1-2
weeks.
84 Hour Animation. The Deep South remains soggy with
pop-up T-storms, east to west trade winds extending unusually far north
into Texas and Missouri. Most of the USA will be a hot, sticky holding
pattern, more T-storms over the Northern Plains and Upper Midwest. Loop:
NOAA.
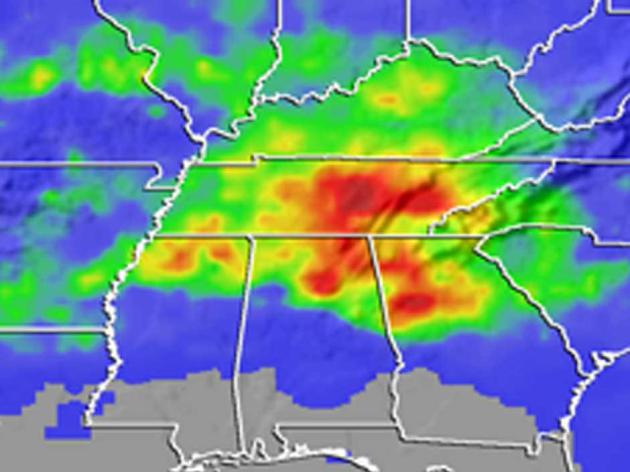
NASA Data Link Pollution To Rainy Summer Days in The Southeast.
Could smog/pollutants from vehicles and industry be seeding the clouds,
sparking more showers and T-storms during the work week, when there's
more traffic and activity in general? Here's a summary of a 2008 report
from
NASA: "
The
link between rainfall and the day of the week is evident in data from
NASA's Tropical Rainfall Measuring Mission satellite, known as TRMM.
Midweek storms tend to be stronger, drop more rain and span a larger
area across the Southeast compared to calmer and drier weekends. The
findings are from a study led by Thomas Bell, an atmospheric scientist
at NASA’s Goddard Space Flight Center, Greenbelt, Md. Bell said the
trend could be attributed to atmospheric pollution from humans, which
also peaks midweek. "It's eerie to think that we're affecting the
weather," said Bell, lead author of the study published online this
week in the American Geophysical Union's Journal of Geophysical
Research. "It appears that we're making storms more violent." Rainfall
measurements collected from ground-based gauges can vary from one gauge
site to the next because of fickle weather patterns. So, to identify
any kind of significant weekly rainfall trend, Bell and colleagues
looked at the big picture from Earth's orbit. The team collected data
from instruments on the TRMM satellite, which they used to estimate
daily summertime rainfall averages from 1998 to 2005 across the entire
Southeast..."
Image credit above: "
Torrential
rainfall from a 2003 storm in the Southeast resulted in massive
accumulations of rain (red). Similar data from NASA's TRMM satellite
has revealed that more rain falls midweek." Credit: NASA.
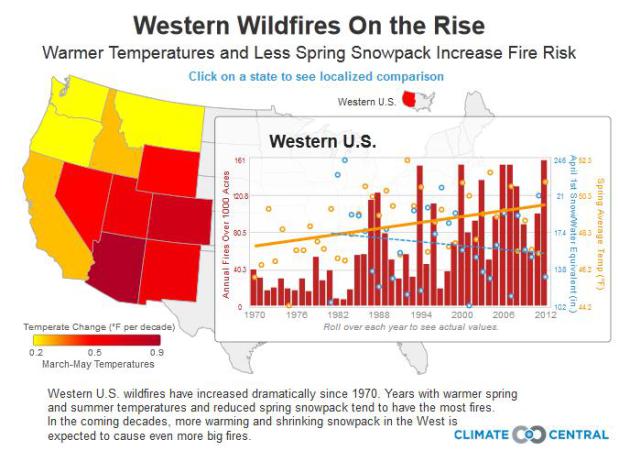
Rising Temperatures, Shrinking Snowpack Fuel Western Wildfires. The trends are pretty clear for the west due to a variety of factors, as reported by Climate Central: "Wildfire
trends in the West are clear: there are more large fires burning now
than at any time in the past 40 years and the total area burned each
year has also increased. To explore these trends, Climate Central has
developed this interactive tool to illustrate how warming temperatures
and changing spring snowpack influences fires each year. In our 2012
report, Western Wildfires,
we analyzed federal wildfire data stretching back to the 1970s to see
how fires have changed in the American West. In some states, like
Arizona and Idaho, the number of large fires burning each year has
tripled or even quadrupled. And in other states, including California,
Colorado, New Mexico, Nevada, and Wyoming, the number of large fires has
doubled..."
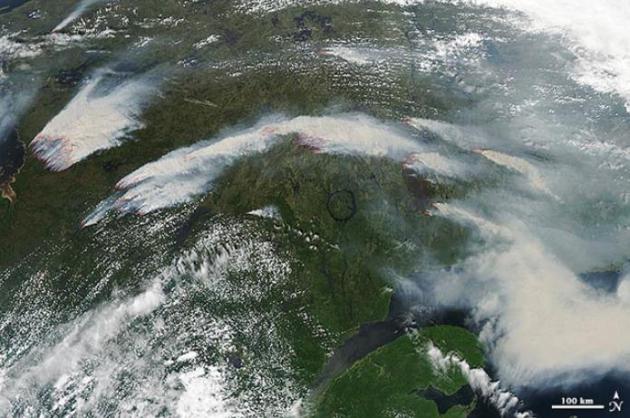
Canada's Second Largest Fire On Record Spreading Smoke To Europe.
Some of that smoke has been circulating back into the USA, making for
hazy (milky) skies and blood-red sunsets in recent weeks. Here's an
excerpt from Dr. Jeff Master's
WunderBlog: "
A
massive fire burning in northern Quebec is Canada's second largest
fire since fire records began in 1959, according to the Canadian Forest
Service. The fire was more than twice the size of Rhode Island on
Tuesday--1,621,000 acres. Called the Eastmain fire, the near-record
blaze was ignited by lightning on May 25, and was burning along a
100-km front near the east shore of James Bay by the village of Eastmain. At times, the fire spread at 19 mph (30 kph). The fire cut power to Montreal's subway system and to 10% of the population of Quebec (500,000 customers) on July 4, when smoke from the fire ionized the air by key hydroelectric power lines, causing a cascade failure..."
Image credit above: "On
July 4, 2013, the Moderate Resolution Imaging Spectroradiometer
(MODIS) on NASA’s Aqua satellite captured this image of wildfires
burning in western Quebec near James Bay. Red outlines indicate hot
spots where MODIS detected unusually warm surface temperatures
associated with fire. The Eastmain fire, which became the 2nd largest
fire since 1959 in Canada at 1.6 million acres, is at the upper left of
the image, just east of James Bay. Other fires near Nemiscau, Quebec
(about 150 - 200 km to the southeast of Eastmain) are also burning, but
these patches are "only" 120,000 - 200,000 acres. MODIS also observed
smoke from the fires moving across the Atlantic Ocean on July 5, July
6, and July 7. By July 8, smoke was drifting over Scandinavia." Image credit: NASA.
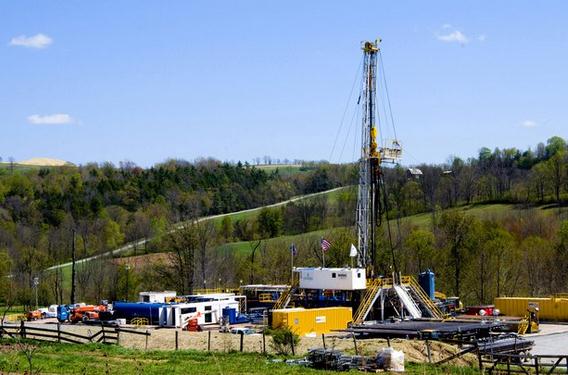
Pumping Water Underground Could Trigger Major Earthquake, Say Scientists. Huge injections of water for "fracking" have already sparked tremors; water apparently lubricating faults deep underground.
The Guardian has more: "
Pumping water underground at geothermal power plants can lead to dangerous earthquakes
even in regions not prone to tremors, according to scientists. They
say that quake risk should be factored into decisions about where to
site geothermal plants and other drilling rigs where water is pumped underground – for example in shale gas fracking.
Prof Emily Brodsky, who led a study of earthquakes at a geothermal
power plant in California, said: "For scientists to make themselves
useful in this field we need to be able to tell operators how many
gallons of water they can pump into the ground in a particular location
and how many earthquakes that will produce..." (File photo: Ralph Wilson, AP).
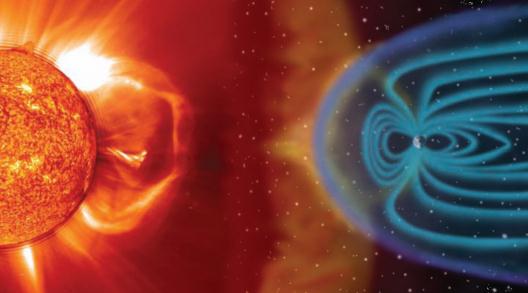
When Space Weather Attacks! Great headline, sobering reading, courtesy of
The Washington Post. Here's an excerp: "...
Today,
electric utilities and the insurance industry are grappling with a
scary possibility. A solar storm on the scale of that in 1859 would
wreak havoc on power grids, pipelines and satellites. In the worst
case, it could leave 20 million to 40 million people in the Northeast
without power — possibly for years — as utilities struggled to replace
thousands of fried transformers stretching from Washington to Boston.
Chaos and riots might ensue. That’s not a lurid sci-fi fantasy. It’s a sober new assessment
by Lloyd’s of London, the world’s oldest insurance market. The report
notes that even a much smaller solar-induced geomagnetic storm in 1989
left 6 million people in Quebec without power for nine hours..."
Image credit above: NASA.
Large Power Transformers And The U.S. Electric Grid.
Light reading this is not, but here is an important document focused on
the U.S. grid and vulnerabilities to space weather, as well as other
factors, courtesy of the
U.S. Department of Energy.
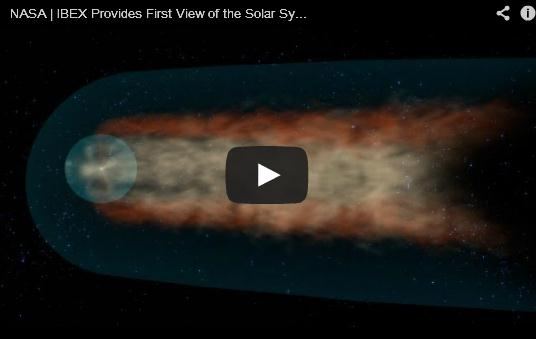
Breaking News: The Solar System Has A "Tail". Who knew? Apparently
NASA did; here's an excerpt from a recent press release: "
It
has long been assumed that our solar system, like a comet, has a
tail. Just as any object moving through another medium – for example, a
meteor traveling through Earth’s atmosphere – causes the particles to
form a stream trailing off behind it. But the tail of our solar
bubble, called the heliosphere, has never actually been observed,
until now. NASA’s Interstellar Boundary Explorer, or IBEX, has mapped
the boundaries of the tail of the heliosphere, something that has
never before been possible. Scientists describe this tail, called the
heliotail, in detail in a paper published on July 10, 2013, in The
Astrophysical Journal. By combining observations from the first three
years of IBEX imagery, the team mapped out a tail that shows a
combination of fast and slow moving particles. There are two lobes of
slower particles on the sides, faster particles above and below, with
the entire structure twisted, as it experiences the pushing and pulling
of magnetic fields outside the solar system..."
Image credit above: "
NASA's Interstellar Boundary Explorer has observed and described the solar system's tail for the first time." Image Credit: NASA/Goddard Space Flight Center.
America's Top States For Quality Of Life. I love the photo
CNBC
used for Minnesota, taken sometime in January? Good grief. In spite of
our well publicized winters we still came in at #3 overall, just behind
Vermont and Hawaii. I get Hawaii, but Vermont....really? Here's an
excerpt: "
The North Star State has something to offer almost
everyone. Enjoy the natural beauty of the North Woods or the
cosmopolitan sophistication of the Twin Cities. And everyone, it seems,
is "Minnesota Nice" - so much so that the crime rate is among the
nation's lowest. The home of the famed Mayo Clinic is one of America's
healthiest states, and the environment is among the cleanest. But if
you're not a fan of winter, beware. With an average annual temperature
of just 41.2 degrees F, Minnesota is one of America's coldest states.
But they'll tell you - nicely - that they know how to adapt...."
2013 Quality of Life Rank (Points): #3 (242)
2013 Overall Rank: #15
2012 Quality of Life Rank: #5
Climate Stories...
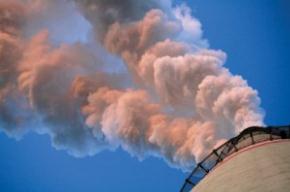
Climate Change Will Cause More Energy Breakdowns, U.S. Warns.
The New York Times has the story - here's an excerpt: "...
The blackouts and other energy disruptions
of Hurricane Sandy were just a foretaste, the report says. Every
corner of the country’s energy infrastructure — oil wells,
hydroelectric dams, nuclear power plants — will be stressed in coming
years by more intense storms, rising seas, higher temperatures and more
frequent droughts. The effects are already being felt, the report
says. Power plants are shutting down or reducing output because of a
shortage of cooling water. Barges carrying coal and oil are being
delayed by low water levels in major waterways. Floods and storm surges
are inundating ports, refineries, pipelines and rail yards. Powerful
windstorms and raging wildfires are felling transformers and
transmission lines..."
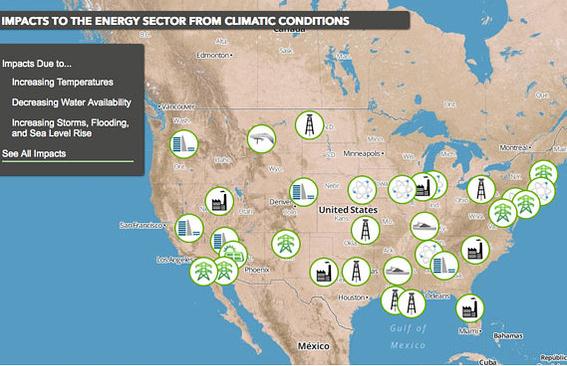
Climate Change Will Plague Energy Industry: DOE. Following up on the story above, here's a slightly different perspective from
CBS Marketwatch: "
Climate
change has created problems for the U.S. energy industry, and the
stress it brings on an aging energy infrastructure could cancel out the
coping mechanisms the industry has adopted, a Department of Energy
report released Thursday said. The report
highlighted the implications of climate change — droughts, fiercer
storms, flooding, and higher temperatures, to name a few — on energy. An interactive map,
showing where impact has already occurred, accompanied the report.
Droughts have raised the risk of shutdowns at power plants powered by
coal, natural gas, and nuclear energy by reducing the volume of water
available for cooling the plants..."
GOP Climate Disconnect Would Sacrifice Climate Research For Weather Forecasting. Slash climate research to make America's weather models more accurate? Great idea! Here's an excerpt from
Think Progress: "...
Both
sides agree that increased funding for weather forecasting research is
critical, but Democrats criticized Republican plans to take money away
from climate change research, which already contributes to weather
prediction capabilities. Rep. Donna Edwards (D-MD) pinned the blame
squarely on her GOP colleagues, in pointing out the folly of robbing
one forecasting program to pay for another.
There is a deep animus to anything related to climate research on the side of the majority…
But the fact is, climate impacts weather. Our experts need to have
full knowledge and expertise about this impact so there can be better
forecasting.
This logic failed to resonate with Republicans, as Vice Chairman
Jim Bridenstine (R-OK) explained his opinion that NOAA is spending too
much money on “ineffective research on climate,” and suggested weather
forecasting should be a higher priority than climate change research..."
Got Science? Pushing Back Against Corporate "Counterfeit Science". Here's a clip from
Huffington Post: "
Planted
scientific articles. Attacks on individual scientists. Recent
revelations in two separate court cases spotlight an often hidden form
of fraud: corporations deliberately trying to manipulate scientific
findings about the safety of their products. Documents in each of these
cases reveal corporate dirty tricks that are beneath contempt -- a kind
of "counterfeit science" that not only undermines the credibility of
the entire scientific enterprise, but can pose a serious threat to
people's health. For an egregious example, look no further than the
recently revealed scheme of Georgia-Pacific, a subsidiary of Koch
Industries. This June, a New York Appeals Court ruled unanimously that
Georgia-Pacific must hand over all internal documents pertaining to its
alleged efforts to tamper with the scientific understanding about the
health effects of asbestos..."