Basement Envy
What, if anything, will get you to go to the
basement when severe storms threaten? A text? A call from someone you
trust? An official warning or maybe visual confirmation of a tornado on
the ground? This gets into behavioral science & how we make smart
decisions, but seeing the KARE-11 helicopter footage from the 1986
Brooklyn Park twister got me thinking. I know, it happens rarely, as my
wife of 29 years likes to point out.
I really wrestle with this: by showing amazing
tornado video are we PROVING the threat is real, prompting people to get
off the sofa & do the right thing -OR- are we encouraging more
people to whip out their iPhones & remake a scene from the movie
Twister, placing themselves in danger?
Research suggests most of us need
multiple sources of confirmation (siren, text, e-mail, TV warning, NOAA
Weather Radio, app alert, etc) before we do the right thing - and head
for the basement.
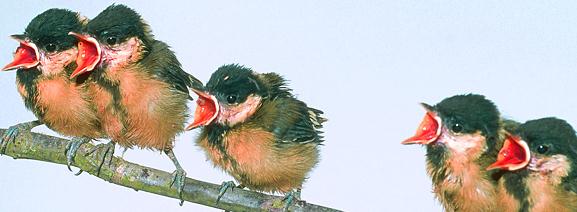
Today I'm grateful for a Canadian breeze: 70s
with a dew point in the 50s. A shower may sneak in this evening - a
better chance of showers & T-storms on Sunday, especially south of
St. Cloud & the Twin Cities. Next week? 70s and low 80s, cooler than
average; a few stormy episodes.
When it comes to heat & humidity Minnesota will be a whine-free zone.
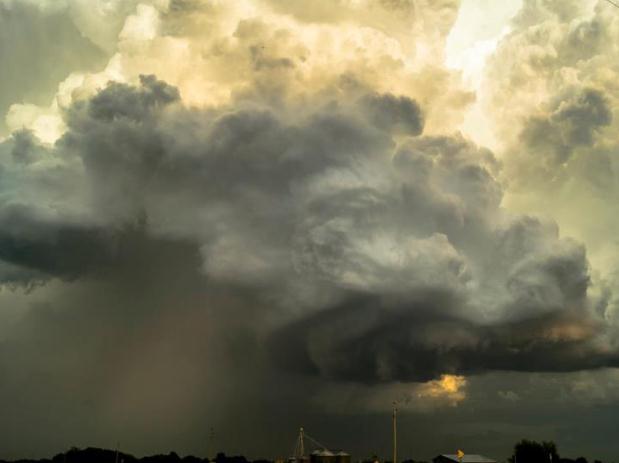
Photo credit above: Peter Carsten, National Geographic.
A Very Wet First Half of 2013. Dr. Mark Seeley has
more information on a very soggy start to the year over the Upper
Midwest; here's an excerpt from his latest edition of
WeatherTalk: "...
Further,
the Midwest Climate Center informs us that the first six months of
2013 (January-June) has been the wettest in history for Michigan
(20.80" statewide average), Iowa (24.93" statewide average), Wisconsin
(21.85" statewide average), and Illinois (29.11" statewide average). In
Minnesota it has been the 3rd wettest first six months of the year
averaging 16.93 inches statewide (this trails only 17.31 inches in 1908
and 17.83 inches in 1896). Harmony, MN (Fillmore County) has reported
nearly 35 inches of precipitation so far this year and their annual
normal is 34.63 inches!" (photo credit: Paul Brooks).
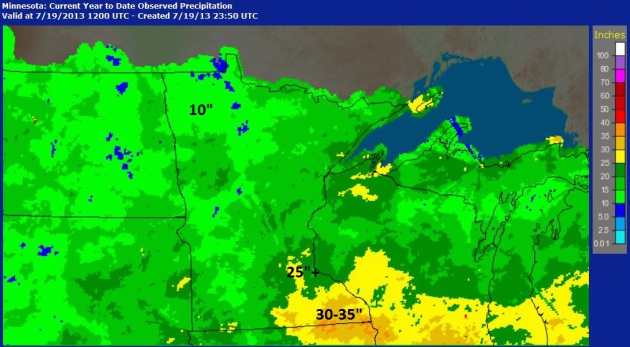
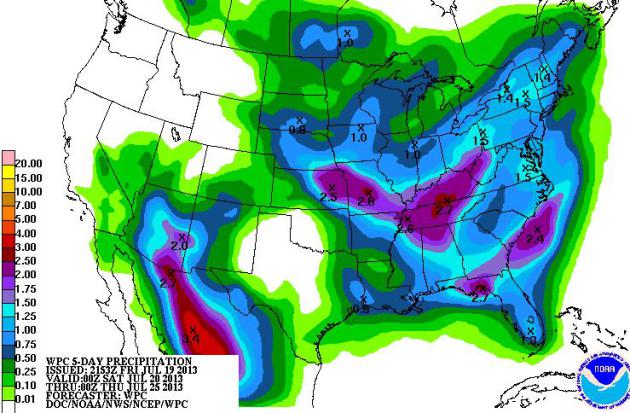
Year To Date Rainfall. Portions of southeastern Minnesota have already seen a year's worth of rain, 30-35", as of July 19, based on
NOAA rainfall guidance.
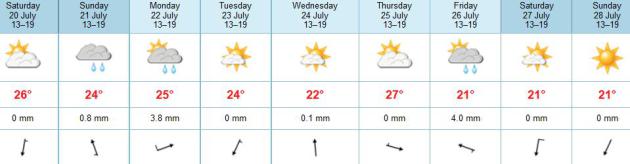
A More Seasonable Week. Temperatures will trend
cooler average (highs near 83-84, which is average for this time of
year). Showers and T-storms are most likely Sunday into Monday, another
round Friday. We get a welcome break from the heat and humidity, with
one possible exception.
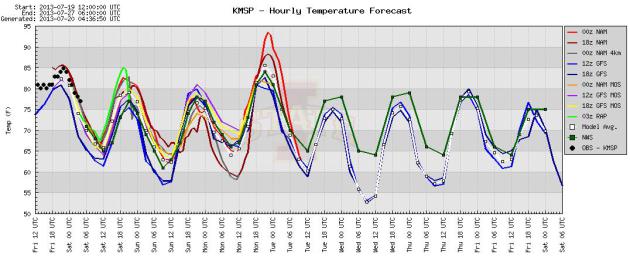
Trending Cooler. The 00z NAM is hinting at a hot,
humidified Monday with highs near 90F. Otherwise expect highs in the
upper 70s to near 80 into much of next week, a little free A/C.
Welcome Canadian Air. The same cool front dropping
temperatures and humidity levels over the Upper Midwest will spread
strong to severe T-storms across the Great Lakes and Ohio Valley into
parts of New England Saturday; by Sunday much of the Northeast will
experience a dip in temperature and dew point. Enjoy the break, because
more heat and moisture will build into next week. The far west remains
dry and ripe for more wildfires. 84 hour NAM loop: NOAA.
5-Day Rainfall. A stalling cool front will ignite
the heaviest showers and T-storms from Kansas City eastward to
Louisville and Nashville, more heavy rain for the Florida Panhandle and a
monsoon soaking for Arizona.
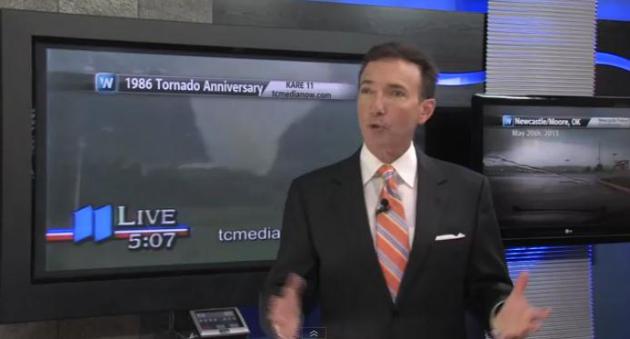
Anniversary Of 1986 Televised (KARE-11) Tornado - What Prompts You To Go To The Basement?
We've never had more effective ways of getting severe storm warnings:
media, sirens, NOAA Weather radio, e-mails, texts, apps. We're all
multitasking with various devices, one eye on the television, the other
on a laptop or smart phone/tablet. When you see video of a tornado on
the ground does it increase the odds of you heading for the basement, or
does it tempt you to go outside to see if you can tape the tornado on
your phone or camera, or maybe drive somewhere safer? Bad idea. I really
wrestle with this, with showing video of tornadoes. On the one hand it
provides unmistakable verification that rotation is, in fact, producing
an actual tornado. People usually need multiple sources of confirmation
from different sources before they do the right thing and head for
safety. Another part of me thinks we're distracting the audience,
tempting them to go outside and see the tornado for themselves. Here is
today's installment of
Climate Matters,
remember the Twin Cities tornado of 1986, covered from beginning to end
during a newscast, and tracked in real-time by KARE-11's helicopter.
There has never been a tornado quite like this one. "
WeatherNation
Chief Meteorologist was on set at KARE 11 when the 1986 Tornado tore
through the Twin Cities. Seeing the compelling footage again made him
ask, what prompts YOU to take cover? Is it seeing a tornado in your
area on TV? Is it hearing your local meteorologist talk about radar?
Maybe a text message to your phone? We want to hear from you. Tell us
below what gets you to the basement or sheltered space."
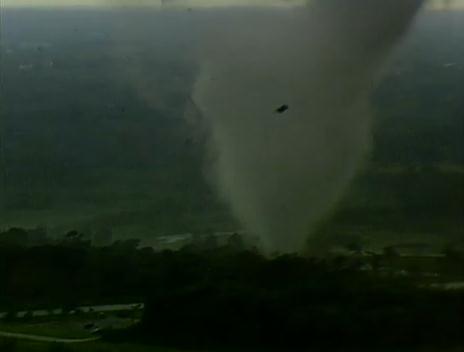
Tornado "LIve On KARE-11" 27 Years Ago. Video from
the nearly stationary, white, F-2 tornado has been studied by tornado
researchers - it's almost as if the tornado wanted to be photographed.
Luckily it hit a park (Springbrook Nature Center) in Brooklyn Park, and
not a heavily populated subdivision or shopping mall, although I was
pretty shaken on the air, thinking that any moment this thing would veer
into a nearby neighborhood and we would be witnessing carnage, live, on
the air. That didn't happen, thank God. Here's an excerpt of an
interview I gave
KARE-11 on Thursday: ""
People
are understandably skeptical because 70% of tornado warnings are false
alarms and that breeds this sense of apathy and complacency," Douglas
explained. As we all know, the other 30% of tornado warnings can lead to
events with devastating, and sometimes, deadly results. Douglas says
here in the metro area, we've had a relatively smooth summer
weather-wise so far. But, he says, don't become complacent. "Usually
the tornado season peaks in May and June in Minnesota but everything
has been delayed by at least one or two months. We're kind of limping
into summer and so I have a hunch that we are going to be tracking
severe storms much of the summer," he concluded."
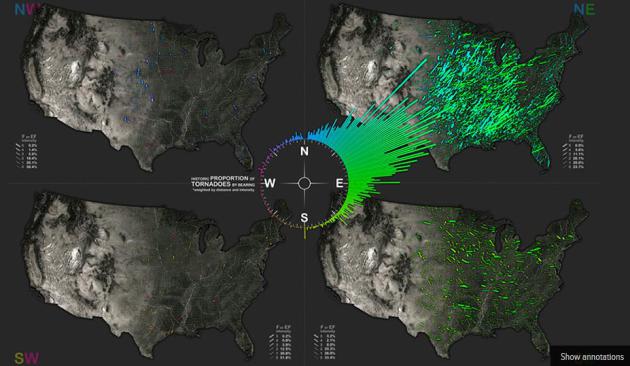
When Tornadoes Strike, Which Way Do They Travel? This
is pretty cool, one of the best visualizations and explanations of
tornado tracks. Of course there are exceptions to every rule, as the
deadly EF-5 El Reno tornado proved, when it suddenly veered 45 degrees
to the northeast, claiming the lives of 3 accomplished tornado
researchers. Details from
io9.com: "
These
gorgeous maps have the answer. Created by datavisualization expert
John Nelson, these "Tornado Travel Maps" depict the relative proportion
of more than 60 years of U.S. tornadoes by their direction of travel.
Notice a pattern? The maps are the latest in Nelson's growing ouvre of
gorgeous, natural-disaster-themed cartography. To date, he's produced
maps depicting more than a century's worth of global earthquakes, over 150 years of tropical storms and hurricanes, and a slew of major U.S. wildfires.
Each map is created from data made publicly available by organizations
like NASA, NOAA and the USGS. Every one of them is stunning, combining
troves of data with arresting visualizations to great (and incredibly
informational) effect. Nelson's latest creation is no exception. What's
more, it might one day be used to improve emergency response protocols
for some of America's most devastating tornados..."
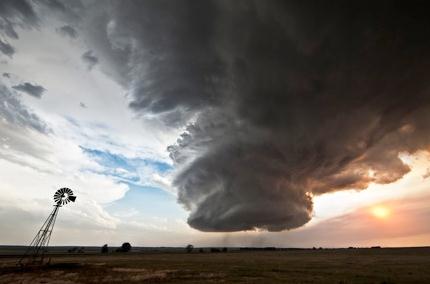
Watch: Surreal Photos Of Nature's Wrath. This is part of a TED Talk, one I encourage you to watch. Here's an excerpt from Camille Seaman's story at
Huffington Post: "...
For
several thousand years we have allowed a story that gives man dominion
over all the Earth's creatures to lead us to this place in which we as
humans are destroying not only our own habitat, water supplies, air
quality etc., but are taking out millions of our brother and sister
species in the process. The underlying goal of my work is to help
trigger an emotional connection, one that I hope will spark a
relationship between the viewer and this planet. It is so easy to do
harm to something or someone when you make it separate from yourself,
when you can place it below you or see yourself as somehow more
important than the "other." If you came to know that you cannot do harm
to any other being or thing without doing harm to yourself, you might
make different choices. Our planet is an awesome, wonderful and giving
verdant place that we so easily take for granted..."
Photo credit above: Camille Seaman.
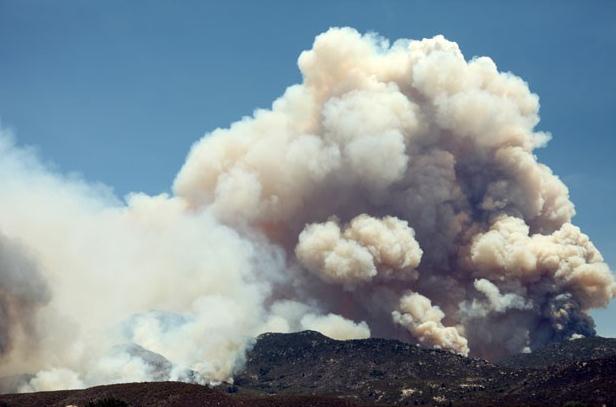
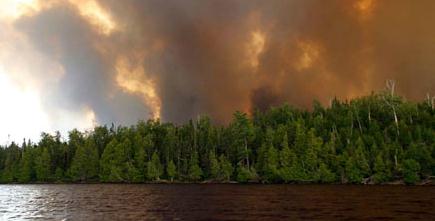
California Wildfire Now Tops 22,000 Acres. Mark my
words: this will be one of California's worst fire seasons on record.
The state picked up only 31% of their normal rain and snow since January
1, setting the stage for a growing drought, and a potentially historic
run of fires, which usually don't peak until October. Here's a clip from
U.S. News and World Report: "
A
massive wildfire that has been burning out of control in Southern
California forced the evacuation of about 6,000 people on Wednesday, as
firefighters are struggling to contain the 22,800-acre blaze. The
Mountain Wildfire, as it is called, started in the San Jacinto
Mountains on Monday, just west of Palm Springs. Since it started, the
fire has more than tripled in size. On Tuesday, the wildfire had destroyed several buildings
and burned through more than 14,000 acres of "steep and rugged
terrain." The blaze claimed 22,800 acres by Thursday morning, and was 15
percent contained..."
Photo credit above: "
Smoke rises from the Mountain
Wildfire near Lake Hemet, Calif. The fast-moving wildfire in the
mountains west of Palm Springs has forced some 6,000 evacuations."
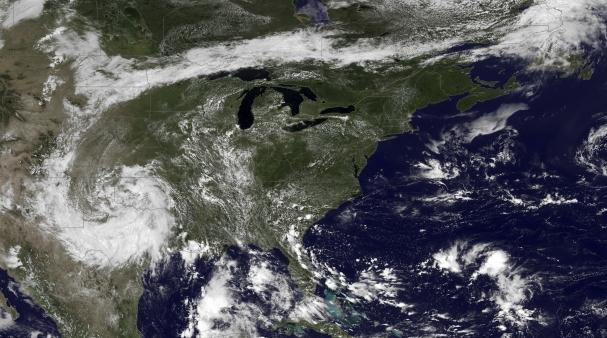
NASA Talks Global Warming, "Second Warmest June On Record". Here's the intro to a story at
Design & Trend: "
NASA reported that the only warmer June in the global temperature record was 1998, a year "juiced by global warming and El Nino."
June of 2013 teeters between a weak La Nina season and ENSO-neutral
conditions, meaning that climate experts projected normally
below-average global average temperature. According to Think Progress,
the accumulation of heat-trapping greenhouse gases were responsible for
contributing to the second hottest June on record. NASA's Goddard
Institute for Space Studies reports that the June 2013 surface
temperature anomalies, which can be viewed here..."
Image credit above: "
A high pressure system centered over
the Ohio Valley and a closed upper level low over the Texas/Oklahoma
border are bringing hot, muggy air to a broad swath of the eastern U.S.
as seen in this NOAA handout image taken by the GOES East satellite at
12:45 p.m. EDT (16:45 GMT) July 15, 2013." (Photo : REUTERS/NOAA/NASA/Handout via Reuters)
June 2013 Global Climate Update. Here's a clip from NOAA's climate.gov:
"In June 2013, many areas of the world experienced higher-than-average monthly temperatures. According to the latest statistics
from NOAA’s National Climatic Data Center, the globally averaged
temperature for the month tied with 2006 as the fifth warmest June since
record keeping began in 1880. It also marked the 37th
consecutive June and 340th consecutive month—that’s a total of more
than 28 years—with a global temperature above the 20th-century average. The last below-average June temperature was June 1976 and the last below-average temperature for any month was February 1985..."
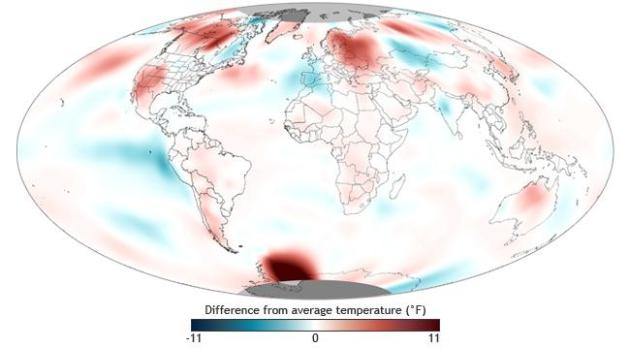
The map above shows temperatures relative to average across
the globe for June 2013. Shades of red indicate temperatures up to 11°
Fahrenheit warmer than the 1981–2010 average and shades of blue
indicate temperatures up to 11° Fahrenheit cooler than the average.
Record Heat In June Extends Globe's Streak To 340 Months. Meteorologist Andrew Freedman from
Climate Central has more details on the findings for June; here's a clip: "
Global
average surface temperatures during June were either the second or
the fifth-warmest on record for the month, based on analyses by NASA and NOAA,
respectively. The two agencies keep tabs on global temperature
trends using large networks of surface monitoring stations and
statistical approaches to fill in gaps where stations are sparse, but
they use slightly different methods to analyze the data, which can
result in slight differences in their rankings. June continued the
long-term warming trend tied to manmade greenhouse gas pollution as
well as natural climate variability. The planet has not recorded a
single month with temperatures below the 20th century average since
February 1985, when the cult classic film “The Breakfast Club”
was released, and the last year with a cooler-than-average June was
in 1976. This year so far is tied with 2003 as the seventh-warmest
year on record, NOAA said..." (Image above: NASA).
Interior Chief Says Drought May Cause Record Wildfires In U.S.
Bloomberg has the story. Image credit: DNR.
Bill To Shift NOAA Resources To Weather Marches On.
I'm all for having more powerful and accurate weather models, but
coming at the expense of climate modeling? Not sure that's an inspired
idea. Here's a clip from Andrew Freedman at
Climate Central: "
A
House bill that would mandate the nation’s top weather and climate
agency shift its priorities more toward short-term weather forecasting
has sped its way through the legislative process. The House Science
Committee is expected to consider it in the next few weeks. The bill
is aimed at changing how the National Oceanic and Atmospheric
Administration (NOAA) prioritizes its missions of weather, climate and
ocean science. Critics of the bill say that prioritization will
shortchange long-term climate research in favor of improving forecasts
of extreme weather..."
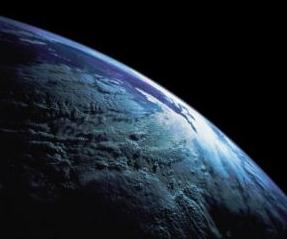
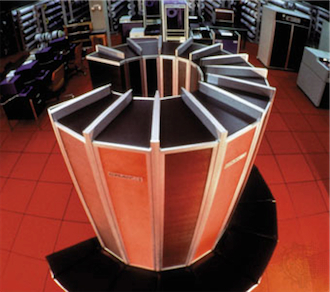
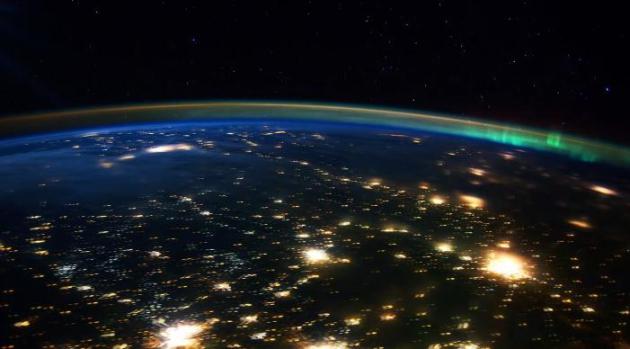
"Timelapse Earth" Will Leave You Humbled. This may be the best 4 minutes you spend today, courtesy of
fstoppers.com: "
Man
(or woman) can only dream what it looks like hovering above earth
watching the beauty of science orbit beneath them. Thanks to the ISS
(International Space Station) we have the next best thing, a timelapse.
“Some interesting tidbits about the ISS. It orbits the planet about
once every 90 mins and is about 350 Km/217 miles. The yellow/greenish
line that you see over the earth is Airgolw. All footage has been
color graded, denoised, deflickered, slowed down and stabilized by Bruce W. Berry.
Clips were then complied and converted to 1080 HD at 24 frames/sec.
Read on to learn what cameras they use and more info about the ISS...”
9 Most Common Regrets Of The Living And Dying - And What To Do About Them.
My goal (like so many others) is to live a life of no regrets, to not
look back and say "could-have, should-have, would-have". That's why I
found this story from
Next Avenue so interesting; here's a clip: "
In
spending time with patients during the last three to 12 weeks of
their lives, Ware gleaned vital insight into the concerns and regrets
of those faced with imminent death. Here are the core regrets as she
describes them in her Inspiration and Chai blog.
1. I wish I'd had the courage to live a life true to myself, not the life others expected of me.
This was the most common regret of all. When people realize that
their life is almost over and look back clearly on it, it is easy to see
how many dreams have gone unfulfilled. Most people had not honored
even a half of their dreams and had to die knowing that it was due to
choices they had made, or not made.
It is very important to try and honor at least some of your dreams
along the way. From the moment that you lose your health, it is too
late. Health brings a freedom very few realize, until they no longer
have it..."
Extreme Mowing. 0 to 60 in 4 seconds. On a lawn mower? Why not.
Gizmag.com has the details; here's a clip: "
Billed
as world’s fastest lawn mower, the Mean Mower is a (heavily)
modified version of on Honda’s HF260 Lawn Tractor that can make 0-60
mph (96 km/h) in 4.0 seconds – fast enough to put most exotic
full-sized autos to shame. This racy take on the riding mower
develops 96 Nm (70 lb.ft) of torque, 109 hp (which gives it roughly
100 more ponies than most of its lawn tractor brethren) and has a
power-to-weight ratio of 532 bhp/tonne thanks to a weight of only 140
kg (308 lb). To keep the whole thing legit, grass cutting remains
very much a part of the equation. Yes it still cuts grass, but only
at speeds up to 15 mph (24 km/h). But once the lawn has been
carefully manicured then feel free to take it out on the local
autobahn and run it out to an (estimated) 130 mph (209 km/h). Helmet
recommended..."
Photo credit above: "
Honda’s one-off HF260 Lawn Tractor is capable of reaching 60 mph (96 km/h) in 4.0 seconds."
Climate Stories...
Nonsense And Sensitivity: Top Climatologist Slams The Economist For Yet Another "Flawed And Misleading" Piece. Here's a clip from
Think Progress: "
Here’s The Economist’s
idea of responsible journalism. Begin by quoting UN chief climate
negotiator Yvo de Boer on the forthcoming fifth assessment by the
Intergovernmental Panel on Climate Change (IPCC):
THAT report is going to scare the wits out of everyone.
Then dig up some unpublished, unsubstantiated chart to make the
case “it might be less terrifying than it could have been.” No,
seriously, the Economist devoted an entire article to argue that a
draft climate change report “might be less terrifying than it could
have been.” I guess if The Economist had been leaked the draft medical
report from a decade ago that Steve Jobs had a neuroendocrine tumor of
the pancreas (rather than a carcinoma), they would have written an
entire piece explaining his condition “might be less terrifying than it
could have been...”
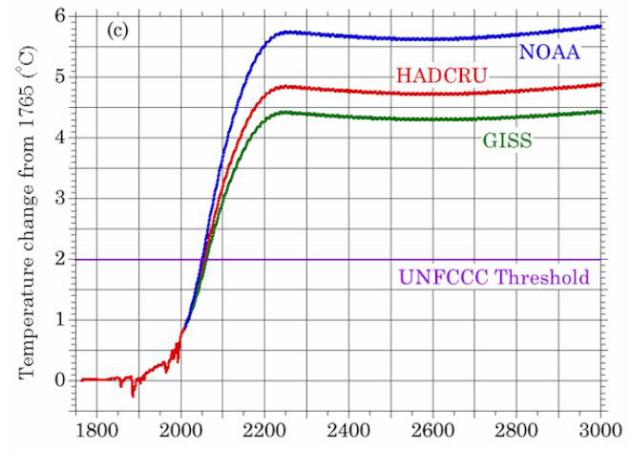
Graphic credit above: "
On our current emissions path,
projected warming is catastrophic even in the unlikely event of a low
climate sensitivity of 1.5 – 2.0°C. From Michael Schlesinger et al 2012."
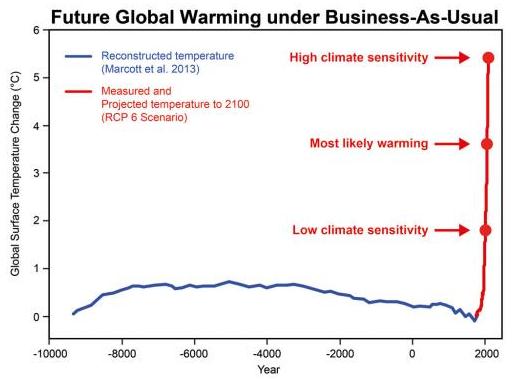
Future Global Warming Under "Business As Usual". Skeptical Science has the post: "
This
graph shows that even at the lowest range of climate sensitivity,
future global warming will take us well beyond any temperature
experienced during civilised human history. The blue line represents
reconstructed temperature (Marcott et al. 2013). The red line represents measured and projected global surface temperature (Meinshausen et al. 2011).
The red dots show the projected warming in the year 2100 for three
different climate sensitivities (high sensitivity 4.5C, most likely
sensitivity 3C, low sensitivity 1.5C). H/T to Joe Romm and Michael Tobis whose work inspired this graph.
For more info, see A Glimpse at Our Possible Future Climate, Best to Worst Case Scenarios..."
The CIA Wants To Know How To Control The Climate. Geo-engineering climate may be a technological savior, or a dangerous pipe-dream, right?
The Verge
and Mother Jones have a fascinating story on how the CIA and how they
are taking a morphing climate very seriously; here's the intro: "
The
US Central Intelligence Agency isn't just interested in gathering
intelligence on foreign powers and enemies. As it turns out, Langley is
also investigating the feasibility of altering the environment to
fight the effects of climate change. The CIA is currently funding, in
part, a $630,000 study on geoengineering, the science of using experimental techniques to modify Earth's climate, as Mother Jones
reports. The 21-month-long study was commissioned by the National
Academy of Sciences, a nonprofit group of scientific advisors to the
government, and a final report on its findings is due to be published
in the fall of 2014..."
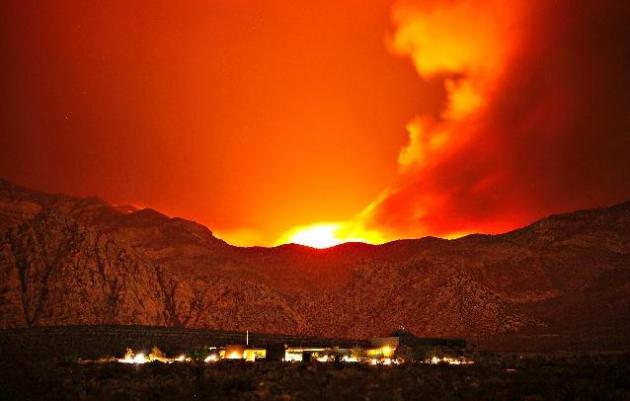
Reid Blames Climate Change: "West Is Burning". Here's a clip from
The Las Vegas Review-Journal: "
As
firefighters head home from Southern Nevada, U.S. Sen. Harry Reid on
Wednesday blamed “climate change” for the intense blaze that consumed
nearly 28,000 acres and drove hundreds of residents from their homes
around Mount Charleston this month. Reid said the government should be
spending “a lot more” on fire prevention, echoing elected officials
who say the Forest Service should move more aggressively to remove
brush and undergrowth that turn small fires into huge ones. “The West
is burning,” the Nevada Democrat told reporters in a meeting. “I could
be wrong, but I don’t think we’ve ever had a fire in the Spring
Mountains, Charleston range like we just had. “Why are we having them?
Because we have climate change. Things are different. The forests are
drier, the winters are shorter, and we have these terrible fires all
over the West....”
Photo credit above: JOHN LOCHER/LAS VEGAS REVIEW-JOURNAL. "
The
Carpenter 1 Fire burns in the mountains behind the Red Rock
Conservation Area visitor center near Las Vegas early in the morning of
Thursday, July 11. The fire has forced the closure of the Red Rock
National Conservation Area Scenic Loop."
The Era Of Corporate Silence On Climate Policy Is Ending. The
Harvard Business Review has the story; here's the introduction: "
Tackling climate change is one of America's greatest economic opportunities." So proclaims the Climate Declaration,
a public statement signed by a fast-growing list of U.S. corporate
giants, including GM, Nike, Intel, Starbucks, Unilever, eBay, Swiss Re,
and even The Weather Channel. This new attempt to encourage companies
to lobby for climate action is gaining steam. President Obama gave the
movement a boost in June when he highlighted the declaration in his big climate speech. More companies are taking a proactive role in climate policy, and for good reasons..."
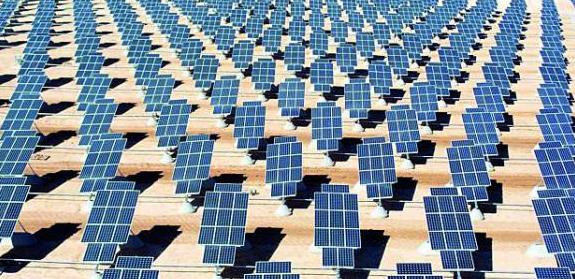
Saudi Arabia Aims To Become The World's Largest Renewable Energy Market.
I had a vaguely out of body experience when I came across this
headline. Saudi Arabia? World's biggest renewable energy market? It
probably makes sense. All that sunshine, and a gradually depleting
natural resource of oil under their feet - The Kingdom probably has the
right idea here, as explained at
arabnews.com: "
Saudi
Arabia aims to become the world’s foremost market for renewable
energy with an aggressive investment budget of $109 billion. By 2032,
the country strives to generate as much as a third of the Kingdom’s
energy demands using renewable energy (54 GW). Following the publicity
surrounding the country’s major investment drive, King Abdullah City
for Atomic and Renewable Energy (KACARE) released a series of
documents detailing the revised National Energy Plan. In addition to
the 41 GW of solar power, 25 GW of CSP and 16 GW of PV, the Kingdom is
aiming to generate 18 GW of nuclear energy, 3 GW of waste to energy, 1
GW of geothermal and an additional 9 GW of wind power, specifically
for water desalination plants..."
Photo credit above: "
By 2032, Saudi Arabia strives to generate as much as a third of the country's energy demands using renewable energy.