An Odd Pattern
As in life, every day is a new (meteorological)
creation. There has never been a weather map precisely like the one
we're faced with today. That's a humbling proposition, and a retort to
people who say "Paul, find a previous day with identical conditions and
just fast-forward to see what will happen!"
[Insert slap on forehead here].
I wish it were that easy.
Our summer pattern has been stranger than
average: the Bermuda High extending as far west as Michigan - weather
systems "retrograding" from east to west at times, helping to prolong
the heat & humidity across much of America.
One silver lining: this sprawling heat-pump
ridge of high pressure has meant less wind shear, allowing fewer
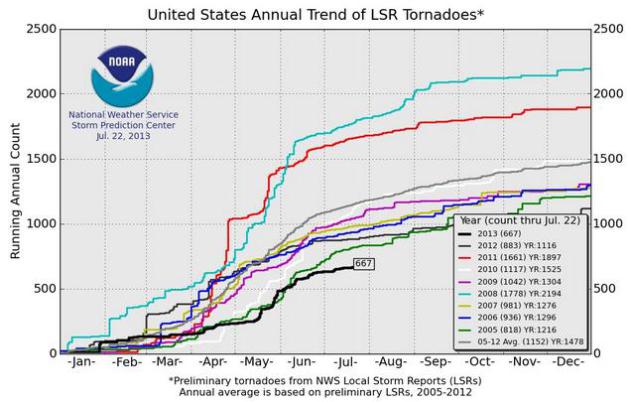
tornadoes to spin up. At last count: 667 tornadoes so far in 2013. That
compares with 1661 twisters as of July 22, 2011.
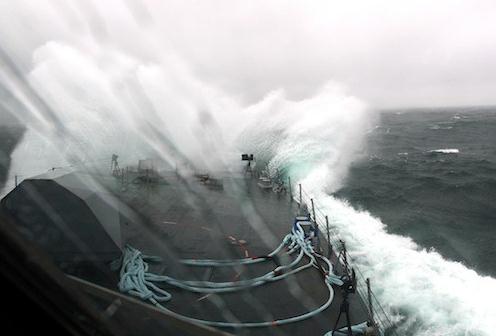
The downside: light steering winds have allowed
T-storms to stall, with more flash flooding, especially southern and
eastern states.
Blue sky lingers much of today, but a vigorous
cool front sparks T-storms Thursday. By Saturday morning you may be
reaching for a sweatshirt; wake-up temperatures in the 40s up north. A
touch of mid-September.
A sunny weekend is shaping up - Sunday the better, milder day for the lake.
Up Is Down And Left Is Right. Back in
Meteorology 1 they taught us that weather systems move from west to east
(the vast majority of the time). We've had an east to west pattern for
much of July, the Bermuda High expanding as far west as Michigan and
Wisconsin. One climate scientist estimated the odds of this happening
for a few weeks in mid-July at .3% In today's edition of
Climate Matters
we examine this odd pattern, track an escalating number of warm
nighttime low temperature records, and take a look at what may soon
become Tropical Storm Dorian in the Atlantic.
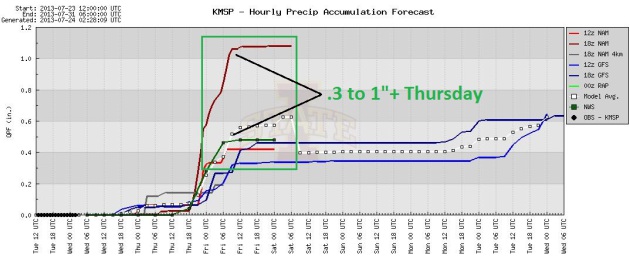
Thursday: Wettest Day In Sight.
All the models are printing out rain for Thursday, but the predicted
amounts vary wildly, from .3" to over 1". With dew points reaching the
mid 60s there may be enough moisture for a few heavy T-storms capable of
some .5" amounts, but not everyone will pick up that much rain. Graph:
Iowa State.
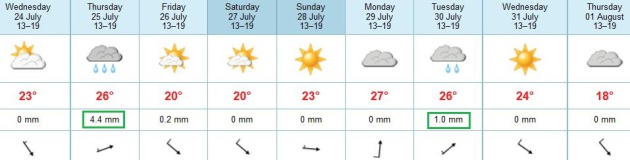
September Flashback. The
calendar says late July, but by Saturday morning it will look and feel
more like late September, wake-up temperatures in the 40s from northern
Minnesota and Wisconsin to the U.P. of Michigan. T-storms linger from
the east coast to the Central Plains, while the west remains dry.
Mid-Summer Break. A vigorous, unusually strong cool
front (for late July) arrives Thursday, followed by a stiff northwest
wind Friday - a risk of light jackets and sweatshirts by Saturday
morning. Sunday looks a bit milder with less wind, a rerun of 80s by
Monday and Tuesday. No, summer isn't even close to being over just yet.
ECMWF forecast highs above in Celsius.
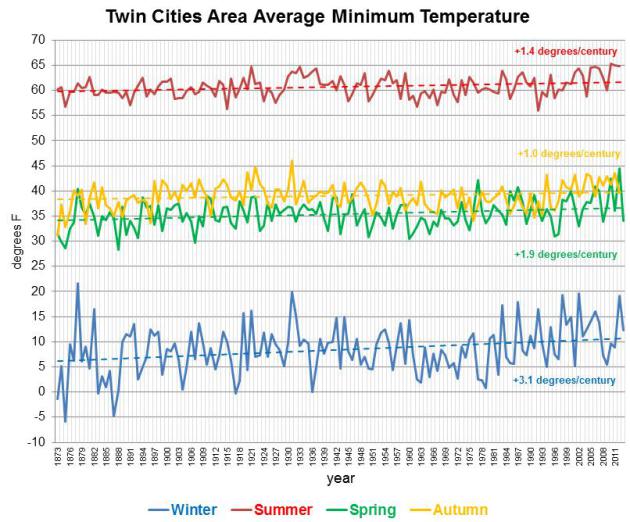
Nights Are Trending Warmer, Especially Winter Months.
Minnesota State Climatologist Greg Spoden passed on the graph (above)
to me, showing the low temperature trends in the Twin Cities since 1873.
As you can see the warming trend is most pronounced during the winter
months, rising at the rate of 3.1 degrees F. per century.
"Drunken" Weather Pattern Leads To Deadly Heat. I've
talked about the odd holding pattern showing up on the maps since late
June, in some cases a "retrograding" east to west pattern setting up
across much of the USA, strange for mid-summer. No, the "Bermuda
High" should not be extending into the Midwest.
Climate Central does a good job of explaining this unusual summer pattern; here's a clip: "
The
heat wave that has built across the eastern U.S. — roasting cities
from Memphis to Washington to Boston in a stifling blanket of heat and
humidity — has had one strange characteristic that meteorologists cannot
yet explain in a long-term climate context. Rather than moving west to
east, as typical weather patterns do in the Northern Hemisphere,
weather systems across the country have moved in the opposite
direction, like a drunken driver on a dark stretch of highway, drifting
from east to west during the past two weeks. And like drunk driving,
the weather pattern is having serious — even deadly — consequences,
with at least one death being blamed on the heat, according to the Associated Press. The "Bermuda high"
that often pumps warm and humid air into the East Coast during July
and August decamped around July 11 from Bermuda and came ashore,
eventually migrating all the way to the Midwest by July 15..."
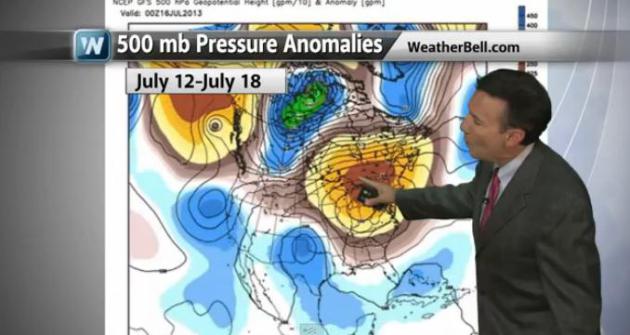
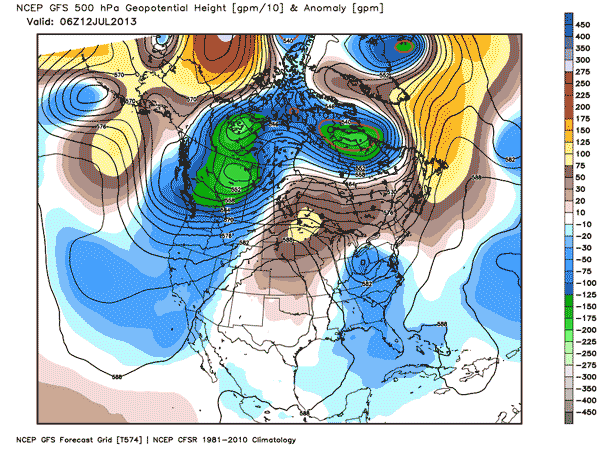
Graphic credit above: "
Animation
of 500 mb pressure anomalies from July 12 to July 18, 2013, showing
the migration of the heat dome from east to west (in orange and red)
and the upper level low toward Texas (blue)." Credit: Ryan Maue for Weatherbell.com.
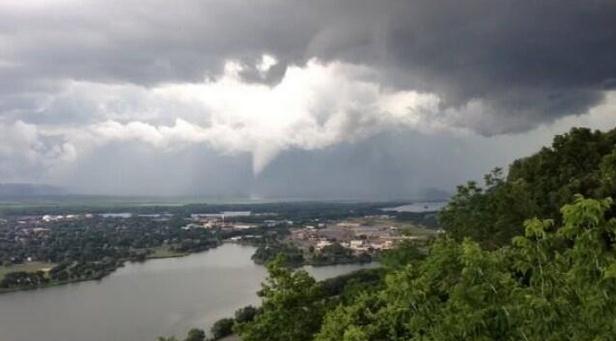
La Crosse Tornado Confirmation. Here's an update from WeatherNation TV: "
According
to the NWS out of La Crosse, WI, the tornado near Winona, MN was
confirmed as an EF0 with winds up to 75mph. There was a swath of tree
damage near Centerville, WI. Here’s more from NWS La Crosse, WI: http://www.crh.noaa.gov/arx/?n=jul2213#photo"
U.S. Tornado Drought. Our odd summer pattern isn't
producing the significant wind shear necessary for a rash of large,
violent tornadoes. Meteorologist Todd Nelson from WNTV has more details
on a very slow year for tornadoes, nationwide: "
No doubt 2013 has
been a very quiet year in terms of tornado count. According to the
Storm Prediction Center, the national PRELIMINARY tornado count is only
at 667 as of July 22nd. Interestingly, this is nearly 500 less than
the 2005-2012 average through July 22nd. It’s also interesting to note
that within that time frame, there hasn’t been as few tornadoes as
there have been this year! The lowest tornado count through July 22nd
during those years was in 2005 when there were 818."
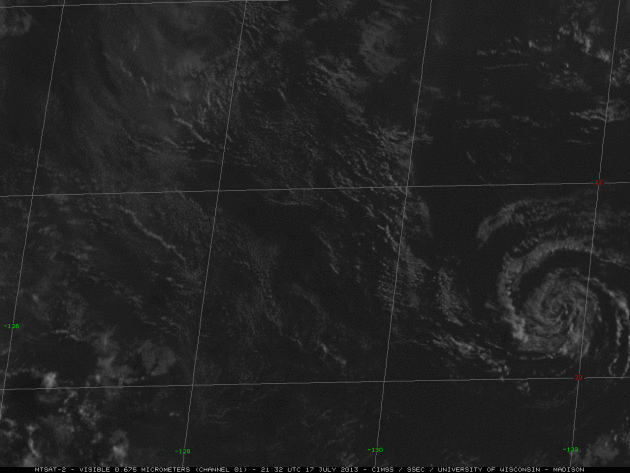
A "Midget" Typhoon. Who Knew?Yes, typhoons come in all shapes and sizes. Just when you think you've seen everything, along comes this blog post at Discover Magazine:"
Because I’m such an unabashed weather geek, I check in most days with the awesome blog
of the Cooperative Institute for Meteorological Satellite Studies.
This morning was no exception, and what I found was a short post about a
possible midget typhoon in the western Pacific Ocean. Who knew that
such a thing existed? At the top of their post today,
CIMSS ran an animation of the possible midget typhoon from Japan’s
MTSAT-2 satellite. Click on the thumbnail at right to see it full size.
With that as a start, I thought I’d try to find it in images captured
by NASA’s Aqua satellite. The animation at top shows what I came up
with. Click on it to see a larger version..."
Image credit above:
CIMSS Satellite Blog.
Drones, Better Model Help Navy Improve Hurricane Intensity Forecasts.
Weather models still aren't perfect (and never will be) but one of the
big challenges in meteorology is better hurricane/typhoon intensity
predictions. Here's an excerpt of a reassuring article from The
Txchnologist and
Avionics Intelligence: "
Forget
Moby Dick’s white whale – a tropical cyclone is by far the most
difficult ocean beast to track. This rotating system of clouds and
thunderstorms, most commonly known to North Americans as a hurricane
once it reaches a certain size and speed, is typically several hundred
miles wide with winds as fast as 155 miles per hour. These vast storms
are essentially a physics puzzle, in which the interaction of moisture,
wind, air, heat and other elements can trick even the most
knowledgeable scientists trying to forecast both the path and intensity
of a hurricane. In the last decade, weather models have gotten much
better at predicting path and landfall, but they have been less
skillful when trying to estimate pressure and maximum wind speeds. So
when the U.S. Navy’s Fleet Numerical Meteorology and Oceanography Center recently launched a new hurricane prediction model capable of tracking a storm’s intensity, it was no small feat..."
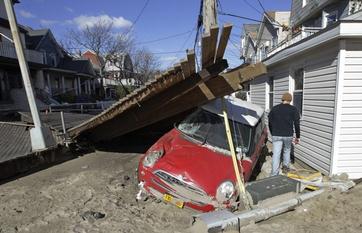
Weather Affects The Bottom Line. No kidding, but this story at
Before It's News does a good job of quantifying some of those weather impacts on business; here's an excerpt: "...
There’s
a steady stream of reports about the cost to business from extreme
weather. The latest came last month from the United Nations. Its GEO-5
for Business study (PDF) UN cited as an example flooding in Australia
in 2010 and 2011 that led to more than $350 million of claims for
reinsuring giant Munich Re and $245 million for mining company Rio
Tinto. True, attributing individual natural disasters to climate change
is a risky business, but rising temperatures, whatever the cause, will
likely lead to continued increases in extreme weather events.
Among the impacted of extreme weather cited by the UN:
- Building and construction companies may find opportunities limited in some areas due to water scarcity
- Chemical companies will face increasing government regulations and consumer pressure to minimize water usage and cut waste.
- The reliability of power grids may be put under pressure by increasing heat waves.
- Food and beverage companies face depleted fish stocks and shifting agricultural zones.
- The loss of plant and animal species will limit discoveries of compounds used in health care.
- Energy-intensive data centers for information and communication companies are vulnerable to rising power prices..."
Photo credit above: Kathy Willens, AP.
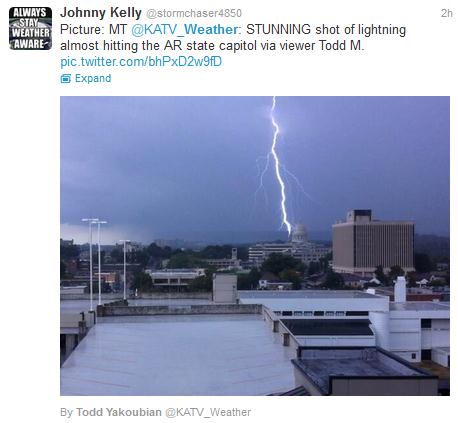
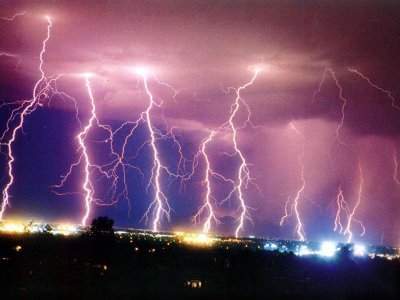
How To Survive A Lightning Strike. Hopefully you're
in a car, home or other building the next time an electrical storm
swirls overhead, but just in case - check out this article from
Discovery News; here's a clip: "
There's
a club open to people from all around the world, but you wouldn't want
to join: The club is exclusively for people who've survived a
lightning strike. Lightning strikes
kill about 24,000 people worldwide each year, and about 240,000 people
are injured by lightning and survive. But even decades after being hit
by lightning, survivors can continue to experience devastating
long-term effects. Because a lightning strike zone can carry thousands
of volts of electricity per square foot, severe nerve damage is common
among survivors, who often report cognitive problems like memory loss,
an inability to concentrate and personality changes..."
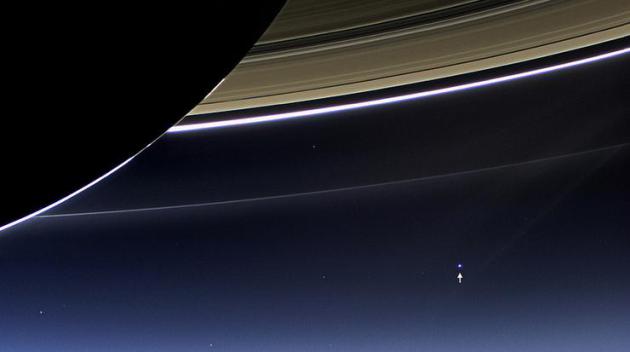
View Of The Earth From Saturn: Pale Blue Dot Reprise.
Earth like you've never seen it before - what our home looks like from
the rings of Saturn, courtesy of NASA and The Washington Post: "
On
July 19, NASA’s Cassini spacecraft captured this inspirational, fragile
view of the Earth – just a faint speck 900 million miles in the
distance – cast beneath Saturn’s imposing rings. “We can’t see
individual continents or people in this portrait of Earth, but this
pale blue dot is a succinct summary of who we were on July 19,” said
NASA’s Linda Spilker, a project scientist for the Cassini mission..."
Photo credit above: Via NASA: “
In this rare image taken on
July 19, 2013, the wide-angle camera on NASA’s Cassini spacecraft has
captured Saturn’s rings and our planet Earth and its moon in the same
frame.”
Thank You For Using The Internet! We Regret To Inform You That Your Free Trial Has Expired. No kidding. Here's a clip from a New York Times article at
Buzzfeed: "...
That
era — let’s call it the internet’s free trial period — is coming to an
end. In the 12 years since courts shut down Napster, the internet has
taken its hatchet to every other branch of the media industry, deftly
pruning ad dollars, jobs, and shaving away bottom lines. Now the
reaction, opposite but never quite equal, and always late, is starting
to take effect. The untamed and lawless expanses of web content are
quickly being replaced by paywalls and monthly fees. And, surprisingly,
we don’t really seem to mind all that much. Most of us don’t even seem
to notice..." (Image credit: Mary Meeker and
slideshare.net).
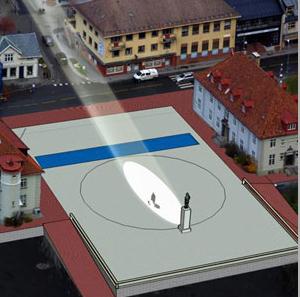
Giant Mirrors To Light Up One Dark Norwegian Town. Now here's a great idea - does Amazon sell giant mirrors?
Popular Mechanics has the story; here's the intro: "
In the midst of five months of darkness this coming winter, the Norwegian town of Rjukan
will have one bright spot: a town square illuminated by sunlight
bounced off giant mirrors placed atop the town's neighboring mountains.
Call it a mood enhancer. Or a tourist attraction. But the mirrors, which
will be carried in via helicopter, will provide an oasis of light in
an otherwise bleak location at the center of the 3500-population town.
Three mirrors with a total surface area of about 538 square feet will
sit at an angle to redirect winter sun down into the town, lighting up
over 2150 square feet of concentrated space in the town square. A
similar idea exists in the Italian village of Viganella, which has used
brushed steel to reflect light since 2006..."
Hang On! I especially liked this photo, tweeted out by The Guardian on Tuesday: "
Because we can: A frog with a tiny leaf umbrella (Photograph: Penkdix Palme/Newsteam) "
“One filled with joy preaches without preaching.” – Mother Teresa
Climate Stories....
If You're Younger Than 28, You've Never Experienced A Month Of Below Average Global Temperature.
Quartz has the details: "
If you were born after February 1985, you’ve never lived through a month of below average global temperatures. According to new data
from the National Oceanic and Atmospheric Administration, in June the
earth’s surface was warmer than the 20th century average for the month
for the 340th time in a row. It was the fifth hottest June since 1918,
NOAA said. (An analysis from NASA says the month was the second hottest since
1880.) An entire generation has grown up during this streak of hot
weather, which Philip Bump, who now writes for the Atlantic Wire, pointed out in
the online environmental magazine Grist last year. The last time the
global average of land and ocean temperatures was below long-term levels
was in February 1985. The United Nations reported earlier in July that
more countries have seen record-breaking temperatures in
the first decade of this century than ever before. This month,
northern Canada, northwestern Russia, southern Japan, the Philippines,
southwestern China, and central-southern Africa all saw unprecedented
temperatures for the month, according to NOAA..."
Photo credit above: "
Sun babies." AP Photo / Boris Grdanoski.
Climate Change Is Making Poison Ivy Bigger And Badder.
Well here's some great news! If you're allergic to poison ivy, as I am,
as most people are, you might want to check out this story from
The Pittsburgh Post-Gazette; here's a clip: "...
Lewis
H. Ziska, a research weed ecologist with the U.S. Department of
Agriculture, said laboratory and field studies show that poison ivy is
advancing with climate change. That trend will continue as carbon
dioxide levels keep rising from the current average level of about 400
parts per million to 560 ppm or higher in the next 30 to 50 years, with
predicted levels reaching 800 ppm by century's end, he said. Already
poison ivy's growth and potency has doubled since the 1960s, and it
could double again once CO2 levels reach the 560 ppm mark, Mr. Ziska
said. As a result, Americans might have to scratch their way into a
climate-altered future..."
Photo credit above: Larry Roberts/Post-Gazette. "
Rick Rowlands points out poison ivy at the Carrie Furnaces site in Braddock."
Climate Change Forecasts Can Predict Crop Failures: New Tool For Farmers.
Interested in knowing, months in advance, how the corn or wheat crop
will fare? New tools are emerging which may give farmers a heads-up, for
better or worse. Here's an excerpt from
Science World Report: "
There
may be a new tool for farmers. Scientists have discovered that climate
data can help predict some crop failures several months before
harvest. This could have huge implications for the future of farming
and could allow for better preparations in the future.
Understanding what causes crop failure is crucial to estimating yield
and, potentially, mitigating losses from bad years. In order to examine
the reliability and timelines of crop failure forecasts, the
researchers created and tested a new crop model. They incorporated
temperature and precipitation forecasts and satellite observations from
1983 to 2006. They then examined how well the data predicted the crop
yield or crop failure that had actually occurred at the end of each
season. In all, the researchers studied four crops--corn, soybeans,
wheat and rice..."
Photo credit above: "
There may be a new tool for farmers.
Scientists have discovered that climate data can help predict some crop
failures several months before harvest. This could have huge
implications for the future of farming and could allow for better
preparations in the future." (Photo : Flickr.com/parker Knight)
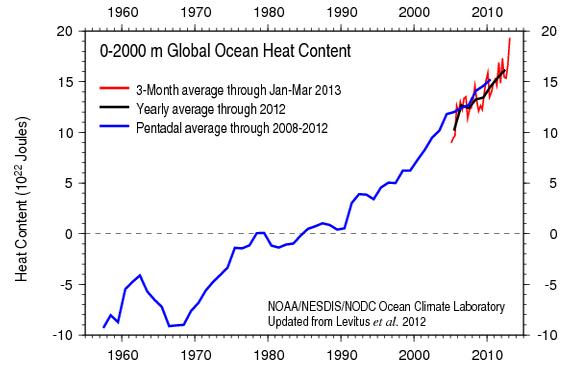
Deep Ocean Heating. This
NOAA chart
shows ocean temperature anomalies since the late 1950s in the top 2,000
meters (a little over a mile) of the world's oceans. A pause in warming
since the late 90s? Maybe the skeptics and professional deniers are
seeing something we aren't?

Oklahoma Scientists, Christians, Urge Congress To Act On Climate Change. Here's an excerpt from
newson6.com: "...
Reed
is an evangelical Christian. He's also a scientist at Oral
Roberts University, a biologist, specializing in insects. He said he's
seen, firsthand, the affects of climate change, as different species of
insects are moving into Oklahoma. "We keep seeing some of the more
tropical or subtropical species that are moving northward," he said.
Reed is one of 200 evangelical Christians, who are also scientists,
to have signed a petition asking Congress to act on climate change. The
letter states, "All of God's Creation...is groaning under the weight of
our uncontrolled use of fossil fuels." It goes on to quote scripture,
"We as a society risk being counted among 'those who destroy the earth'
(Revelation 11:18)..."
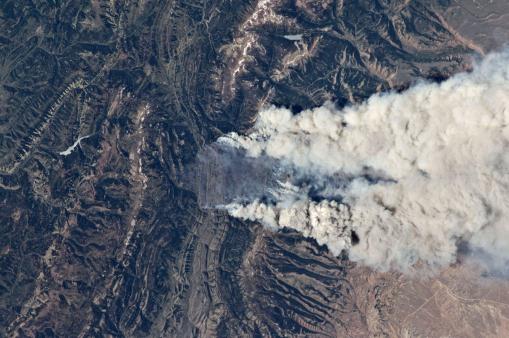
Wildfire Season Getting Longer.
AZcentral.com has the details of a trend that has become all too apparent in the west; here's an excerpt: "...
The
fires that threaten precarious communities are growing more ferocious
in part because of climate change, said Dave Cleaves, climate-change
adviser for the U.S. Forest Service. “We’re seeing more acres burned
and more burned in large fires,” Cleaves said. Warmer summers exacerbate
drought, as do quicker-evaporating winter rains and snowmelt. These
trends increase forest diseases and pests, such as bark beetles, which
have killed millions of acres of trees in the West, creating vast
amounts of fuel to feed fires. “The changing climate is not only
accelerating the intensity of these disturbances,” Cleaves said, “but
linking them more closely together.” On average, the West’s fire season
is now two months longer than it was in the early 1970s, Forest Service
Chief Tom Tidwell said during testimony before a U.S. Senate committee
last month. A 2006 study by University of California-Merced geographer
Anthony Westerling put the increase at 78 days..." (Image above: NASA).
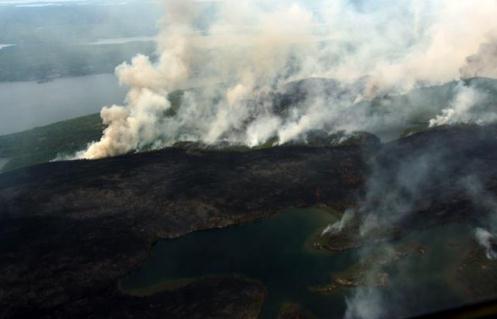
Arctic's Boreal Forests Burning At "Unprecedented" Rate. Meteorologist Andrew Freedman has the story at
Climate Central; here's an excerpt: "
In
a sign of how swiftly and extensively climate change is reshaping the
Arctic environment, a new study has found that the region’s mighty
boreal forests — stands of mighty spruce, fir, and larch trees that
serve as the gateway to the Arctic Circle — have been burning at an
unprecedented rate during the past few decades. The study,
published Monday in the Proceedings of the National Academy of
Sciences, found that the boreal forests have not burned at today’s high
rates for at least the past 10,000 years, and climate change
projections show even more wildfire activity may be to come. The study
links the increase in fire activity to increased temperatures and drier
conditions in the region, which is driving wholescale changes in the
massive forests that encircle the northern portion of the globe..."
Photo credit above: "
A heavy smoke plume from a boreal forest fire." Credit: NASA
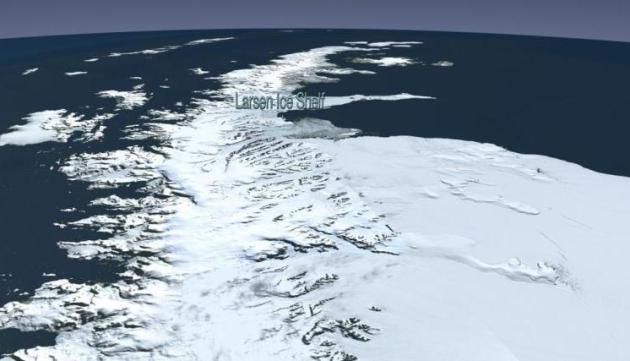
Sea Level Rise: New Iceberg Theory Points To Areas At Risk Of Rapid Disintegration.
Science Daily has the story; here's the intro: "
In
events that could exacerbate sea level rise over the coming decades,
stretches of ice on the coasts of Antarctica and Greenland are at risk
of rapidly cracking apart and falling into the ocean, according to new
iceberg calving simulations from the University of Michigan. "If this
starts to happen and we're right, we might be closer to the higher end
of sea level rise estimates for the next 100 years," said Jeremy
Bassis, assistant professor of atmospheric, oceanic and space sciences
at the U-M College of Engineering, and first author of a paper on the
new model published in the current issue of Nature Geoscience..."
Image credit above: "
The Larsen B ice shelf began
disintegrating around Jan. 31, 2002, and eventually collapsed into the
Weddell Sea. University of Michigan researchers have devised a new
model of iceberg calving that can mirror this event." (Credit: NASA)
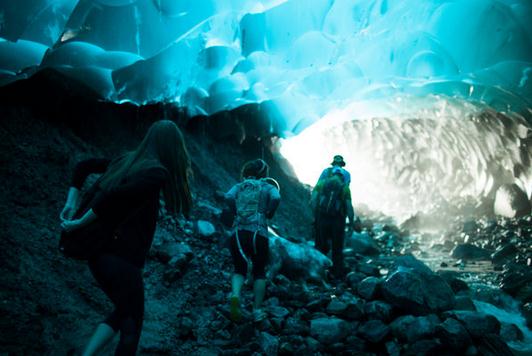
Alaska Looks For Answers In Glacier's Summer Flood Surges.
The New York Times (subscription may be required to read full text) has the story; here's the intro: "
The
idea that glaciers change at a glacial speed is increasingly false.
They are melting and retreating rapidly all over the world. But the
unpredictable flood surges at the Mendenhall Glacier,
about 14 miles from downtown Juneau, Alaska’s capital, are turning a
jog into a sprint as global temperatures and climate variability
increase. Starting in July 2011, and each year since, sudden
torrents of water shooting out from beneath the glacier have become a
new facet of Juneau’s brief, shimmering high summer season. In that
first, and so far biggest, measured flood burst, an estimated 10
billion gallons gushed out in three days, threatening homes and
property along the Mendenhall River that winds through part of the
city. There have been at least two smaller bursts this year..."
Photo credit: Matthew Ryan Williams for The New York Times. "
Visitors
leaving the ice caves under the Mendenhall Glacier, near Juneau,
Alaska. Unpredictable flood surges have elevated concerns."