55 F. predicted high today for the metro area. (55 is the normal high for October 22).
60 F. possible southern suburbs of the Twin Cities between 3 and 4 pm today.
59 F. today's record high at KMSP (1990).
36 F. average high temperature for November 24.

Today will be the 10th 50-degree Thanksgiving Day since 1891. Source: MN State Climate Office.
5 of the 9 days above 50 on Thanksgiving have taken place since 1988.
Odds of a subzero low on Nov. 24 are roughly equivalent to the probability of a 50+ F. high in the Twin Cities.

9 hours, 16 minutes of daylight today.
15 hours, 37 minutes of daylight on June 21, the Summer Solstice.
6 hours, 21 minutes less daylight today than on June 21.
January 17: today the sun will be as high in the southern sky as it will be on January 17. In spite of that, highs should reach the mid 50s.
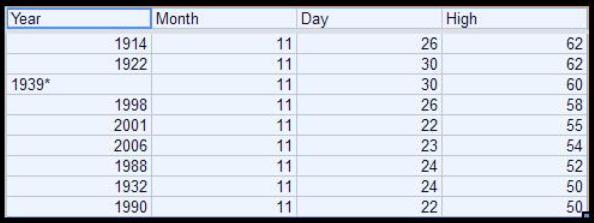
50-degree highs on Thanksgiving Day. Data courtesy of the MN State Climate Office:
"The release of stolen e-mail correspondence from climate scientists won't have the same impact it had the firest time around, in 2009. The science is robust." - U. of St. Thomas professor John Abraham in an Op-Ed at The Daily Climate.

Thanksgiving Climatology. Here is a good summary of average weather on Thanksgiving Day in the Twin Cities from the MN State Climate Office, including the probability of 1" snow, subzero weather, and 50-degree warmth (which is more rare than you might think): "Because Thanksgiving Day occurs at the transition period between autumn and winter, Thanksgiving weather can be balmy to brutal. A typical Thanksgiving Day in the Twin Cities has high temperatures in the 30's and at least a bit of filtered sunshine.
Having a mild day in the 50's on Thanksgiving Day is relatively rare, looking at the historical record back to 1891. A maximum of 50 or more has happened only nine times in 115 years, or about once every 13 years or so. The warmest Thanksgiving Day is a tie of 62 degrees set in 1914 and 1922. The mildest recent Thanksgiving Day is 58 degrees on November 26, 1998.
On the other side of the spectrum, it is common to have a high temperature below 32. The average Thanksgiving Day temperature is right around freezing. What about extremely cold Thanksgivings? It is about as likely to have a minimum at or below zero on Thanksgiving Day, as it is to have a maximum of 50 or above. It has occurred eight times in the past 115 years. The coldest Thanksgiving Day temperature is eight degrees below zero. This has happened three times, 1893, 1905 and 1985.
Measurable snow fell on 25 of the past Thanksgivings back to 1891, about every five years or so. The most snow that fell on Thanksgiving was five inches in 1970.
Historically, about one in three Thanksgivings have at least one inch of snow on the ground. The deepest snow pack is a tie with 1921 and 1983, both with 10 inches on the ground by Turkey Day.
It occasionally rains on Thanksgiving Day as well. In 1896, a two-day event in the Twin Cities doused Thanksgiving travelers with nearly three inches of rain.
* image above courtesy of timeanddate.com.
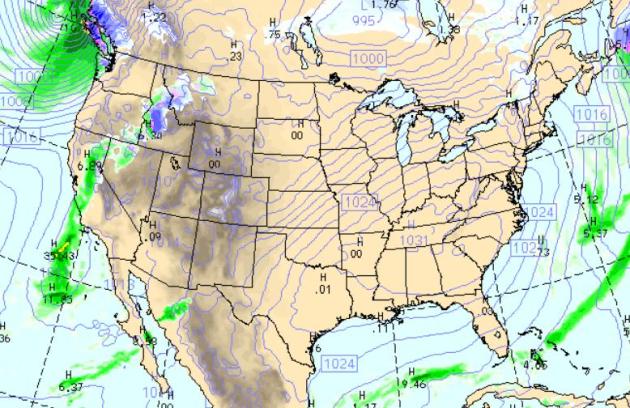
Remarkably Quiet Thanksgiving Day. A sprawling bubble of high pressure over Atlanta will keep the eastern 2/3rds of America dry and unusually mild today, temperatures across the Plains 20-30 degrees above average. A cool breeze lingers for New England, rain forecast for the central valley of California and the Pacific Northwest by evening. The only snow: from near Missoula, Montana to Boise, Idaho. WRF model map above valid noon, courtesy of NOAA NCEP.
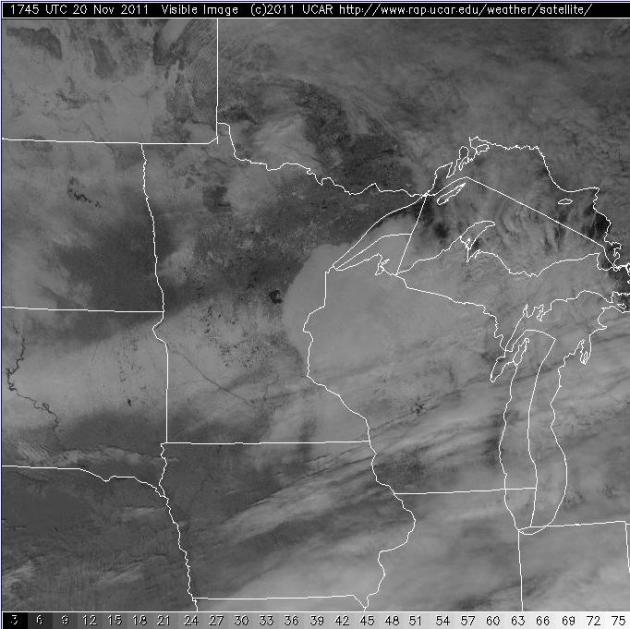
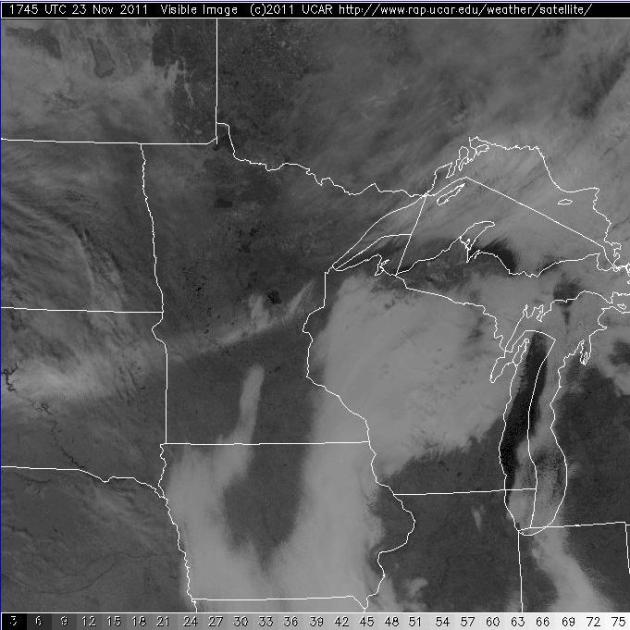
Rapid Snow Melt: Sunday Vis Image Wednesday Vis Image
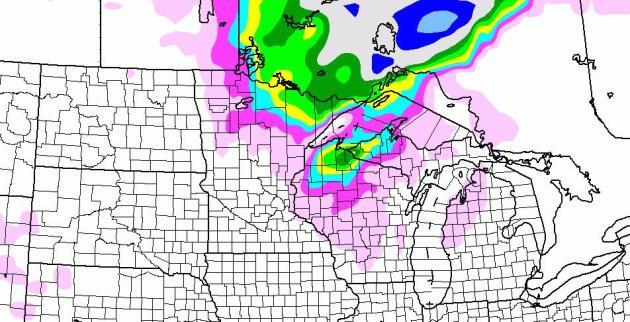
Saturday Slush (Up North). Models are contradictory (nothing new), but there's a chance of rain showers mixing with and changing over to a period of wet snow, especially north of Duluth and Bemidji, a few inches possible over far northern Wisconsin by Saturday night. Right now I don't expect any accumulation in or near the MSP metro area, temperatures falling through the low 40s into the 30s on Saturday.
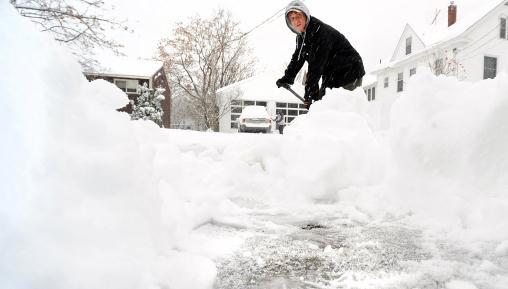
The Big Dump. Close to a foot of snow fell on Auburn, Maine early Wednesday, the same storm that produced "plowable" snowfall amounts from upstate New York to Vermont, New Hampshire and much of Maine. AP Photo/Lewiston Sun Journal, Russ Dillingham.
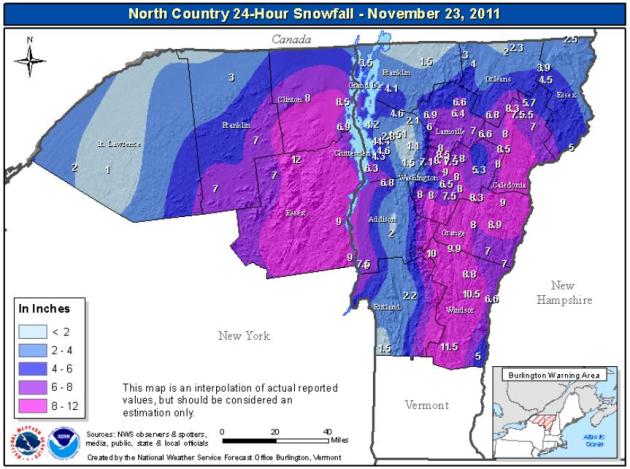
Digging Out. Much of upstate New York, Vermont, New Hampshire and Maine is digging out from 6-12" snow. More from the National Weather Service here - detailed amounts below:

Early Snow Reports
Maine
· Durham 7.7 inches
· Gray 5.8 inches
Massachusetts
· Shelburne 2.5 inches
· Bernardston 1.5 inches
New Hampshire
· Haverhill 10 inches
· Springfield 9 inches
· Walpole 7.4 inches
· Northfield 7 inches
· Pinkham Notch 6 inches
· Keene 4.0 inches
· Concord 2.7 inches
New York
· Moriah 9.0 inches
· Plattsburgh 8.5 inches
· Saratoga Springs 5.0 inches
· Rotterdam 2.0 inches
Vermont
· Topsham 9.0 inches
· Orwell 8.0 inches
· Woodford 7.0 inches
· Gilman 5.0 inches
· Montpelier 3.0 inches
· Swanton 3.5 inches
Record Rainfall Nov. 22
Hoquiam, WA 2.68"
Portland, OR 2.35"
Harrisburg, PA 1.8"
Seattle 1.76"
Philadelphia 1.66"
Hot Springs, AR 0.95"
Record Highs Nov. 22
Harlingen, TX 91
Alma, GA 83
Augusta, GA 82
Pensacola, FL 81
Montgomery, AL 81 (tie)
Wilmington, NC 80
Florence, SC 80
Athens, GA 79 (tie)
Apalachicola, FL 79 (tie)
Greenville, SC 77
Raleigh, NC 77 (tie)
Charlotte, NC 76
Portland, OR 59 (tie)
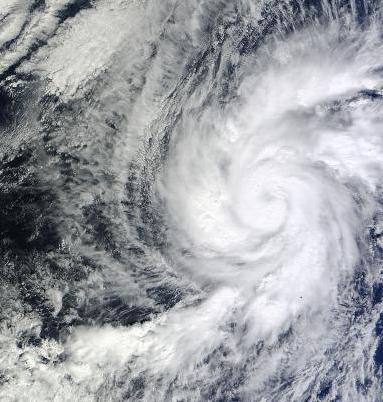
Hurricane Kenneth Becomes Late-Season Record-Breaking Major Hurricane. Kenneth has weakened dramatically since Tuesday, when it was an extreme, Category 4 storm, packing 145 mph sustained winds, the strongest ever observed so late in the season in the eastern Pacific. Science Codex has the story: "NASA satellites have been watching hurricane Kenneth in the eastern Pacific, and today, Nov, 22, Kenneth became a late-season major hurricane. In fact, Kenneth sets a record for the latest season major hurricane in the eastern Pacific Ocean. A major hurricane is one that reaches category three status or greater on the Saffir-Simpson scale that measures hurricane strength. At 10 a.m. EST, Kenneth's maximum sustained winds were near 145 mph (230 kmh)! Kenneth's center was far away from land areas and about 750 miles (1210 km) south-southwest of the southern tip of Baja California, Mexico. That puts Kenneth's center near 12.7 North and 113.9 West. Kenneth was moving to the west near 13 mph (20 kmh) and had a minimum central pressure of 943 millibars."


Climate Stories...

Opinion: We Are Smarter This Time Around. Minnesota associate professor of Thermal Science at the College of St. Thomas and noted climate scientist John Abraham takes a look at the latest batch of leaked e-mails in this Op-Ed in The Daily Climate: "When news broke earlier this week that another cache of emails had been released purporting to show that climate scientists had "cooked the books," parties around the world looked carefully, this time with a doubtful eye. They had a right to doubt. Two years ago, almost to the day, similar emails had been released just before the United Nations' climate change conference in Copenhagen – the last best hope to take meaningful action to halt the warming climate. The original 2009 release caught the world by storm and created an uproar that successfully put climate science on the defensive for nearly two years. Whoever is behind the release of these stolen emails was clearly hoping the same play would work again. It won't. A few things are different this time around. Most importantly, many journalists now realize they were played the fools. They were told that these emails showed scientists "hiding declines in temperature" and conspiring against others. These same media outlets had a lot of work cleaning egg off their face when it became clear that the correspondence said nothing of the sort. In a "fool me once, shame on you; fool me twice, shame on me" manner, the media is largely ignoring these new emails, or they are reporting the real story: The emails are taken out of context, the science is robust and has been upheld by every investigation of the 2009 release, and that climate change is already underway."

How Will The Media Handle "Climategate", Version 2.0? Don Shelby takes a look at Minnpost.com: "Apparently, the original hackers of the 2009 emails have dumped another 5,000 on the public. (A searchable database of the stolen emails can be found here.) These emails seem to have been taken in the original theft and held back for some reason. (None of the new emails are more recent than 2009.) I think I have an inkling of what that reason may be. The first stolen emails were made public on the eve of the Copenhagen summit on climate science. It seemed purposeful. This email dump comes on the eve of the global climate conference in Durban, South Africa. Coincidence? Its purpose, I am assuming, is to derail the conference and any agreements that might be made to curb CO2 emissions. Copenhagen wasn't a complete failure, but there weren't many successes, and the hackers might have popped the vodka in celebration."
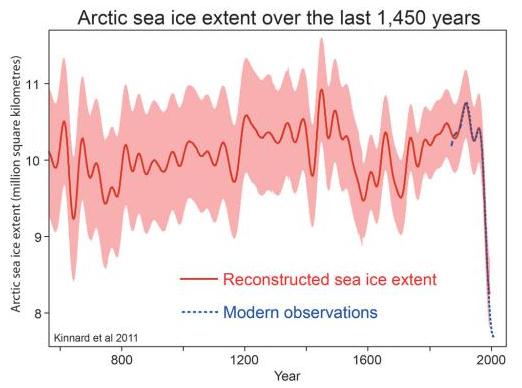
More "Cliff" Than "Hockey Stick". Reconstructed Changes In Arctic Sea Ice Over the Past 1,450 Years. Nature Magazine has the story: "Arctic sea ice extent is now more than two million square kilometres less than it was in the late twentieth century, with important consequences for the climate, the ocean and traditional lifestyles in the Arctic Although observations show a more or less continuous decline for the past four or five decades, there are few long-term records with which to assess natural sea ice variability. Until now, the question of whether or not current trends are potentially anomalous has therefore remained unanswerable. Here we use a network of high-resolution terrestrial proxies from the circum-Arctic region to reconstruct past extents of summer sea ice, and show that—although extensive uncertainties remain, especially before the sixteenth century—both the duration and magnitude of the current decline in sea ice seem to be unprecedented for the past 1,450 years."
* graphic above courtesy of Skeptical Science.