A Spoon-fed Career
I flew east this weekend to celebrate my dad's
83rd birthday. He's largely responsible for my deep dive into
meteorology. Between a tropical storm (Agnes) and weather merit badge in
the Boy Scouts I was curious about weather. Dad knew this - and had a
stack of newspaper & magazine clippings ready for me at the
breakfast table every morning. Now he's graduated to sending e-mail
links to stories on his iPad. His daily clipping service continues
(without the morning bowl of Wheaties).
His secret? Two brisk walks a day, salads for
lunch and tracking (and lowering) his cholesterol. That, and a warped
sense of humor. May I be so lucky.
If you thought summer was winding down you're in
for a rude surprise. Comfortable 80s will give way to a streak of 90s
from Wednesday into next weekend. ECMWF guidance hints at mid-90s with
dew points ranging from 60-70F.
Stinking hot.
An isolated T-shower may pop over northern
Minnesota Monday, another swarm of storms Thursday could pass north of
MSP. Portions of Minnesota are drying out again, and although I don't
expect a rerun of the 2012 drought a few pockets of moderate drought may
return by September.
I'm looking forward to sweating out the State Fair next Saturday - spending most of my time at the deodorant-on-a-stick booth.
Shift In The Pattern. The (amazingly) persistent
kink in the jet stream that has funneled a parade of Canadian cool
fronts south of the border, sparking frost over the Minnesota Arrowhead
and 30s over interior New England in recent days will become more
progressive, blowing west to east, allowing a heat bubble to expand
eastward into the Plains and Midwest by midweek. Animation:
WeatherNation TV.
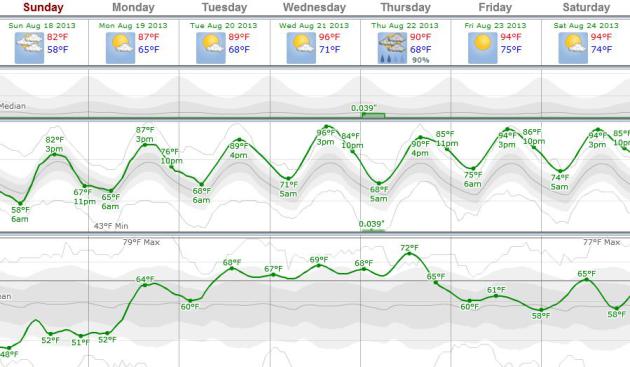
One Hot Week. ECMWF data (above, courtesy of
WeatherSpark)
shows highs near 90 by Tuesday, then well into the 90s Wednesday, again
late in the week. Today will be the last day of comfortable dew points
(rising thru the 50s). Bu Thursday the dew point may exceed 70, fueling a
few T-storms - especially north of the Twin Cities. Humidity levels
drop off a bit late in the week, but 90s may spill over into next
weekend.
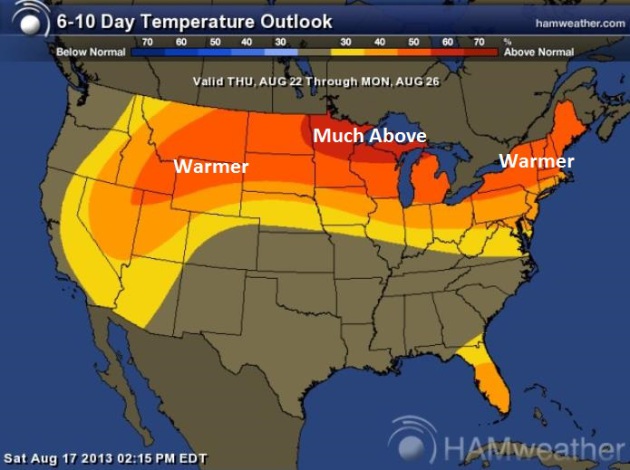
Summer Swoon. We're not done with the Dog Days, not
even close. The map above shows predicted temperature anomalies from
Thursday into Monday of next week; readings as much as 10-20 F. above
average over northern Minnesota and Wisconsin. Graphic: NOAA CPC and Ham
Weather.
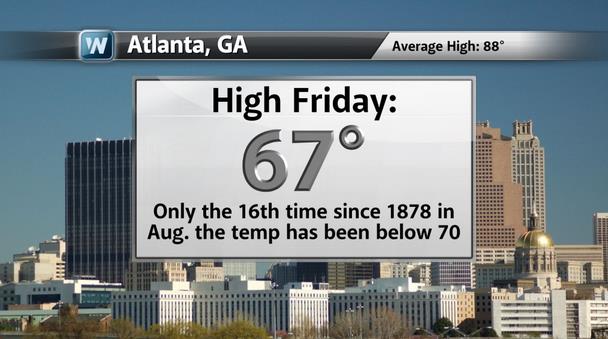
"
Augtober". Folks living in "Hotlanta" have to be
scratching their collective heads right about now. Friday's high of 67
F. was only the 16th time the high temperature on a given day has been
cooler than 70 F. Talk about a mixed-up weather map. Graphic:
WeatherNation TV.
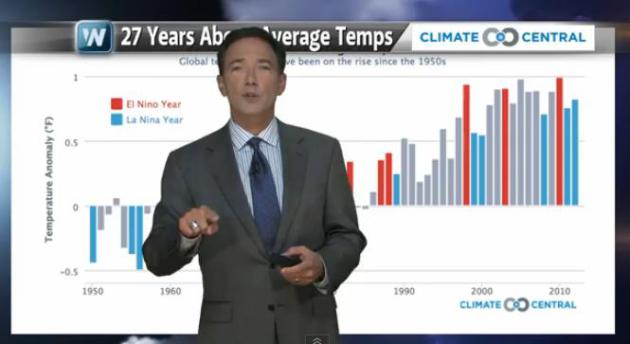
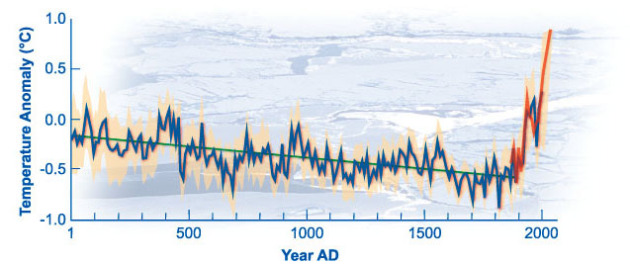
Weather Vs. Climate: Keeping The Big (Global) Picture.
With cooler than average temperatures the last 3-4 weeks over the
northern tier of the USA it's tempting to dismiss climate change and
global warming, but this misses the distinction between weather and
climate. A Canadian breeze has been blowing from Minneapolis to Chicago,
D.C. and Boston since late July, but stepping back and looking at the
larger picture the trends are undeniable. Here is today's edition of
Climate Matters: "
Last
summer, much of the U.S. was baking in sweltering heat. This year, a
different story for the Eastern Half of the U.S. The dog days of summer
are missing in action. Wait until you see the comparison of 90 degree
days this year compared to last year and compared to average. What
kind of summer weather do you prefer? Do you like it hot, or are you
happy when it's cooler than average?"
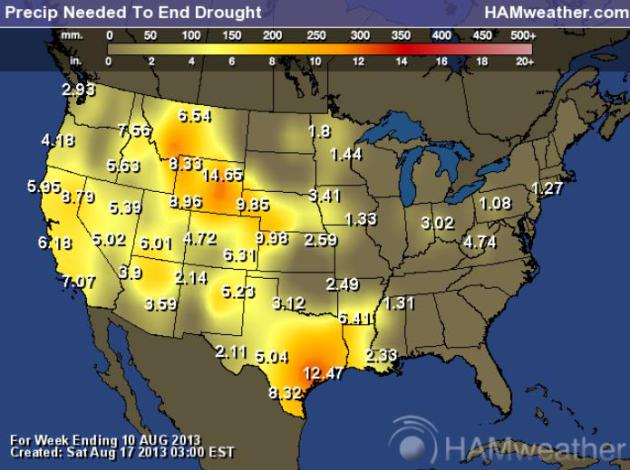
Moisture Needed To Ease Drought. We're running about
a 1 to 1.5" rainfall deficit across much of Minnesota - we can make up
for that with one good frontal passage and T-storm outbreak (which may
happen Thursday). The situation is much worse out west, a nearly 10"
rainfall deficit for western Nebraska and Wyoming - the drought
continues to worsen over the western third of the USA. Map: NOAA and Ham
Weather.
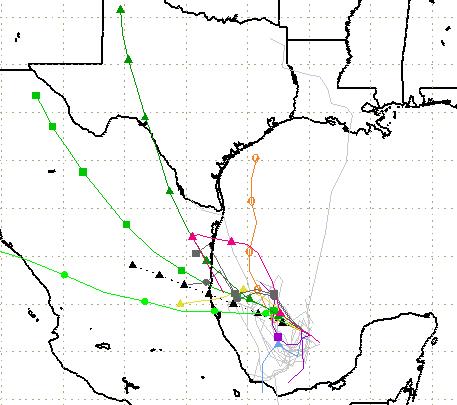 Gulf Coast Fizzle
.
The tropical depression that tracked over Mexico's Yucatan Peninsula
can't seem to get it's act together (too much dry air and wind shear)
and will probably drift back into mainland Mexico as a weak tropical
wave. The risk to south Texas has dropped considerably; NHC says only a
10% risk of tropical storm formation in the next 48 hours.
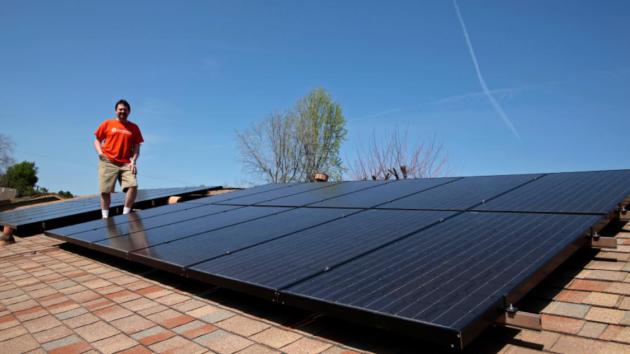
Why U.S. Power Companies Don't Want You Putting A Solar Panel On Your Roof.
Quartz.com (great site) has the story; here's the intro: "
The short answer: It will destroy their business model forever. In
the US, electrical utilities are in a charged battle—complete with
negative political ads—against solar panel distributors over rules that
both sides say could put them out of business. Consumers are caught in
the middle. A relatively new swathe
of companies like Verengo, Sunrun, Sungevity and SolarCity have spent
millions leasing solar equipment to homeowners and businesses. The
cost of the lease is offset by savings on their electrical bill. Those
savings come not just because of free power from the sun, but also
through tax credits—and, most importantly today, because states allow
those who have solar panels to sell any excess power back to the grid.
The more than 200,000 “distributed solar generators” in the US
produce less than 1% of the country’s electricity. But that’s growing
thanks to the falling cost of photovoltaics and financing from investors like Google.
And this worries the big power companies, particularly country’s two
largest, Pacific Gas & Electric and Southern California Edison..."
Photo credit above: "A sunshine warrior." Reuters/Lucy Nicholson
40 Maps That Explain The World. I thought this was interesting and visual, one of 40 maps that put global trends into perspective, courtesy of
The Washington Post. Here's an excerpt: "
Maps
can be a remarkably powerful tool for understanding the world and how
it works, but they show only what you ask them to. So when we saw a
post sweeping the Web titled “40 maps they didn’t teach you in school,”
one of which happens to be a WorldViews original, I thought we might
be able to contribute our own collection. Some of these are pretty
nerdy, but I think they’re no less fascinating and easily
understandable. A majority are original to this blog (see our full maps coverage here), with others from a variety of sources. I’ve included a link for further reading on close to every one..."
Graphic credit above: "
This NASA moving image, recorded by satellite over a full year as part of their Blue Marble Project,
shows the ebb and flow of the seasons and vegetation. Both are
absolutely crucial factors in every facet of human existence — so
crucial we barely even think about them. It’s also a reminder that the
Earth is, for all its political and social and religious divisions,
still unified by the natural phenomena that make everything else
possible."
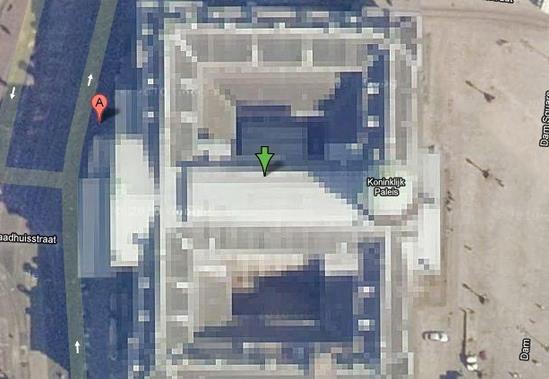
10 Places You're Not Allowed To See On Google Maps. I found this vaguely interesting, courtesy of
mashable.com: "
Want an up close view of the Eiffel Tower but can't make it to Paris anytime soon? Google Maps
is optimal for virtual sightseeing. But not every landmark is visible
on the site — some images are blurred and distorted by countries for
security reasons. This means that if you want to see towns or streets
in North Korea, you can't. Also blurred is the Royal Palace in the
Netherlands and even a power plant on Cornell University's campus in
Ithaca, New York. "The satellite and aerial imagery in Google Earth and
Google Maps is sourced from a wide range of both commercial and public
sources," Google spokesperson Deanna Yick tells Mashable. "These
third-party providers are required to follow the law of the countries
in which they operate, so some of them may blur images and then supply
us with those images..."
Image credit above: "
The Royal Palace of Amsterdam in the
Netherlands -- called Koninklijk Paleis Amsterdam -- joins a long list
of places blurred on Google Maps related to the Dutch royal family,
including the Royal Stables and another residence called Huis ten Bosch."
How Your Birth Order Can Influence Who You Are. Here's an excerpt of a fascinating story at
io9.com: "
As
many parents can attest, siblings tend to be more different than
alike. Some of this may be the result of our birth order, and how we’re
subsequently raised. What’s more, birth order may influence our
health and sexuality too. Here’s what you need to know about how your
birth rank affects your life. Birth order is an incredibly difficult
area to study, and as such, is considered highly controversial. There
are so many factors to consider outside of a person’s familial rank by
age, including the spacing in years between children, the total
number of children in a family, socioeconomic status, the sex of
siblings, and environmental circumstances during upbringing. It’s not
easy to isolate traits that are dependent on birth order..."
Where To Find Free Wi-Fi At U.S. And International Airports. Here's some useful information for business and leisure travelers courtesy of
Mashable: "
For frequent fliers, nothing is more blissful than an airport with free Wi-Fi. But not every stopover location is so generous. Airfarewatchdog
assembled two handy charts that detail everything you need to know
about wireless connections at major airports in the United States and
worldwide, from airports with free Wi-Fi to those with the most
expensive Wi-Fi and usage limitations..."
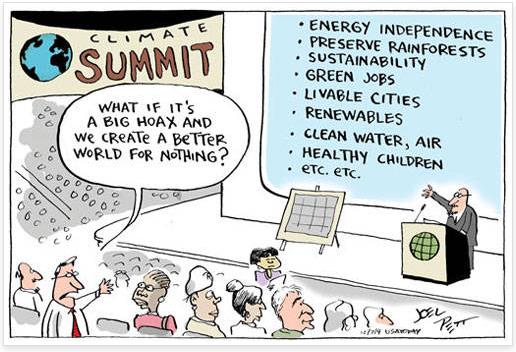
Climate Stories...
Cartoon by Joel Pett, Cartoon ArtsInternational.
Climate Change: Forecast For 2100 Is Floods And Heat, And It's Man's Fault. Here's a clip from a story at
The Telegraph: "The
UN Intergovernmental Panel on Climate Change also said there was a 95
per cent likelihood that global warming is caused by human
activities. That was the highest assessment so far from the IPCC,
which put the figure at 90 per cent in a previous report in 2007, 66
per cent in 2001, and just over 50 per cent in 1995. Reto Knutti, a
professor at the Swiss Federal Institute of Technology in Zurich,
said: “We have got quite a bit more certain that climate change is
largely man-made. We’re less certain than many would hope about the
local impacts.” The IPCC report, the first of three in 2013 and 2014,
will face intense scrutiny particularly after errors in the 2007
study, which wrongly predicted that all Himalayan glaciers could melt
by 2035..."
Photo credit above: "
Almost 200 governments have agreed to try to limit global warming to below 3.6F (2C) above pre-industrial times." Photo: ASHLEY COOPERS/ALAMY.
Expert: Climate Change Demands Behavioral Change. Here's an excerpt from a story at
The Baptist Standard: "...
Christians,
in particular, should recognize climate change most directly affects
people who are least able to adapt, said Hayhoe, founder and chief
executive officer of ATMOS Research. “We are told (in the Bible) to love
our neighbors as ourselves,” she said, adding love demands each
Christian act as a good steward of creation. When she examines research
on climate change, Hayhoe explained, she likes to think of the data as
God’s voice to his people.
Earth has 'low-grade fever'
“God’s creation is telling us it’s running a fever—a low-grade
fever,” she said. People traditionally view weather patterns like a
driver whose eyes are fixed on the rearview mirror, without considering
changing conditions, she said. The climatological history of the High
Plains demonstrates cyclical change between hot and cold, wet and dry..."
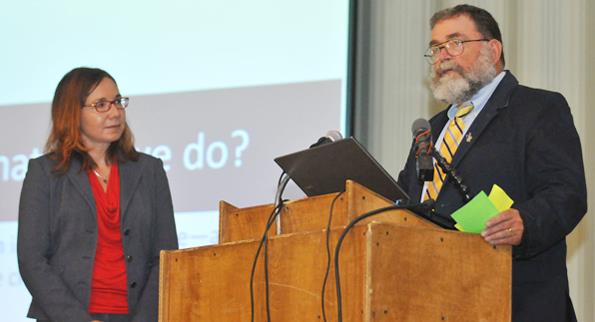
Photo credit above: "
Herb Grover, dean of the School of
Mathematics and Sciences at Wayland Baptist University, moderates a
forum on the Plainview campus featuring Katharine Hayhoe, director of
the Climate Science Center at Texas Tech University." (PHOTO/Wayland Baptist University)
As Northeast Asia Bakes, Climate Scientists Predict More Extreme Heat Waves On The Horizon. We're seeing more of these sudden (and prolonged) heat spikes, 2 to 4 standard deviation extremes, as explained by
Time Magazine; here's a clip: "
Northeast Asia is on fire. Yesterday temperatures in Shanghai hit an all-time high
of 105.4ºF (40.8ºC), the hottest day in the coastal megacity since
Chinese officials began keeping records some 140 years ago — during the
Qing dynasty. On Aug. 12 the heat reached 105.8ºF (41ºC) in the southern Japanese city of Shimanto,
the hottest temperature ever recorded in the country. Hundreds of
people throughout South Korea have been hospitalized because of
heatstroke, even as the government was forced to cut off
air-conditioning in public buildings because of fears of a power shortage. As heat waves go, it’s a tsunami, similar to the brutally hot weather that singed Europe 10 years ago, which contributed to the deaths of over 30,000 people. It’s also a glimpse of a blazingly hot future..."
Photo credit above: "
Men take a rest by an exhaust outlet
of a building during a hot summer day in Beijing, China Wednesday, Aug.
14, 2013. Heat wave hit several cities, mostly in the south and east
of China as temperature went up above 40 degrees C (104 F) in some
parts." (AP Photo/Andy Wong)
Climate Change Is Scary, But I'm Not Scared. No, the situation is far from hopeless, as the author of this Op-Ed at
Living Green Magazine points out - here's an excerpt: "...
So,
why am I not scared? Why did I decide to have a baby in the face of
this knowledge? Because there are hopeful trends. Technology can be
implemented very quickly, and views can change equally quickly. The
impossible can quickly become inevitable. A recent poll showed that
young people think that climate change deniers are “ignorant” “out of
touch” and “crazy”[8]. They also don’t care much for cars, and prefer modes of transportation that allow them to text at the same time[9].
They think electric cars and solar panels are cool. And it’s not just
our kids’ attitudes that give me hope. The technological solutions
are here. The price of solar panels has come down 80% since 2008[10].
Imagine if a shirt at the Gap was marked as 75% off—a few more shirts
would sell, and indeed, as you’d expect, solar panels are flying off
the racks..."
Climate Policy's Twin Challenges. Here's a portion of a story posted at
The Los Angeles Times: "
Climate
change presents two distinct problems. The first is linear: A little
more warming causes a little more damage. The second is nonlinear: A
little more warming pushes some part of the climate system past a
tipping point and the damage becomes catastrophic. We need smart climate
policies that address both problems, so we can slow incremental
damage while also taking out an insurance policy against the growing
risk of catastrophic damage. The Arctic is a prime example of a
potential tipping point. It is already warming at twice the global
rate, with Arctic sea ice disappearing faster than previously
predicted. Some scientists calculate that it could disappear for all
practical purposes later this decade..."
Solar Panels Return To White House.
The Hill has an update; here's the introduction: "
The White House is making good on a late 2010 pledge
to put up solar panels. “The White House has begun installing
American-made solar panels on the first family’s residence as a part of
an energy retrofit that will improve the overall energy efficiency of
the building,” a White House official said. The installation drew
cheers from an environmental group that in 2010 called for panels to
return to the White House after the Reagan administration removed a
Carter-era solar panel installation..."
File photo above: "
Pres. Jimmy Carter speaks against a
backdrop of solar panels at the White House, Wednesday, June 21, 1979,
Washington, D.C. The panels catch the suns rays and warm water used in
parts of the Executive mansion." (AP Photo/Harvey Georges)
Would Things Be Different If The Public Had Perfect Information On Climate Science And Solutions? Here's a portion of a Joe Romm post at
Think Progress: "
Last week, I wrote about the important Dunlap-McRight paper that found organized climate change denial “Played a Crucial Role in Blocking Domestic Legislation.” Although this is a pretty obvious conclusion to objective observers, the false-equivalence bunch, led by blogger Andy Revkin,
couldn’t bring themselves to report on it without giving the
professional disinformers equal time. John Rennie, the former editor in
chief of Scientific American, slammed Revkin’s piece in a must-read
post, “Revkin’s False Equivalence on Climate Message Machines.”
Rennie was particularly critical of Revkin’s equating the climate
denial machine with a laughable “climate alarmism machine” (whipped up
by an Australian disinformer), which equates those who spread outright
anti-scientific disinformation (often funded by fossil-fuel interests)
with the serious work of climate scientists and governments (and
others) who make use of that genuine, scientific work..."
Brave New World: Americans Are Learning To Live With Climate Change. Because when you get right down to it - we won't have much choice. The forecast calls for adaptation. Here's an excerpt from
Grist: "
The
Great American Road Trip — it’s a rite of passage, a national
pastime, and increasingly, a tool for spreading the word about looming
climate catastrophe. Each summer, a motley parade of veggie buses, vintage motorcycles, and bicycles
circulates around the country, its participants out to preach the
gospel of green living, and perhaps learn a thing or two in the process.
Two of these eco-minded road trippers, Kirsten Howard and Allie
Goldstein, recently dropped by the Grist offices in Seattle to tell us
about their adventures aboard a 2000 Toyota Sienna minivan. The duo,
who recently graduated from the University of Michigan’s School of
Natural Resources and Environment, called their adventure the Great
American Adaptation Road Trip..."
How "Skeptics" View Arctic Sea Ice Decline. Here's an excerpt from
Skeptical Science: "
September Arctic sea ice extent data
since 1980 from the National Snow and Ice Data Center (blue
diamonds). "Recovery" years, meaning years when the sea ice extent is
greater than the previous year, are highlighted in red to mock the
repeated cynical claims of climate change "skeptics" that global
warming has somehow stopped. Many factors affect the annual summer
decrease in Arctic sea ice extent, and it is illogical at best to claim
any "trend" by cherry-picking
only brief periods of data. The obvious true long-term trend in
Arctic sea ice extent (red second-order polynomial curve fit) is that
it is declining at an accelerating rate..."
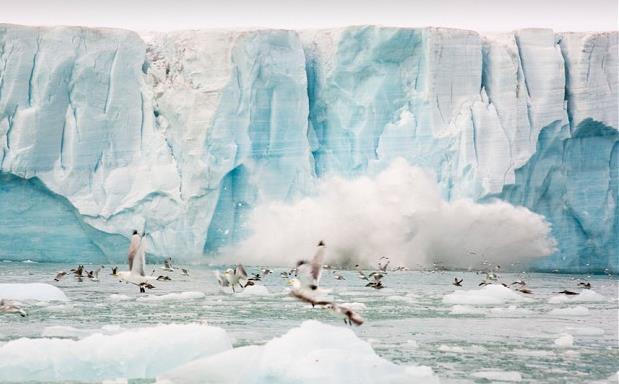
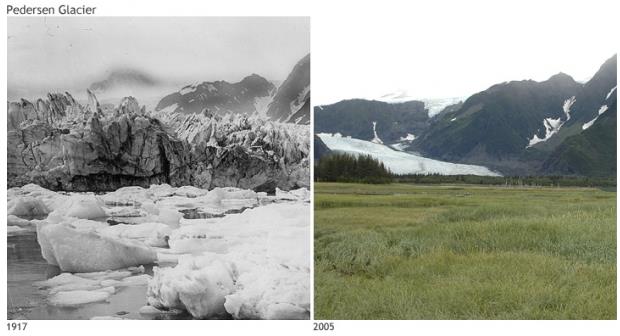
2012 State Of The Climate: Glaciers. Here's the introduction to a story at NOAA's
Climate.gov focused on glacier retreat around the world: "
Around
the globe, some 370 million people live in basins where rivers
derive at least 10 percent of their seasonal discharge from glacier
melt. Glacier melt provides drinking water for human populations, and
irrigation water for crops. The damming of glacial melt water even
generates hydroelectric power. The retreat of the majority of mountain
glaciers worldwide is one of the clearest signs of long-term climate
change....Between
1980 and 2011, glaciers around the world lost the water equivalent
of 15.7 meters. That would be like slicing a roughly 17-meter-thick
slab off the top of the average glacier and repeating that exercise
worldwide."
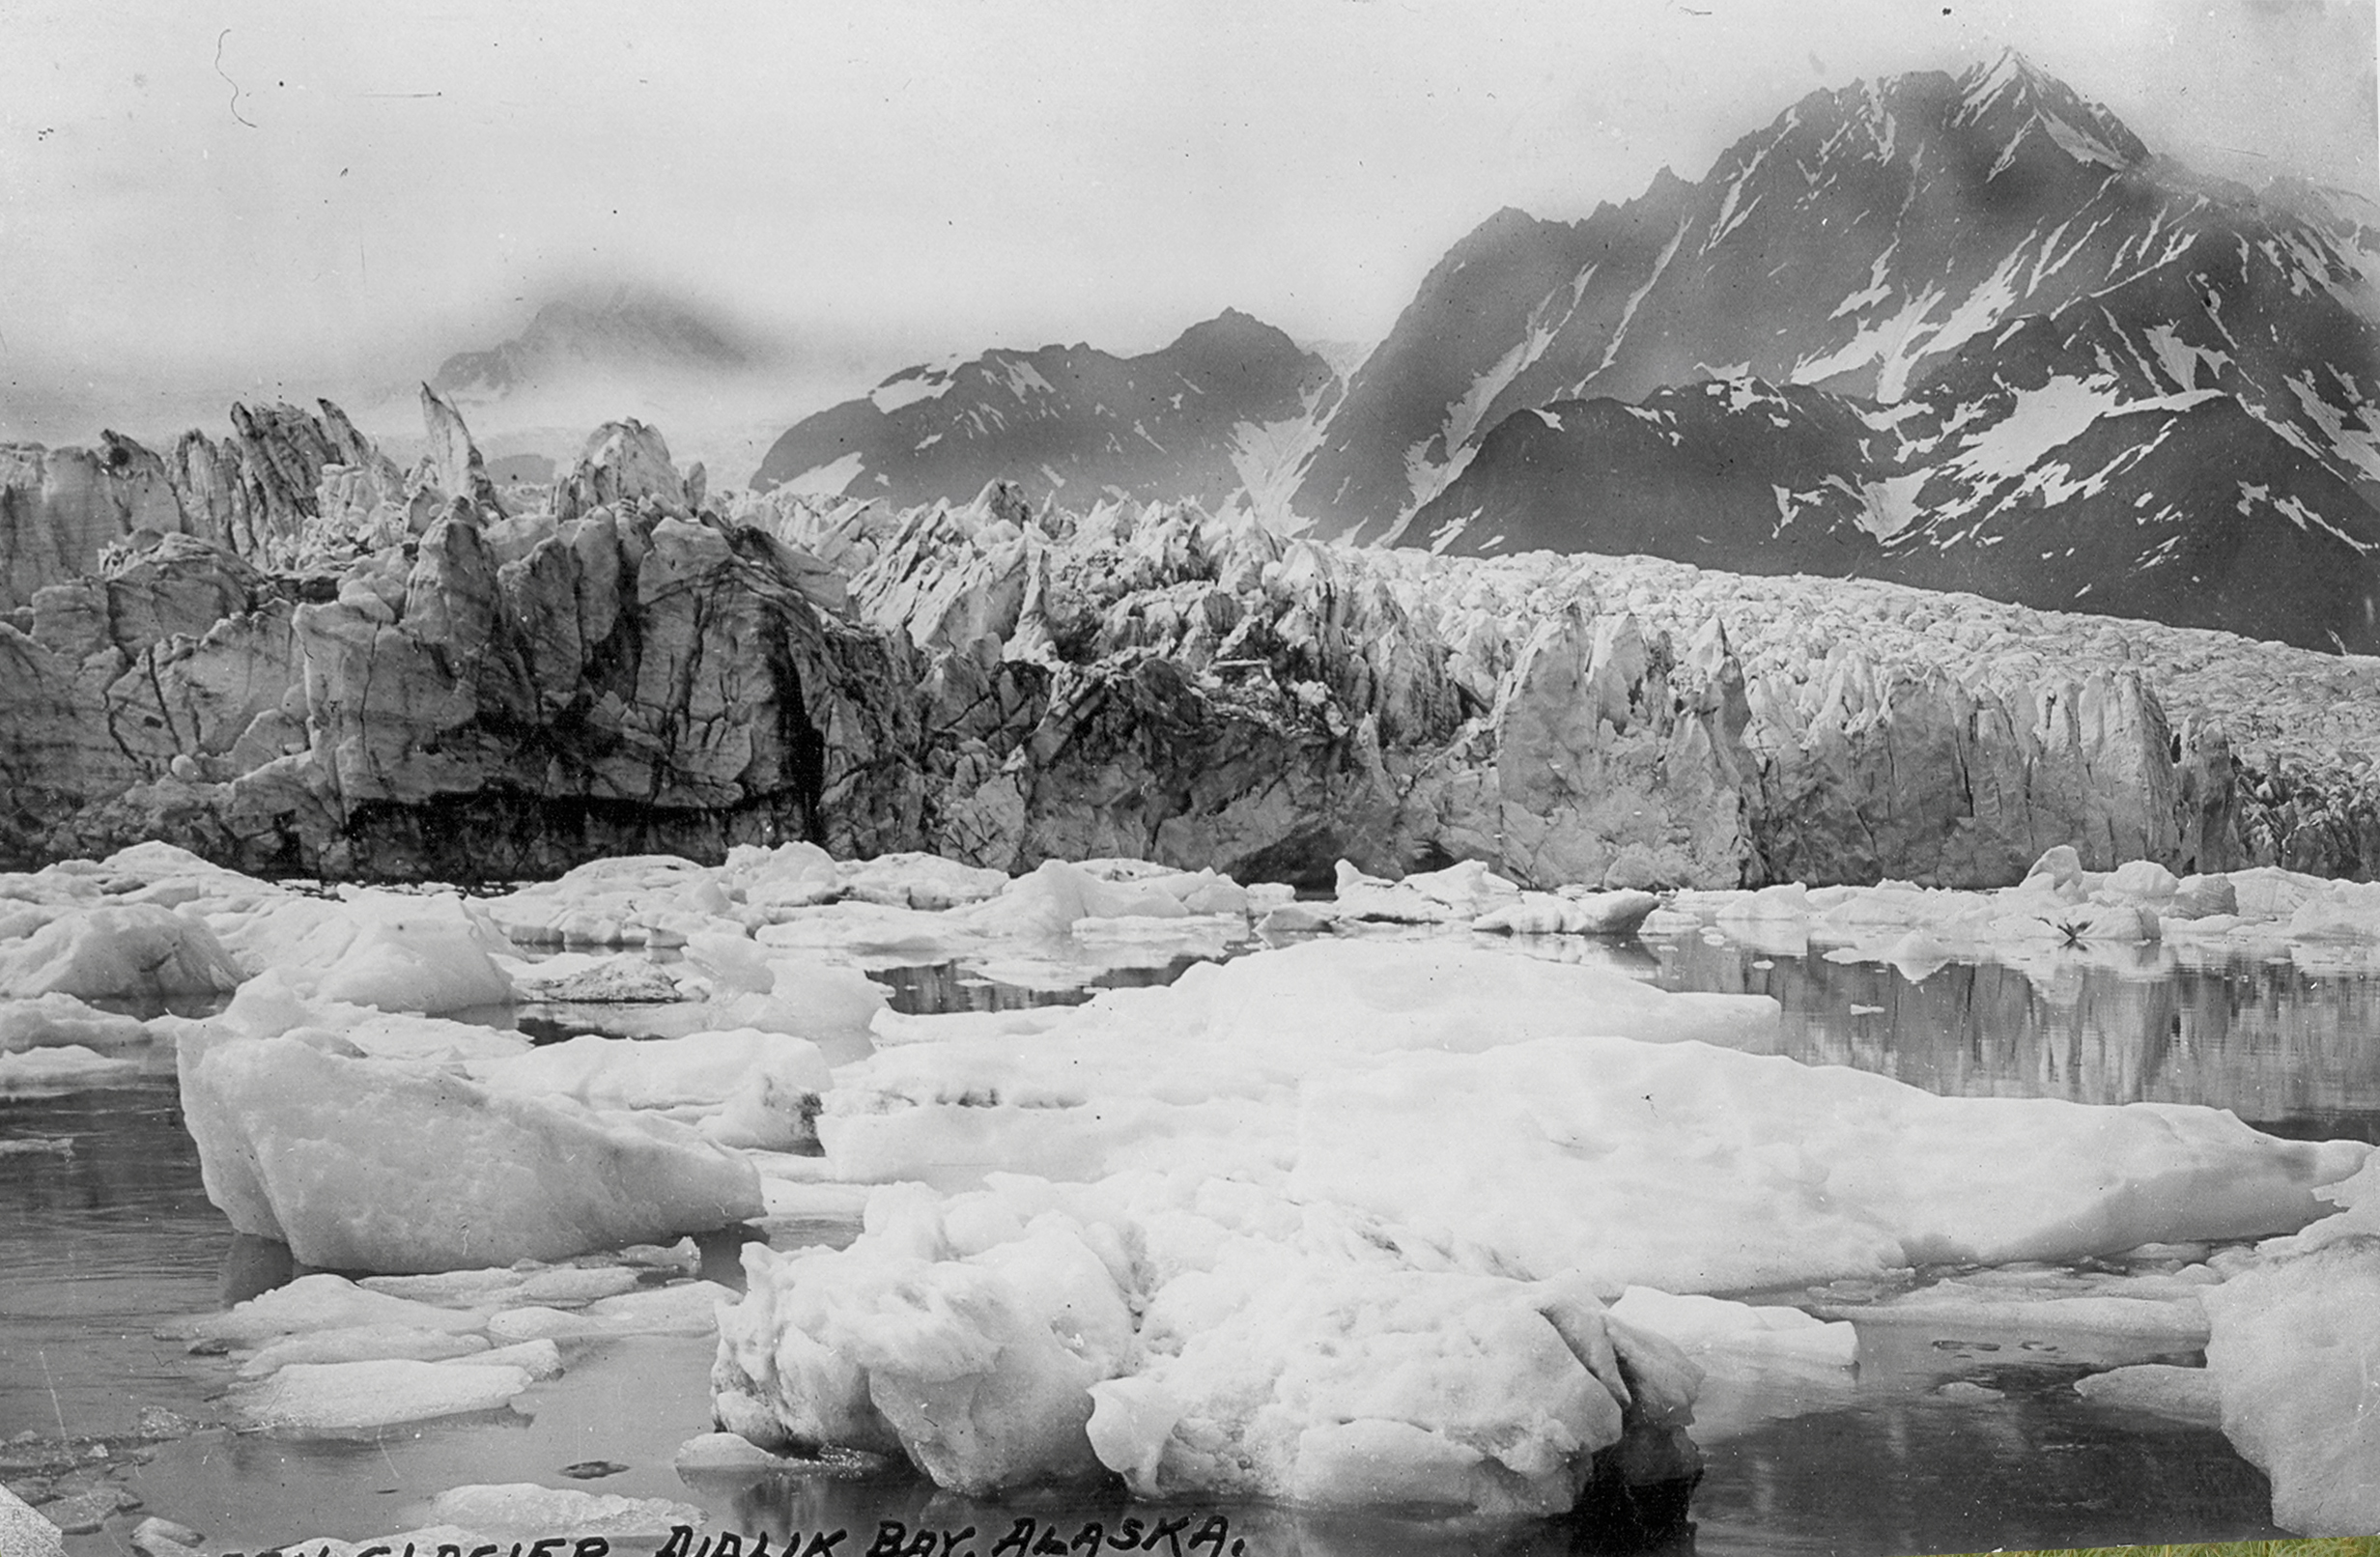
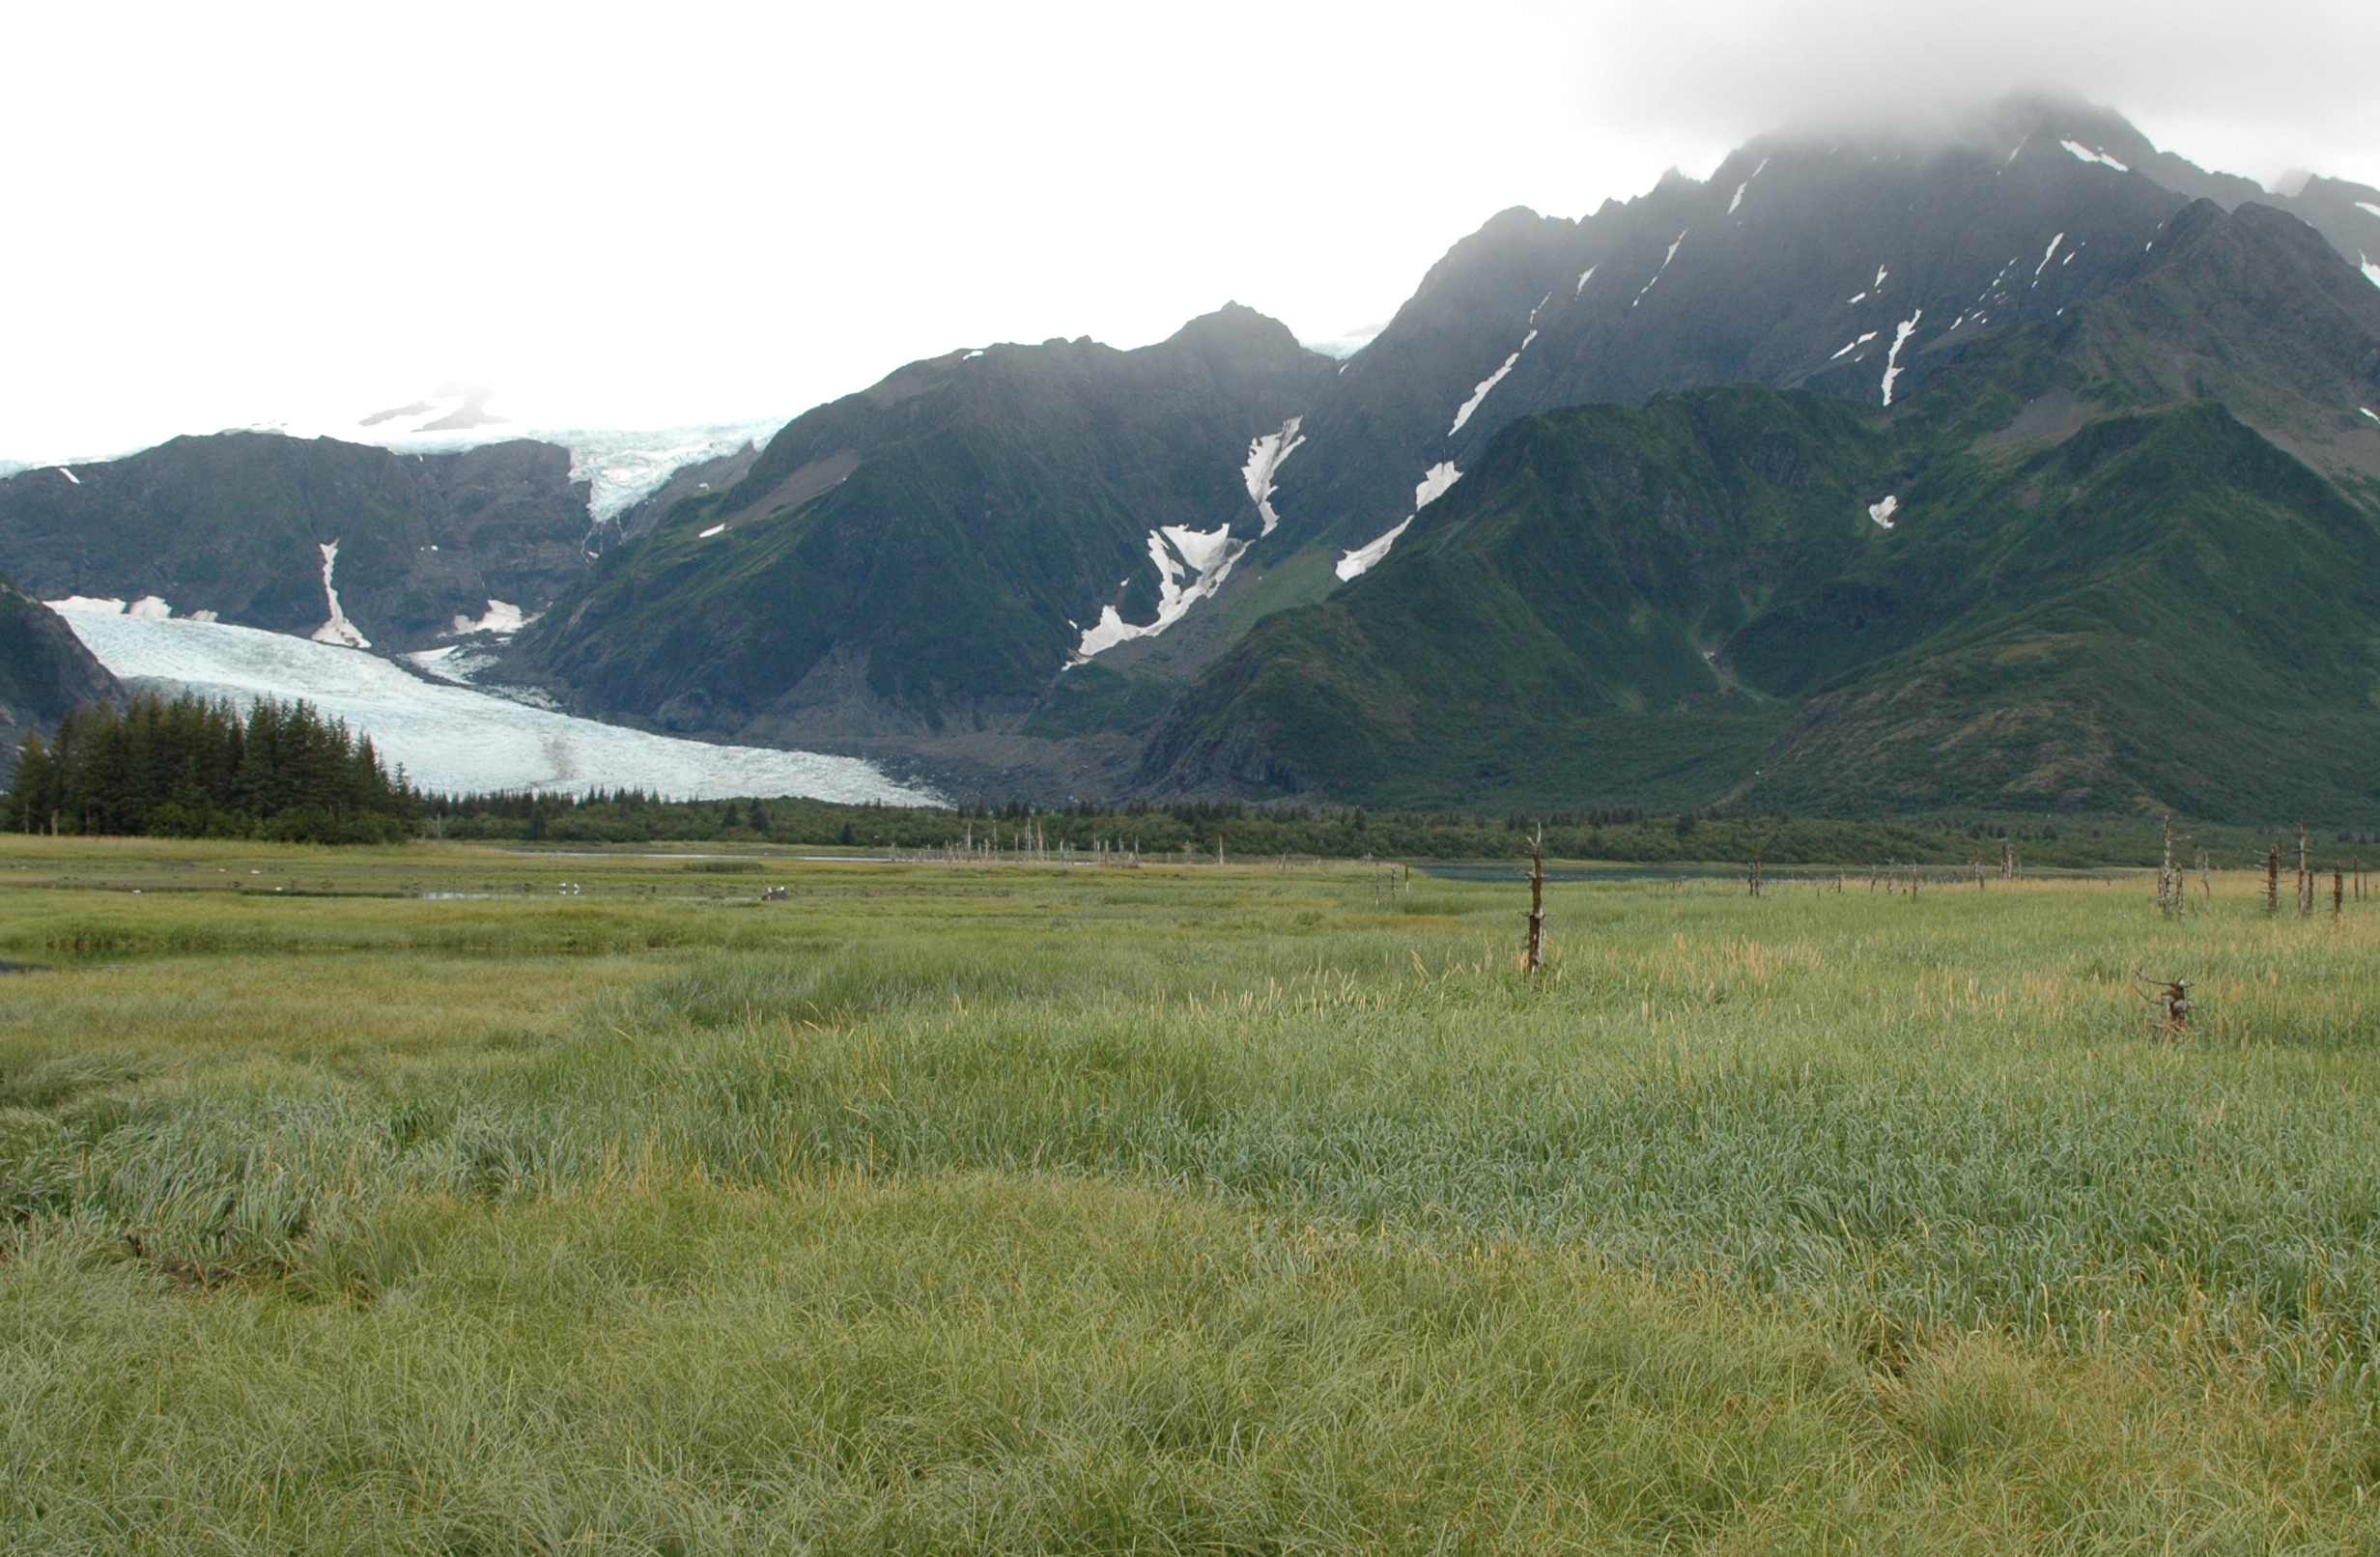
Photo credit above: "
Pedersen
Glacier, at Aialik Bay in Alaska’s Kenai Mountains, in 1917 (left)
and 2005 (right). In the early 20th century, the glacier met the water
and calved icebergs into a marginal lake near the bay. By 2005, the
glacier had retreated, leaving behind sediment allowed the lake to be
transformed into a small grassland."
Photos courtesy of Louis H. Pedersen (1917) and Bruce F. Molina
(2005), obtained from the Glacier Photograph Collection, Boulder,
Colorado USA: National Snow and Ice Data Center/World Data Center for
Glaciology. Large images: 1917 | 2005.


