Canadian Appetizer
Yesterday
was another meteorological disconnect, gazing out at a
supernaturally-green lawn in need of one last mowing - long shadows cast
by a feeble sun barely clearing the treetops. A fleeting ration of blue
sky.
The sun is as high as it was in late January; longer nights
and snow on the ground brewing up colder colds across Canada. A fresh
burst of wind chill will chase away any visions of Indian Summer over
the next 48 hours; highs stuck in the 20s today and Tuesday with a wind
chill slipping into single digits. Cold enough.
40s return late week; a shot at low 50s next weekend with a little rain Saturday night and early Sunday.
And
then things get more interesting. ECMWF (European) model data shows
rain changing to snow 1 week from today. Some accumulation is possible
as the leading edge of an "arctic gusher" sweeps southward. Think of
today as a cold weather appetizer. The main course is 7-10 days away.
It's
premature to contemplate snowfall amounts one week from today - although I don't envision a
major dumping you might just want to plant your driveway stakes within
the next week or so.
The pattern favors cold east and mild west. Autumn is finally succumbing to winter.
Happy
Veterans Day. Go out of your way to thank someone who has served or is
serving. We owe these men and women nothing less than our freedom.
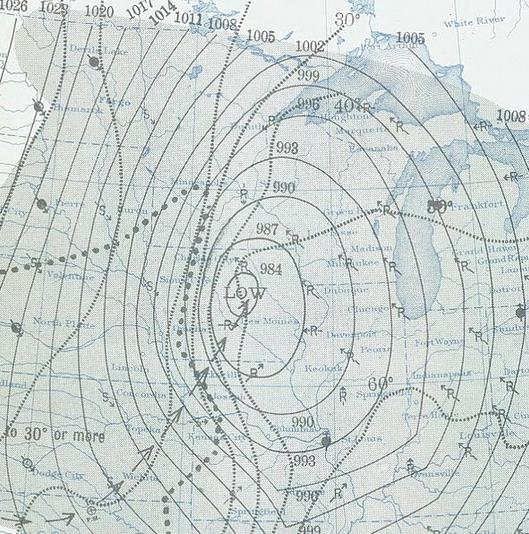
Anniversary Of The Armistice Day Blizzard.
November 11-12, 1940 brought extreme changes to Minnesota; large
temperature contrasts whipping up a sudden (unpredicted) blizzard. Could
the same thing happen today, in spite of computer models and Doppler
radar? I'd like to think not (if anything it would probably be
over-hyped) but this storm was an abject lesson in humility; a lesson we
should never forget.
Wikipedia has a good overview of this historic storm: "
The
morning of 11 November 1940 brought with it unseasonably high
temperatures. By early afternoon temperatures had warmed in lower to
middle 60s °F (18 °C) over most of the affected region. However, as the
day wore on conditions quickly deteriorated. Temperatures dropped
sharply, winds picked up, and rain, followed by sleet, and then snow
began to fall. An intense low pressure system had tracked from the
southern plains northeastward into western Wisconsin, pulling Gulf of
Mexico moisture up from the south and pulling down a cold arctic air
mass from the north. The result was a raging blizzard that would last
into the next day. Snowfalls of up to 27 inches (69 cm), winds of 50 to
80 mph (80–130 km/h), 20-foot (6.1 m) snow drifts, and 50-degree
Fahrenheit (30 °C) temperature drops were common over parts of the
states of Nebraska, South Dakota, Iowa, Minnesota, Wisconsin and
Michigan. In Minnesota, 27 inches (69 cm) of snow fell at Collegeville,
and the Twin Cities recorded 16 inches (41 cm). Record low pressures
were recorded in La Crosse, Wisconsin and Duluth, Minnesota.
Transportation and communications were crippled, which exacerbated
finding the dead and injured. The Armistice Day Blizzard ranks #2 in
Minnesota's list of top-5 weather events of the 20th century..."
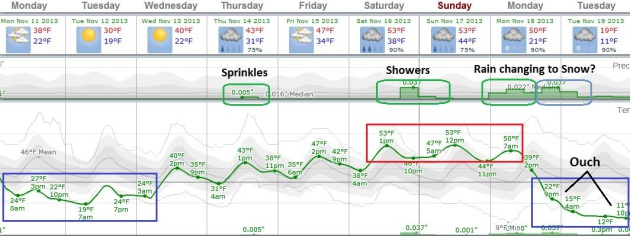
Serious Ups And Downs.
Here is ECMWF Guidance looking out 8 days, showing temperatures holding
in the 20s today and Tuesday as wind chill values sink into single
digits at times. At least the sun should be out later today and all day
Tuesday. We warm into the 40s during the latter half of the week, 50s
over the weekend with light rain or showers Saturday night into early
Sunday, then a period of rain changing to snow 1 week from today as MUCH
colder air approaches. Temperatures dip into the teens by Tuesday of
next week. Graph: Weatherspark.
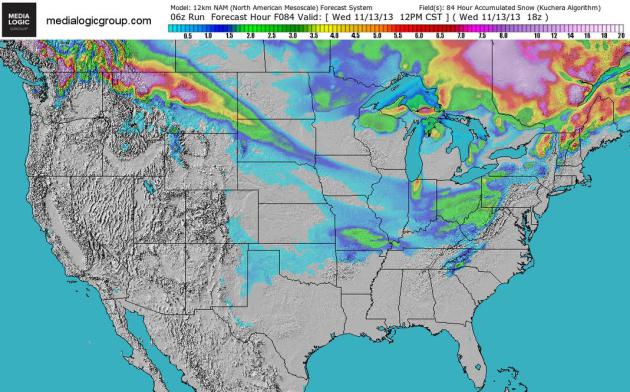
84 Hour Snowfall Forecast.
A surge of Canadian air sets off a streak of snow from the Midwest into
the Ohio Valley and Virginias by midweek, lake effect snows kicking in
downwind of Lake Michigan and Lake Superior. 12 km NAM guidance courtesy
of NOAA and Ham Weather.
Total Snowfall Amounts By Noon Wednesday.
Heaviest snows are predicted over the U.P. of Michigan and the snow
belts in northern Indiana, some 6"+ amounts over upstate New York and
northern New England, as well as the mountaints of Montana. Map: NOAA
and Ham Weather.
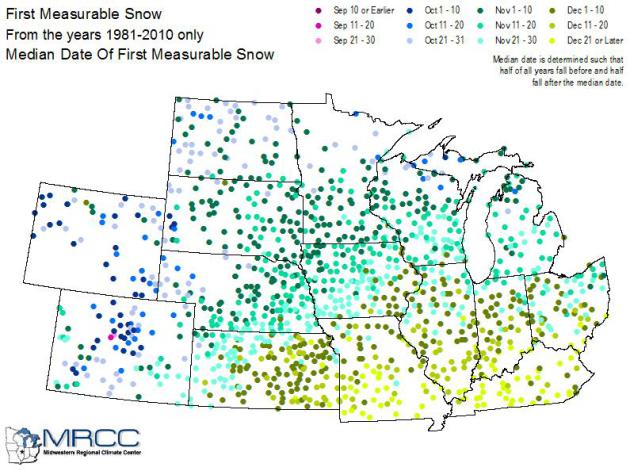
Average Date Of The First Measurable Snow. This is for the period 1981 - 2010, courtesy of the
Midwest Regional Climate Center.
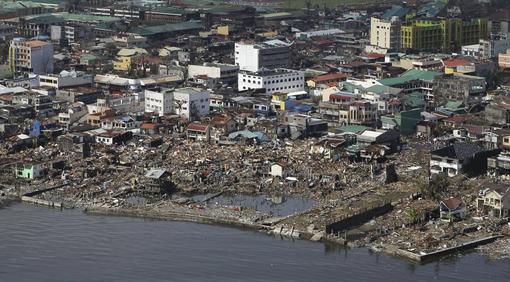
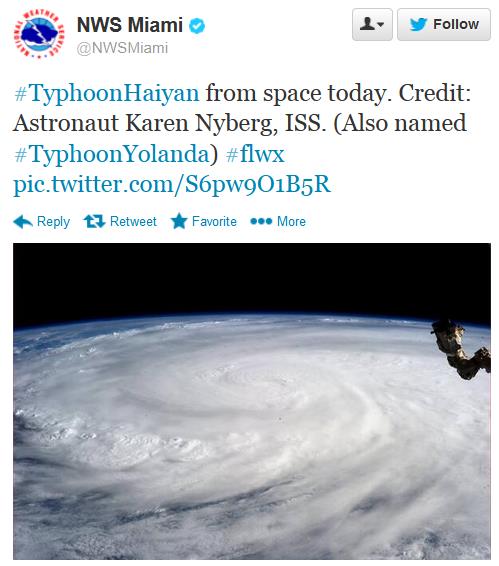
Philippines Typhoon Haiyan: "It Was Like A Tsunami".
Of course they're refering to the storm surge, a dome of water
preceding the eye of this record storm, possibly 15 feet or more above
sea level.
Z News has more details; here's an excerpt: "
Tacloban:
The fierce storm that ravaged Philippines on Friday inflicted massive
destruction and wreaked havoc in the country with many likening it to
tsunami as most of the deaths were caused by the towering sea waves. A
top UN disaster management official recalled Indian Ocean tsunami of
2004 while describing the situation. “The last time I saw something of
this scale was in the aftermath of the Indian Ocean tsunami", Sebastian
Rhodes Stampa, the head of United Nations disaster assessment team which
visited the area on Saturday, said in his report as cited by the New
York Times. “This is destruction on a massive scale. There are cars
thrown like tumbleweed,” he added.Philippines Interior Secretary Mar
Roxas described the situation as "horrific" adn said that the level of
destruction called for an overwhelming level of relief and rescue
operations..."
Photo credit above: "
The
devastation caused by Typhoon Haiyan, is seen Sunday, Nov. 10, 2013, in
Tacloban city, Leyte province in central Philippines. Typhoon Haiyan,
one of the most powerful storms on record, slammed into six central
Philippine islands on Friday, leaving a wide swath of destruction and
scores of people dead." (AP Photo/Toti Navales).
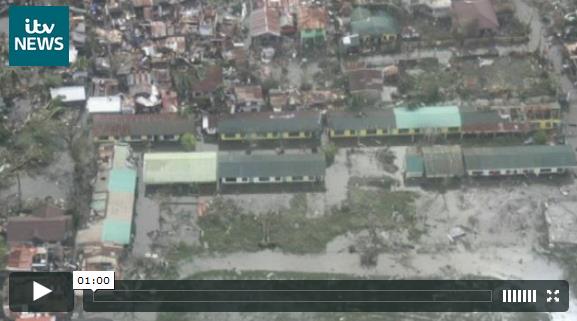
Scale Of Damage Caused By Super Typhoon Emerges. Here's a video clip and excerpt from
ITV News: "...
Experienced
aid workers are saying they haven't seen anything like it since the
December 2004 Asian Tsunami, and that's not a comparison you make
lightly. The US military is standing by by ready to give assistance. I
was speaking to a colonel in the US Marines today. He had been up with
the air force, surveying the worst affected areas. The government of the
Philippines has now accepted the UN offer of international assistance..."
858 mb.
Data suggests that the central pressure of Super Typhoon Haiyan may have dropped to
858 mb before reaching the Philippines, an unimaginable 25.33" of mercury.
That would make Haiyan the strongest storm ever observed on the face of the Earth. This is satellite-derived and not yet confirmed.
* here's a good link with photos and video clips showing the aftermath of Haiyan from
The Washington Post.
*
Reuters now estimates the Philippine death toll from Haiyan at "at least 10,000".
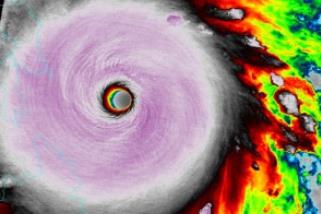
Super Typhoon Haiyan: One Of The Word's Most Powerful Storms In History From Space.
Here's a reminder of how vitally important weather satellites are
across the board, but especially with hurricane tracking and intensity
estimates. The USA is the only nation that flies planes (and probes)
into hurricanes to get a more accurate 3-D picture of a storm.
Meteorologist Jason Samenow has more details at
The Capital Weather Gang: "
Over
the last three days, satellite imagery has provided astonishing views
of the storm’s structure. Many meteorologists, myself included, have
remarked that they’ve never seen a storm with such an impressive
presentation. From its unmistakably clear eye (episodically blurred by
small swirls or mesovortices spinning inside it), the towering
thunderstorms surrounding it, and its impeccable symmetry – it is a
textbook, “perfect” tropical cyclone..." (enhanced IR loop: NOAA).
* more on the Saffir Simpson Scale for rating hurricane intensities, based on wind speed and damage
here.
* here's more information from
The Red Cross on how you can help Super Typhoon Haiyan survivors.
Should There Be A Category 6 For Hurricanes? Greg Laden brings up the pros and cons in a post at
scienceblogs.com; here's a clip: "...
There
is resistance to this proposal that comes from two mostly distinct
places. One is the community of those who deny the science of climate
change, or climate change itself, or science itself. Their motivation is
to not allow the so called “alarmists” (those who are alarmed at the
changes happening on our planet) to have a tool to point out that severe
weather can be very severe indeed. The other is the subset of
meteorologists who are actually correct, in a way, when they point out
that the Saffir Simpson scale, the scale with the five categories, can’t
be extended because of the way it is built, but who are very incorrect,
I think, when they point out that extending the scale would damage the
most important available tool for scaring people into running away (or
staying indoors)..."
Scientists Develop A New Way Of Classifying Hurricanes.
There are probably more effective ways to communicate the potential
damage of a given hurricane, going beyond Saffir Simpson. Here's an
excerpt of a relevant and still-timely May 7, 2013 post from
Climate Central: "...
Now,
a new study, published in the journal Monthly Weather Review by
scientists from Florida State University, proposes a new metric that
aims to complement Saffir-Simpson and other recently developed scales by
taking into account a storm's intensity, duration and size. The metric,
know as "Track Integrated Kinetic Energy", or TIKE, builds from an
existing measure of storm integrated kinetic energy (IKE), which was
developed in 2007..." (Image: NOAA).
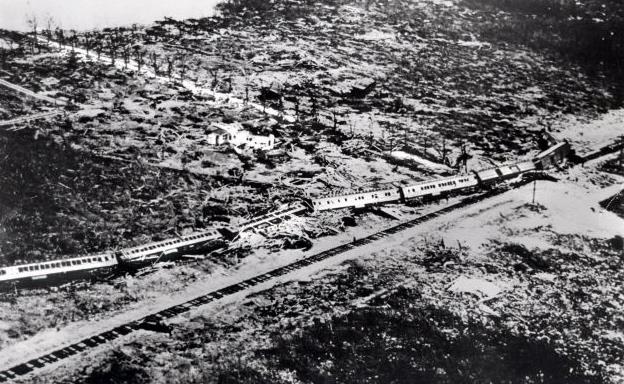
After Typhoon, A Look At Powerful U.S. Storms. Here's a good recap of America's most extreme hurricanes, courtesy of AP and
seattlepi.com: "
A
typhoon that slammed the Philippines is among the strongest on record
with sustained winds of nearly 150 mph when it made landfall, and the
destruction it caused rivals that of some of the most powerful
hurricanes to strike the U.S. mainland. A hurricane's intensity is
typically gauged by its barometric pressure. Below are the five most
intense hurricanes on record to strike the U.S. mainland, ranked by
minimum pressure at landfall, according to the National Hurricane Center
in Miami. Forecasters say the accuracy of wind speeds is somewhat
uncertain for some historical hurricanes because of limits on technology
at the time..."
Photo credit above: "
This
September 1935 file photo shows the wreckage of an 11-car passenger
train that was derailed by a Labor Day hurricane in the Florida Keys.
The Hurricane Center says no wind measurements were available from the
core of this small but “vicious” hurricane, which was a Category 5 storm
when it reached the Florida Keys. But a pressure measurement taken at
Long Key, Fla., makes it the most intense hurricane ever to make
landfall on the U.S. mainland. It was blamed for 408 deaths and caused
an estimated $6 million (1935 dollars) in damage." Photo: Uncredited, AP.
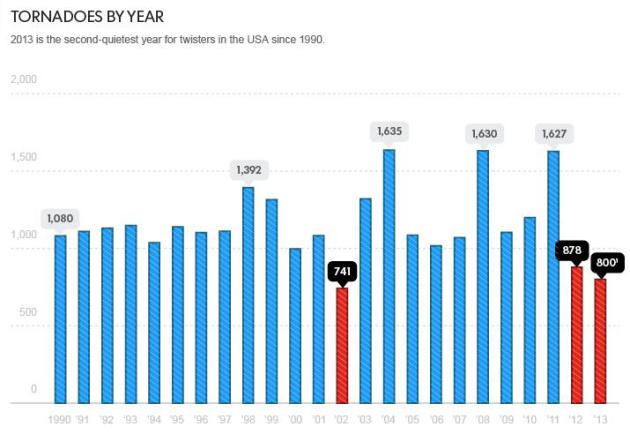
Tranquil Year For Tornadoes. 2013 has been the second-quietest year for tornadoes since 1990, according to NOAA SPC.
USA Today has a good recap; here's the introduction: "
Hurricanes
have been on holiday this year, and so too have their ferocious
cousins, tornadoes. The USA is enjoying its second-consecutive
below-average tornado season, and one of the calmest years for tornadoes
in more than two decades, according to data from the Storm Prediction
Center in Norman, Okla. "It's been a near-record quiet year, especially
with respect to strong to violent tornadoes," said warning coordination
meteorologist Greg Carbin of the prediction center..."
Graphic credit
above: Storm Prediction Center, Roger Pielke Jr., University of
Colorado; 1 - Numbers are for Jan. 1 through Oct. 31 of each year. 2013
number is preliminary; 2 - NOAA estimated. Janet Loehrke and Doyle Rice,
USA TODAY.
China's Massive Pollution Problem.
The Week has an update; here's the intro: "
How
bad is China's smog? Sixteen of the world's 20 most polluted cities are
in China. The air in some cities there is so bad that, at times,
visibility drops to 30 feet, traffic slows to a crawl, and nearly
everyone wears masks over their noses and mouths. In Harbin, a city of
11 million people, government officials recently shut down roads,
schools, and the airport when air pollution levels hit 40 times the safe
limit set by the World Health Organization (WHO). During the
"airpocalypse" in Beijing earlier this year, the density of small,
lung-penetrating particles reached 993 micrograms per cubic meter — a
concentration normally not seen outside of forest fires. The U.S.
Environmental Protection Agency (EPA) considers anything above 300
dangerous, and maxes out its scale at 500..."
Photo credit above: "
A
Chinese man covers his nose and mouth as he walks on the street during a
day of heavy pollution in Harbin in northeast China's Heilongjiang
province Monday Oct. 21, 2013. Visibility shrank to less than half a
football field and small-particle pollution soared to a record 40 times
higher than an international safety standard in the northern Chinese
city as the region entered its high-smog season." (AP Photo)
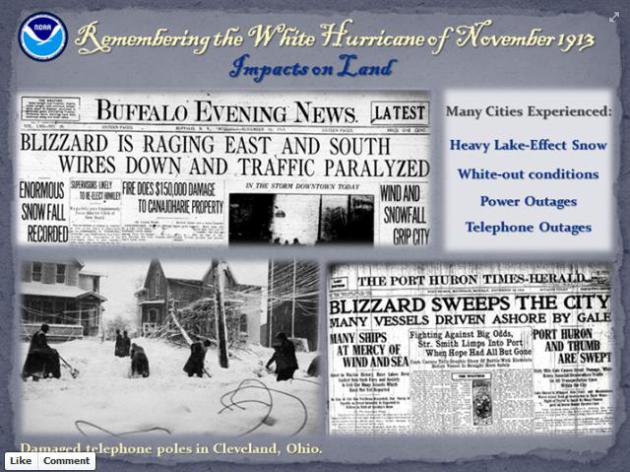
Remembering The "White Hurricane" Of Mid-November, 1913. Here's a
great recap
of a wild storm that whipped up 90-mph winds and 30-40 foot seas on the
Great Lakes in 1913, courtesy of the Detroit office of the National
Weather Service: "
During
the infamous “White Hurricane” of November 1913, intense lake-effect
snow occurred downwind of the Great Lakes as cold, arctic air moved over
the relatively warm lake water. The wind and snow combined to cause
whiteout conditions, paralyzing many cities across the Great Lakes
Region. Port Huron, Mich., and Cleveland,
Ohio, were two of the hardest-hit cities, experiencing both heavy
snowfall and tremendous snow drifts. Cleveland broke its 24-hour
snowfall record, with 17.4 inches in one day and a three-day total of
22.2 inches. High winds caused extensive power outages across the Great
Lakes, effectively cutting off communication via telephone and telegraph."

Fear Of The Dark. How real are the risks of a major failure of the power grid? The New York Times takes a look - here's an excerpt: "...Energy
in general is something people like to worry about, said Mr. Apt, and
grid failure is the latest target of that anxiety. “It echoes the ‘peak
oil’ theme,” he said, referring to the alarmist concern, especially
before the advent of fracking, that oil supplies had peaked and were
about to shrink, with catastrophic results. The idea of a sustained
blackout resonates in the public’s mind, agreed David Ropeik, an expert
on risk perception, particularly because it could come from either
cyberattack, physical attack by terrorists or even Mother Nature as a
side effect of solar flares. “It is one of those low-probability,
high-consequence events that every once in awhile scares the bejesus out
of us,” he said..."
Climate Stories...
Credit
here.
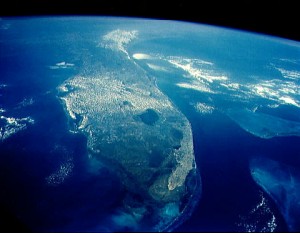
South Florida Faces Ominous Prospects From Rising Waters.
The New York Times has the story - here's a clip: "...
Much
of Florida’s 1,197-mile coastline is only a few feet above the current
sea level, and billions of dollars’ worth of buildings, roads and other
infrastructure lies on highly porous limestone that leaches water like a
sponge. But while officials here and in other coastal cities, many of
whom attended a two-day conference on climate change
last week in Fort Lauderdale, have begun to address the problem, the
issue has gotten little traction among state legislators in Tallahassee.
The issue appears to be similarly opaque to segments of the community —
business, real estate, tourism — that have a vested interest in
protecting South Florida’s bustling economy..."
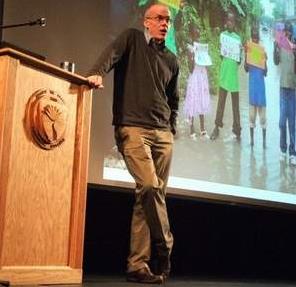
Vermont's Bill McKibbon Finds Climate Change Taking A Toll - On Him. I've met Bill - he's passionate, relentless and tenacious, and he keeps up an almost supernatural pace.
The Rutland Herald has the story - here's a clip: "
In
his travels as an environmental author and activist, Ripton resident
Bill McKibben is used to receiving climate-change questions from
skeptics who sound like Stephen Colbert, the sly television satirist who
once inquired, “Did you come down from Vermont in some car powered by
self-righteousness?” But the author of the first book about global
warming written for a general audience was surprised recently by the
mother of one of his daughter’s former schoolmates. Standing outside a
local library, the woman was distributing fliers accusing the crusader
who has jetted to every continent (“once I hit four of them in six
days”) of having too big a carbon footprint..."
Photo credit above: Kevin O’Connor Photo. "
Vermont environmental author and activist Bill McKibben speaks at Landmark College in Putney."
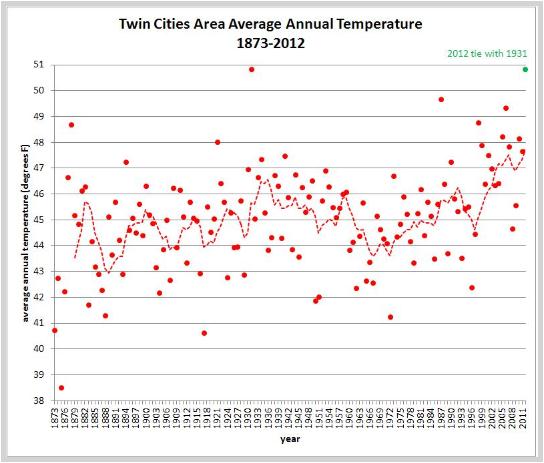
Twin Cities Average Annual Temperature Trends Since 1873. Data courtesy of NOAA.
Super Typhoon Haiyan: A Hint Of What's To Come? Climate Central
meteorologist Andrew Freedman takes a look at how warming oceans may be
impacting the intensity of hurricanes and typhoons; here's a clip: "
Super Typhoon Haiyan was one of the most intense tropical cyclones at landfall on record when it struck the Philippines on Nov. 7. Its maximum sustained winds at landfall were pegged at 195 mph with gusts above 220 mph. Some meteorologists even proclaimed it to be the strongest tropical cyclone at landfall in recorded history.
Haiyan’s strength and the duration of its Category 5 intensity — the
storm remained at peak Category 5 intensity for an incredible 48
straight hours — raises the question of whether manmade global warming
tipped the odds in favor of such an extreme storm. After all, the global
atmosphere contains 4 percent more water vapor than there was in the
1970s and global air and sea surface temperatures are higher now than
they used to be, due in large part to manmade global warming as well as
natural climate variability. These changes would, in theory at least,
lead to stronger and wetter storms..."
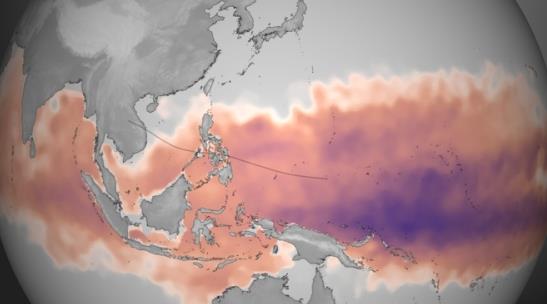
Image credit above: "
Graphic
showing the total amount of heat energy available for Super Typhoon
Haiyan to absorb, not just on the surface, but integrated through the
water column. Deeper, warmer pools of water are colored purple, though
any region colored from pink to purple has sufficient energy to fuel
storm intensification. The dotted line represents the best-track and
forecast data as of 16:00 UTC on Nov. 7." Credit: NOAA.
More information on the image above provided by NOAA:
"
The
intensification of Super Typhoon Haiyan is being fueled by "ideal"
environmental conditions - namely low wind shear and warm ocean
temperatures. Maximum sustained winds are currently at 195 mph, well
above the Category 5 classification used for Atlantic and East Pacific
hurricanes. Plotted here is the average Tropical Cyclone Heat Potential
product for October 28 - November 3, 2013, taken directly from NOAA
View. This dataset, developed byNOAA/AOML, shows the total amount of
heat energy available for the storm to absorb, not just on the surface,
but integrated through the water column. Deeper, warmer pools of water
are colored purple, though any region colored from pink to purple has
sufficient energy to fuel storm intensification. The dotted line
represents the best-track and forecast data as of 16:00 UTC on November
7, 2013."
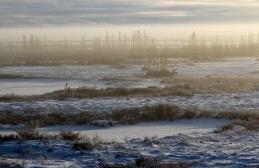
"Last" Arctic Region Succumbing To Global Warming. Here's the intro to a story at
Blue and Green Tomorrow: "
Researchers
from Ontario universities say that the lakes of the Hudson Bay Lowlands
in north-east Canada, one of the last areas to hold out against global
warming trends, are showing signs of sudden change. Their study,
published in the journal Proceedings of the Royal Society B, notes that
the sub-Arctic region had maintained stable, cool temperatures for
hundreds of years until the mid-1990s, thanks to sea ice on Hudson Bay –
the largest northern inland sea – that naturally cooled the waters.
However, average air temperatures in the area have also risen
dramatically – going from around 0C in the mid-1990s to 3C by the end of
the 2000s in the shoreline town of Churchill, Manitoba. By studying
long-dead algae from the lakebeds off the Hudson Bay shoreline, the
scientists found that the waters have warmed at an extraordinary rate
and magnitude over the last two decades..."
Could Hybrid Nuclear Plants Help Stem Global Warming? Clean Technica has the story - here's the introduction: "
MIT's
Charles Forsberg has come up with an idea that might work to combine
nuclear energy generation with renewable energies in an effort to halt
the need for fossil fuels. The idea proposes combining a nuclear power
plant with another renewable energy system, which Forsberg argues "could
add up to much more than the sum of its parts..."
Is This The Most Anti-Science, Anti-Environmental TV Ad Ever? Who needs trees when you have Toys "R" Us? Here's an excerpt and video clip from
Huffington Post: "...
In
this ad, kids are loaded onto a school bus labeled "Meet the Trees
Foundation." The guide, under the guise of being "Ranger Brad" says,
"Today we're taking some kids on the best field trip they could wish
for." He then shows them some pictures of leaves, while the camera pans
around the bus at bored, tired, yawning kids. Then, surprise! He reveals
they are not going on a natural science field trip at all, but to...
Toys "R" Us! Celebration! Confetti littering the ground as the kids run
from the bus into the store! Free wild rumpus in the store playing with
whatever they want. Hooray!.."