Minnesota Tough
I
am in awe of the pioneers, fur traders and homesteaders who settled at
Fort Snelling around 1820, grappling with blizzards, bugs and perpetual
uncertainty. I've even more amazed by the small band of explorers who
must have muttered "not cold enough", and headed north to settle
Winnipeg. Who were these people?
Fast-forward 200 years. Now we groan when the mercury drops below 30F, darting from one heated space to the next.
The
reality: winters are trending milder over time. Recent decades have
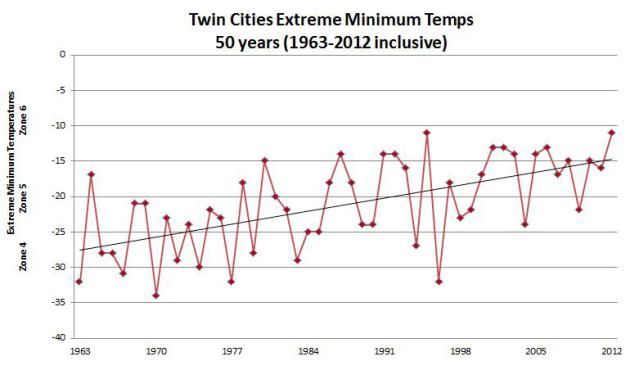
brought fewer subzero lows & milder nights. Edina investment banker
and prize rose grower Jack Falker has been tracking the coldest lows of
winter since the 60s. Back then we saw lows dipping into the -30s. Now
-15F is a big deal. It's hard to keep perspective when "average" keeps
changing.
I expect a better hair day today; less wind with enough
blue sky for low 40s. A cold slap Monday & Tuesday gives way to
rapid warming - highs near 50F next weekend, when the atmosphere should
be warm enough for some rain on Sunday. Not exactly Indian Summer, but
not bad for mid-November.
Soak it up. ECMWF model data shows a real cold front in 8-9 days. No big dumpings of snow in sight just yet.
Coldest low temperatures at MSP International every winter since 1963 (above) courtesy of Jack Falker.
A Taste.
Temperatures should rebound fairly quickly the latter half of next
week, but NOAA model guidance (12 km NAM going out thru Tuesday night)
shows Canadian air sloshing south of the border early next week;
temperatures over the northern tier of the USA at least 15F colder than
average. Loop: Ham Weather.
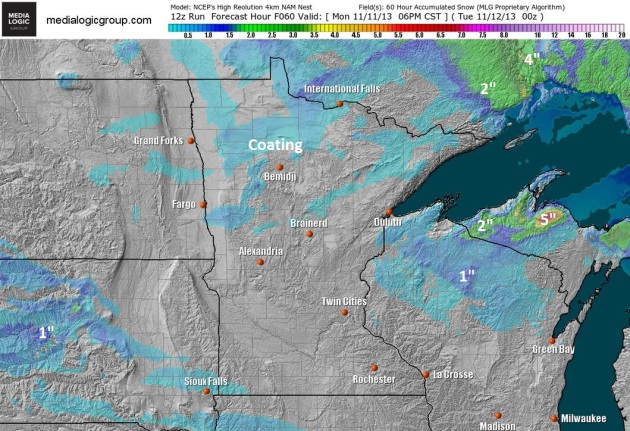
Dribs And Drabs Of Snow.
NOAA's 4 km NAM shows a light coating of snow possible over the
northern third of Minnesota, as much as 2-5" of lake effect over the
Upper Peninsula of Michigan by 6 pm Monday. This next burst of chill
will not be preceeded by significant snowfall. Map:
Ham Weather.
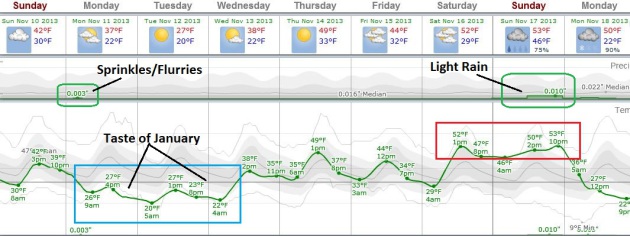
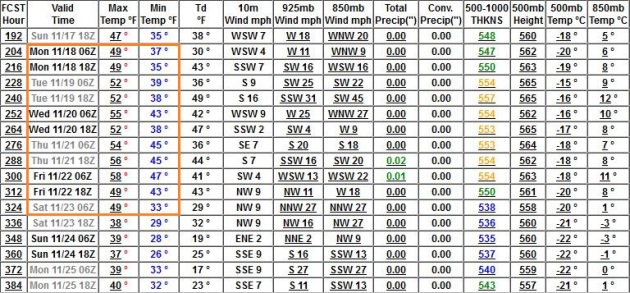
Roller Coaster.
ECMWF data, courtesy of Weatherspark, shows next week's cold outbreak,
and a fairly short one at that. Temperatures may hold in the 20s Monday
and Tuesday before recovering into the 40s by late week; 50F not out of
the question by next weekend.
Serious Inconsistencies.
The GFS model from NOAA shows an extended period of 40s and 50s, with
an outside shot at 60 on Friday, November 22. This model is at odds with
the ECMWF solution below:
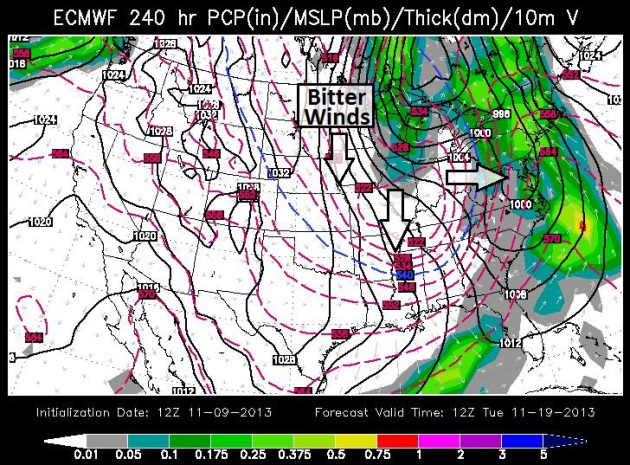
ECMWF Solution.
The European model begs to differ pulling more numbing air south of the
border early next week. The solution above is valid 6 am Tuesday,
November 19, the same day the GFS is suggesting highs in the 50s. I'm
leaning toward the (colder) ECMWF solution, but hope that the GFS might
have the right idea. We'll see.
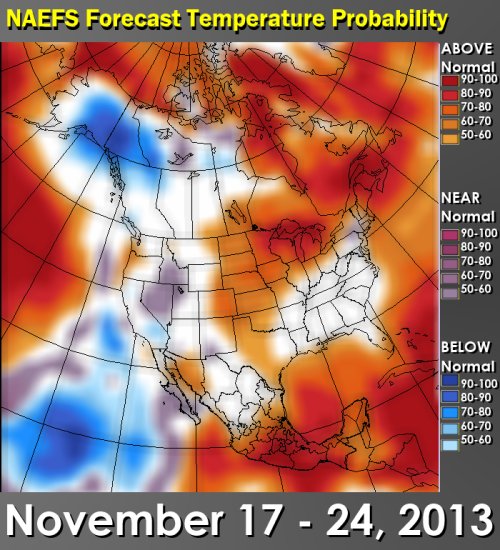
More Hints Of A Warm Bias.
Environment Canada's NAEFS model valid November 17-24 shows warmer than
average temperatures from the Plains into the Midwest and Great Lakes.
858 mb.
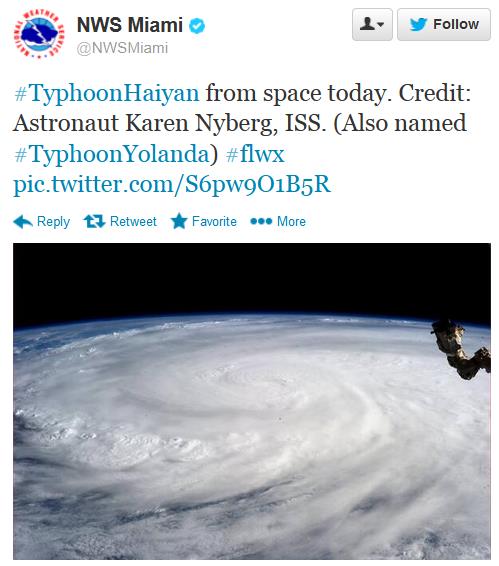
Data suggests that the central pressure of Super Typhoon Haiyan may have dropped to
858 mb before reaching the Philippines, an unimaginable 25.33" of mercury.
That would make Haiyan the strongest storm ever observed on the face of the Earth. This is satellite-derived and not yet confirmed.
* here's a good link with photos and video clips showing the aftermath of Haiyan from
The Washington Post.
*
Reuters now estimates the Philippine death toll from Haiyan at "at least 10,000".
Super Typhoon Haiyan: One Of The Word's Most Powerful Storms In History From Space.
Here's a reminder of how vitally important weather satellites are
across the board, but especially with hurricane tracking and intensity
estimates. The USA is the only nation that flies planes (and probes)
into hurricanes to get a more accurate 3-D picture of a storm.
Meteorologist Jason Samenow has more details at
The Capital Weather Gang: "
Over
the last three days, satellite imagery has provided astonishing views
of the storm’s structure. Many meteorologists, myself included, have
remarked that they’ve never seen a storm with such an impressive
presentation. From its unmistakably clear eye (episodically blurred by
small swirls or mesovortices spinning inside it), the towering
thunderstorms surrounding it, and its impeccable symmetry – it is a
textbook, “perfect” tropical cyclone..." (enhanced IR loop: NOAA).
* here's more information from
The Red Cross on how you can help Super Typhoon Haiyan survivors.
"Astounding" Warmth Recorded Across Alaska Last Month, According to Climate Center.
Alaska Dispatch has the details; here's an excerpt: "
The
warmth that swaddled Alaska in October was nothing short of
"astounding," with 30 warmer-than-normal days and the overall
temperature a "significant" 7.4 degrees higher than normal.
The dramatic adjectives come from the normally staid Alaska Climate
Research Center, which reports on the wet-and-warm month in a new summary that highlights the drumbeat of shattered records in both temperature and precipitation..."
Photo credit above: "
Trumpeter swans lingered longer in Potter Marsh this year, as autumn weather was warmer than usual." Loren Holmes photo.
After Typhoon, A Look At Powerful U.S. Storms. Here's a good recap of America's most extreme hurricanes, courtesy of AP and
seattlepi.com: "
A
typhoon that slammed the Philippines is among the strongest on record
with sustained winds of nearly 150 mph when it made landfall, and the
destruction it caused rivals that of some of the most powerful
hurricanes to strike the U.S. mainland. A hurricane's intensity is
typically gauged by its barometric pressure. Below are the five most
intense hurricanes on record to strike the U.S. mainland, ranked by
minimum pressure at landfall, according to the National Hurricane Center
in Miami. Forecasters say the accuracy of wind speeds is somewhat
uncertain for some historical hurricanes because of limits on technology
at the time..."
Photo credit above: "
This
September 1935 file photo shows the wreckage of an 11-car passenger
train that was derailed by a Labor Day hurricane in the Florida Keys.
The Hurricane Center says no wind measurements were available from the
core of this small but “vicious” hurricane, which was a Category 5 storm
when it reached the Florida Keys. But a pressure measurement taken at
Long Key, Fla., makes it the most intense hurricane ever to make
landfall on the U.S. mainland. It was blamed for 408 deaths and caused
an estimated $6 million (1935 dollars) in damage." Photo: Uncredited, AP.
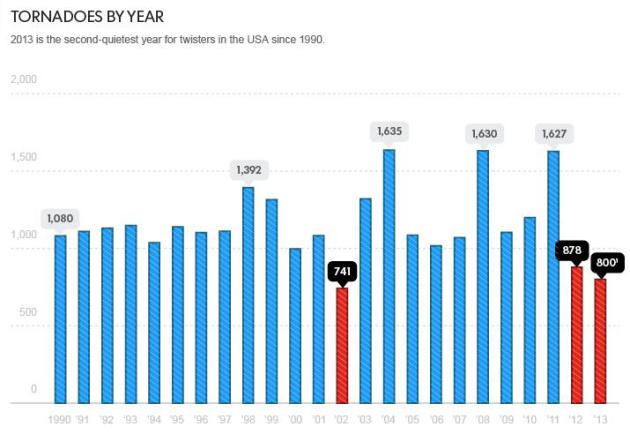
Tranquil Year For Tornadoes. 2013 has been the second-quietest year for tornadoes since 1990, according to NOAA SPC.
USA Today has a good recap; here's the introduction: "
Hurricanes
have been on holiday this year, and so too have their ferocious
cousins, tornadoes. The USA is enjoying its second-consecutive
below-average tornado season, and one of the calmest years for tornadoes
in more than two decades, according to data from the Storm Prediction
Center in Norman, Okla. "It's been a near-record quiet year, especially
with respect to strong to violent tornadoes," said warning coordination
meteorologist Greg Carbin of the prediction center..."
Graphic credit
above: Storm Prediction Center, Roger Pielke Jr., University of
Colorado; 1 - Numbers are for Jan. 1 through Oct. 31 of each year. 2013
number is preliminary; 2 - NOAA estimated. Janet Loehrke and Doyle Rice,
USA TODAY
Remembering The "White Hurricane" Of Mid-November, 1913. Here's a
great recap
of a wild storm that whipped up 90-mph winds and 30-40 foot seas on the
Great Lakes in 1913, courtesy of the Detroit office of the National
Weather Service: "
During
the infamous “White Hurricane” of November 1913, intense lake-effect
snow occurred downwind of the Great Lakes as cold, arctic air moved over
the relatively warm lake water. The wind and snow combined to cause
whiteout conditions, paralyzing many cities across the Great Lakes
Region. Port Huron, Mich., and Cleveland,
Ohio, were two of the hardest-hit cities, experiencing both heavy
snowfall and tremendous snow drifts. Cleveland broke its 24-hour
snowfall record, with 17.4 inches in one day and a three-day total of
22.2 inches. High winds caused extensive power outages across the Great
Lakes, effectively cutting off communication via telephone and telegraph."
Minnesota Weather History on November 9 (data from the Twin Cities National Weather Service):
1999:
Late season hail fell in Eden Prairie. Pea size hail (0.25 inch. in
diameter) up to one foot deep collected near storm drains near Hennepin
Technical College and Hwy 212. Pea size hail about 4 inches deep was
also reported on grass near Hwy 5 and Mitchell Rd. The hail and
torrential rains forced drivers off the road in Bloomington.
1998:
A potent storm nick-named a "land hurricane" set a new all time record
low pressure for Minnesota around noon at Albert Lea and Austin as it
passed overhead. The automated weather observing equipment at both
airports measured a barometric pressure of 28.43 inches, which broke the
previous record of 28.55 inches set on 11 January 1975 in Duluth. The
new record for the Twin Cities was set with a reading of 28.55 inches.
The previous record was 28.77 inches, set on April 13th of 1964. 10
inches of snow fell at Madison, MN and St. Cloud State University had a
wind gust to 64 mph.
1975: The Edmund Fitzgerald sinks off Whitefish Bay with the loss of 29 people.
1913: A severe windstorm occurred on Lake Superior. Three ships were lost. Winds were clocked at 62 mph at Duluth.
* Photo above courtesy of Steve Burns.
Climate Stories...
"It
is a lie that we can continue to live as we have, that our reliance on
fossil fuels and our endless economic growth at the expense of our
planet is stable and sustainable. Not only does science tell us that,
but God's word calls us to account for how we've treated creation." -
Jim Wallis, The Huffington Post.
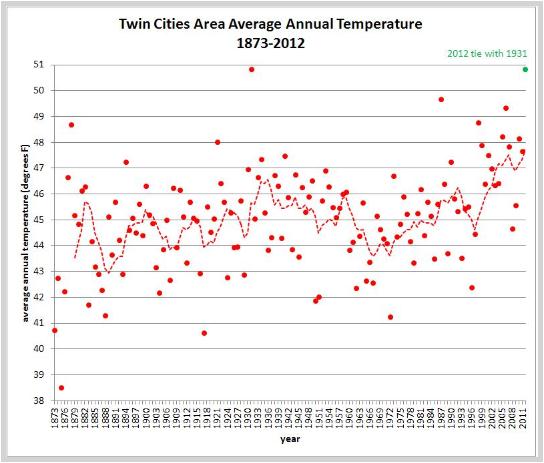
Twin Cities Average Annual Temperature Trends Since 1873. Data courtesy of NOAA.
Super Typhoon Haiyan: A Hint Of What's To Come? Climate Central
meteorologist Andrew Freedman takes a look at how warming oceans may be
impacting the intensity of hurricanes and typhoons; here's a clip: "
Super Typhoon Haiyan was one of the most intense tropical cyclones at landfall on record when it struck the Philippines on Nov. 7. Its maximum sustained winds at landfall were pegged at 195 mph with gusts above 220 mph. Some meteorologists even proclaimed it to be the strongest tropical cyclone at landfall in recorded history.
Haiyan’s strength and the duration of its Category 5 intensity — the
storm remained at peak Category 5 intensity for an incredible 48
straight hours — raises the question of whether manmade global warming
tipped the odds in favor of such an extreme storm. After all, the global
atmosphere contains 4 percent more water vapor than there was in the
1970s and global air and sea surface temperatures are higher now than
they used to be, due in large part to manmade global warming as well as
natural climate variability. These changes would, in theory at least,
lead to stronger and wetter storms..."
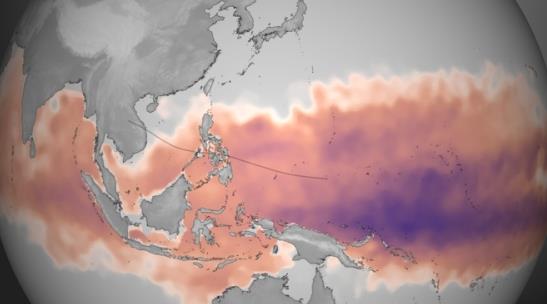
Image credit above: "
Graphic
showing the total amount of heat energy available for Super Typhoon
Haiyan to absorb, not just on the surface, but integrated through the
water column. Deeper, warmer pools of water are colored purple, though
any region colored from pink to purple has sufficient energy to fuel
storm intensification. The dotted line represents the best-track and
forecast data as of 16:00 UTC on Nov. 7." Credit: NOAA.
More information on the image above provided by NOAA:
"
The
intensification of Super Typhoon Haiyan is being fueled by "ideal"
environmental conditions - namely low wind shear and warm ocean
temperatures. Maximum sustained winds are currently at 195 mph, well
above the Category 5 classification used for Atlantic and East Pacific
hurricanes. Plotted here is the average Tropical Cyclone Heat Potential
product for October 28 - November 3, 2013, taken directly from NOAA
View. This dataset, developed byNOAA/AOML, shows the total amount of
heat energy available for the storm to absorb, not just on the surface,
but integrated through the water column. Deeper, warmer pools of water
are colored purple, though any region colored from pink to purple has
sufficient energy to fuel storm intensification. The dotted line
represents the best-track and forecast data as of 16:00 UTC on November
7, 2013."
"Last" Arctic Region Succumbing To Global Warming. Here's the intro to a story at
Blue and Green Tomorrow: "
Researchers
from Ontario universities say that the lakes of the Hudson Bay Lowlands
in north-east Canada, one of the last areas to hold out against global
warming trends, are showing signs of sudden change. Their study,
published in the journal Proceedings of the Royal Society B, notes that
the sub-Arctic region had maintained stable, cool temperatures for
hundreds of years until the mid-1990s, thanks to sea ice on Hudson Bay –
the largest northern inland sea – that naturally cooled the waters.
However, average air temperatures in the area have also risen
dramatically – going from around 0C in the mid-1990s to 3C by the end of
the 2000s in the shoreline town of Churchill, Manitoba. By studying
long-dead algae from the lakebeds off the Hudson Bay shoreline, the
scientists found that the waters have warmed at an extraordinary rate
and magnitude over the last two decades..."
Could Hybrid Nuclear Plants Help Stem Global Warming? Clean Technica has the story - here's the introduction: "
MIT's
Charles Forsberg has come up with an idea that might work to combine
nuclear energy generation with renewable energies in an effort to halt
the need for fossil fuels. The idea proposes combining a nuclear power
plant with another renewable energy system, which Forsberg argues "could
add up to much more than the sum of its parts..."
Is This The Most Anti-Science, Anti-Environmental TV Ad Ever? Who needs trees when you have Toys "R" Us? Here's an excerpt and video clip from
Huffington Post: "...
In
this ad, kids are loaded onto a school bus labeled "Meet the Trees
Foundation." The guide, under the guise of being "Ranger Brad" says,
"Today we're taking some kids on the best field trip they could wish
for." He then shows them some pictures of leaves, while the camera pans
around the bus at bored, tired, yawning kids. Then, surprise! He reveals
they are not going on a natural science field trip at all, but to...
Toys "R" Us! Celebration! Confetti littering the ground as the kids run
from the bus into the store! Free wild rumpus in the store playing with
whatever they want. Hooray!.."