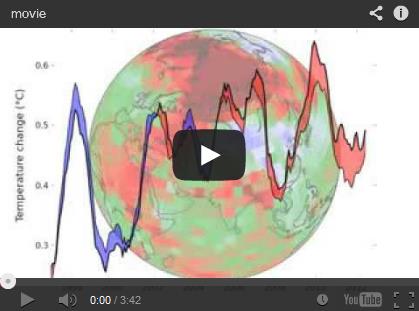
2013 Through September: 7th warmest year, worldwide, on record, as of late September. Source: World Meteorological Organization. Details below.
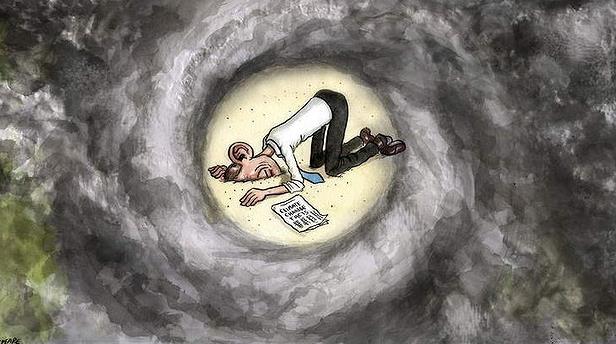
A Murky Crystal Ball
The WMO, The World Meteorological Organization, reports that 2013 is on track to be the 7th warmest on record, worldwide.
That's
all well and good, but winter in Minnesota has not been cancelled. Not
by a long shot. "If it ever gets to the point where it doesn't snow AT
ALL in Minnesota we'll have much bigger problems on our hands" a climate
scientist told me recently.
My wife asked me when we had snow on
the ground last year. Good question. Less than an inch of snow fell
during November, 2012. December made up for the slow start with a
whopping 15 inches; 10.5 inches falling on December 9, 2012.
I
still don't see any (Breaking News!) snow events looking out 2 weeks or
so. Rain is likely Saturday, a brief break Sunday before a second storm
arrives with more rain ; ending as snow Sunday night. A slushy half inch
or so is possible, but this does not look like The Big One.
We
chill down early next week, although it doesn't look as cold as it did a
few days ago. I see more 40s from late next week into the days
preceding Thanksgiving; a slight mild (Pacific) bias. Our (very)
experimental 45-day trend doesn't show snow on the ground until
Christmas.
That's more of a wish-cast than a forecast though.
A D.C. Detour
"Man plans. God laughs." Yep. Life rarely goes where you think it will go.
On
Tuesday I met with EPA Administrator Gina McCarthy, discussing
stewardship and creation care issues; climate change as a spiritual as
well as moral and scientific challenge. At the White House I talked
about communicating the science, and our efforts to launch companies
focused on adapting to a more volatile world of weather extremes.
NOAA
does a great job helping consumers deal with acts of God. But acts of
man, including carbon pollution? Coming soon: a new national database
showing impacts down to your zip code; how changes in weather patterns
are already affecting your hometown - and what the LONG range forecast
may bring. Because climate change doesn't hit home until it (literally)
hits home.
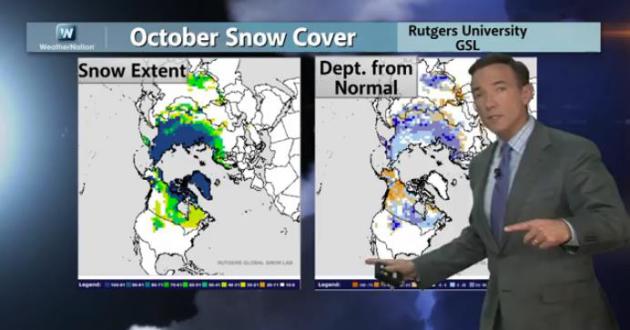
Want To Know The Winter Snowfall Totals? Keep An Eye On Siberian Snowcover.
Recent research seems to suggest that snowfall anomalies early in the
winter season over Siberia correlate with snowfall amounts over the USA,
especially eastern half of the USA. The system isn't perfect, but years
with excessive autumn snows in Siberia are often a tip-off of snowy
U.S. winters to come. That's the focus of today's edition of
Climate Matters: "
WeatherNationTV
Chief Meteorologist Paul Douglas shows the conditions that created snow
for parts of the Mid-Atlantic states. How confident is he in 45 day
wish casts? Not very. And what can we expect for our winter if Siberia
is seeing heavier than average snow?"
If New York Freezes In January Blame Siberian Snow Now.
Here are more details on the possible link between Siberian snowfall
anomalies and a negative phase of the AO, the Arctic Oscillation, a
blocking pattern that often favors colder winter weather east of the
Rockies. There's linkage, but the system isn't foolproof.
Bloomberg has the story; here's an excerpt: "...
The more ground covered by snow across northern Europe and Asia at the end of October, the greater the chances of triggering a phenomenon known as the negative phase of the Arctic Oscillation. That would flood North America, Europe and East Asia
with polar air and possibly erect a blocking effect in the North
Atlantic that would bottle up the cold in the U.S. In September, 2.36
million square kilometers (911,000 square miles) of northern Europe and
Asia were covered by snow, according to the Rutgers University Global
Snow Lab. That compared with the 1981-2010 mean of 1.5 million..."
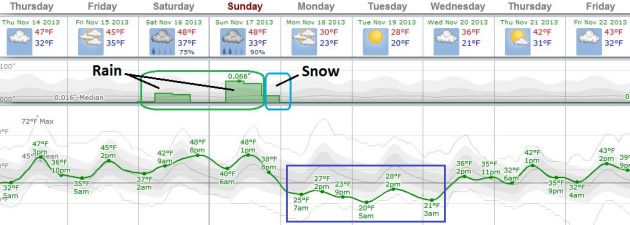
Weekend Puddles (Ending In Slush?) Here
is ECMWF guidance, showing 40s into Sunday, with a good chance of
weekend rain. A changeover to snow is likely Sunday evening and Sunday
night, from west to east across the state, and by Monday it will feel
like midwinter again. Numbing cold won't linger long: 2 cold days, then
some recovery into the 40s again the latter half of next week. Source:
Weatherspark.
7-Day Weather Map.
The loop above shows GFS wind and surface pressure data into Thursday
of next week; a major storm pushing rain into the Midwest and Great
Lakes by Saturday, ending as snow late Sunday and Sunday night. The
green-shaded areas show sustained 10-meter winds over 25-30 mph.
Animation: Ham Weather.
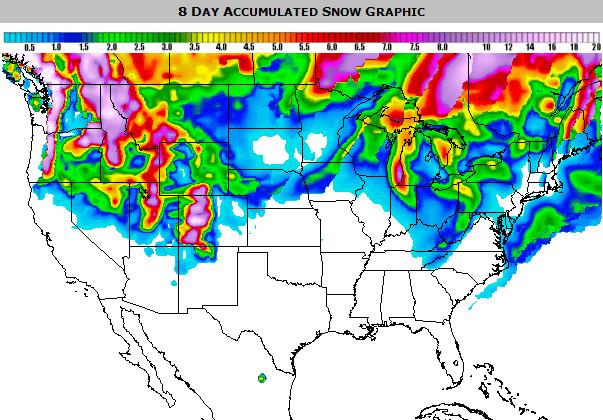
8 Day Snowfall Accumulations.
Here is NOAA's GFS solution (Kuchera method) showing expected snowfall
amounts looking out into Thursday of next week; heavy snow from Colorado
into the Pacific Northwest (highest elevations) - mostly lake effect
snows downwind of the Great Lakes, with a narrow band of a couple inches
from northern Iowa into southeast Minnesota and western Wisconsin from
Sunday night's changeover from rain to snow. Map: Ham Weather and Alerts
Broadcaster.
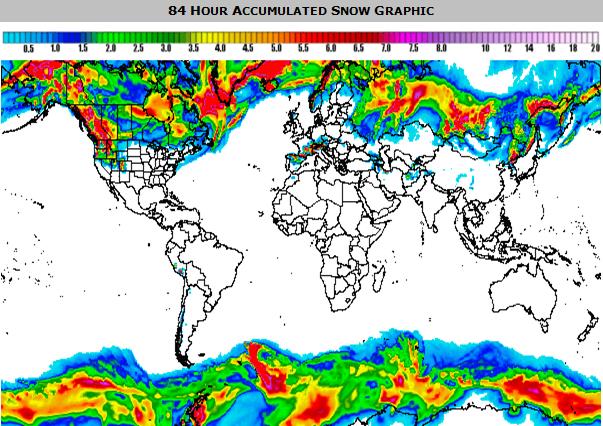
84 Hour Global Snowfall Product.
If you're interested in a larger perspective, here is GFS accumulated
snowfall going out 84 hours, showing heavy snows from Alaska into
western Canada, portions of the Alps and much of Russia. Map: NOAA and
Ham Weather/Alerts Broadcaster.
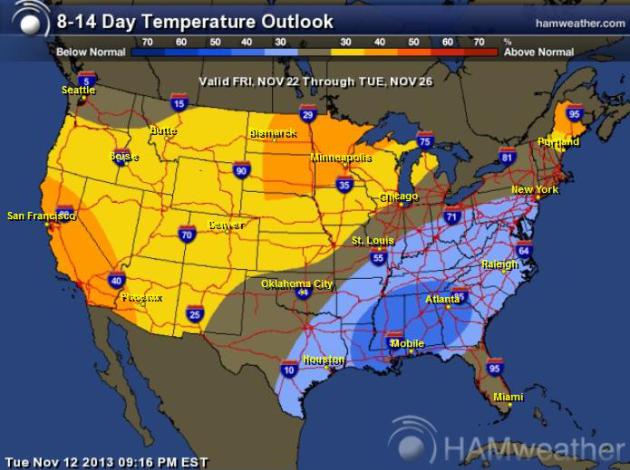
Mild Bias Into Fourth Week Of November?
That's what NOAA's Climate Prediction Center is forecasting for much of
the Upper Mississippi River Balley and the western USA, a cold bias for
the southeast. We'll see, but right now I don't see any (extended)
arctic outbreaks into Thanksgiving. Map: NOAA and
Ham Weather.
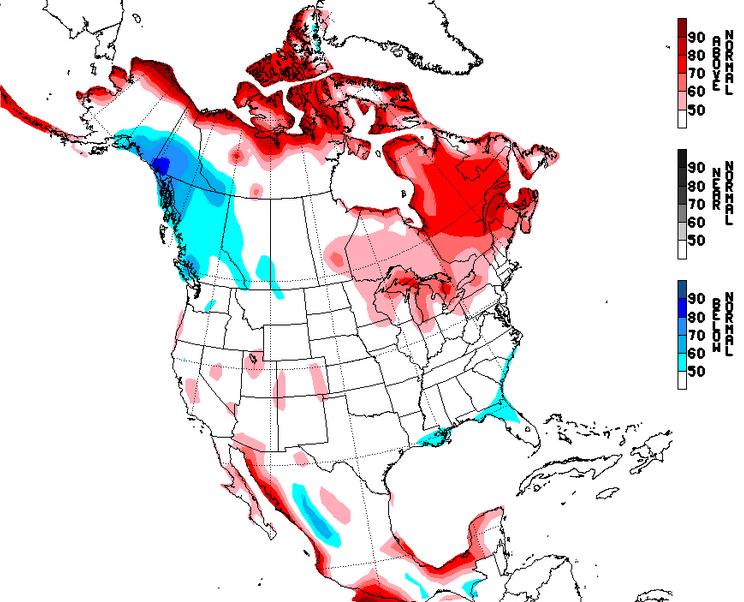 November 21 To 27 Temperature Anomalies
.
NOAA's NAEFS extended model shows a mild bias from eastern Minnesota
into much of northern and eastern Canada, temperatures across most of
America close to average for mid/late November.
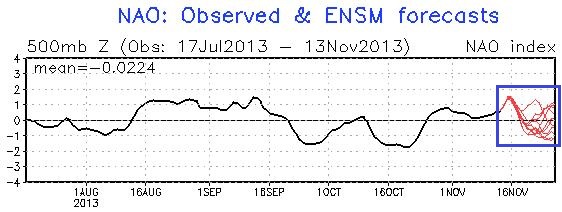
North Atlantic Oscillation Trends.
A strongly negative phase of the NAO usually correlates with colder
than average temperatures east of the Rockies. The ensemble shows a
fairly large spread in solutions, reducing confidence, but no
overwhelmingly negative signal that bitter days are brewing looking out
1-2 weeks. Graphic: NOAA CPC.
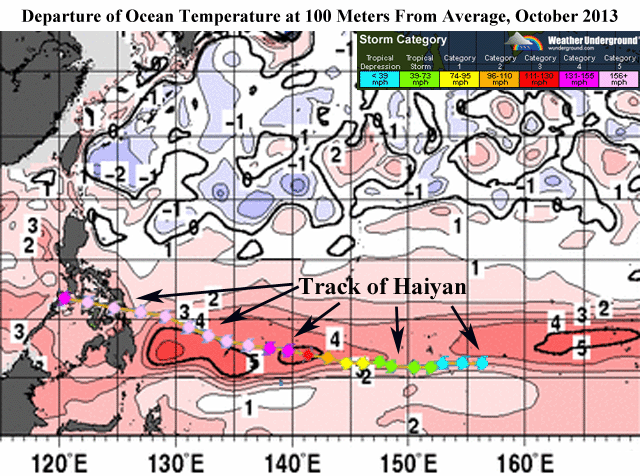 Why Was Typhoon Haiyan/Yolanda So Powerful, And Is This A Trend?
 Climate scientist Greg Laden takes a look at
scienceblogs.com; here's an excerpt: "...
But
here I want to look at one single factor that almost certainly
contributed to the growth of Haiyan/Yolanda into a very powerful storm, a
factor that probably doesn’t usually play into a storm’s strength. I
refer to an anomaly in sea surface temperatures that was almost
certainly caused by global warming, as part of a general warming of the
ocean. But first a bit of background on the link between sea surface
temperature and hurricanes. This is one of several factors that may be
involved in climate change related effects on tropical storm intensity, a situation with which we should be concerned. Tropical cyclones run on heat, and much of that heat comes from the sea surface..."
Graphic above: Dr. Jeff Masters,
Weather Underground. Graphic credit: "
Departure
of temperature from average at a depth of 100 meters in the West
Pacific Ocean during October 2013, compared to a 1986 - 2008 average.
The track and intensity of Super Typhoon Haiyan are overlaid. Haiyan
passed directly over large areas of sub-surface water that were 4 - 5°C
above average in temperature, which likely contributed to the storm's
explosive deepening." Image credit: Japan Meteorological Agency.
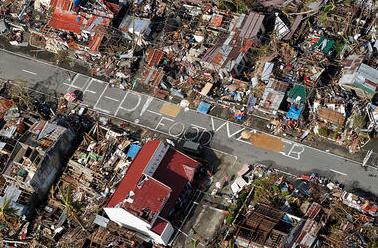
Typhoon Haiyan: How You Can Donate. Here's an excerpt from an extensive list of approved charities from Christian Science Monitor:
1. The
International Committee of the Red Cross and the
Philippine Red Cross are accepting
donations and coordinating disaster relief on location. Follow the Philippine Red Cross
on Facebook and
Twitter for updates.
2.
World Food Program, which delivers emergency food aid, is accepting
donations online and through
PayPal.
3.
UNICEF Philippines is accepting
donations online to provide children affected by the typhoon with drinkable water, hygiene supplies, food and shelter.
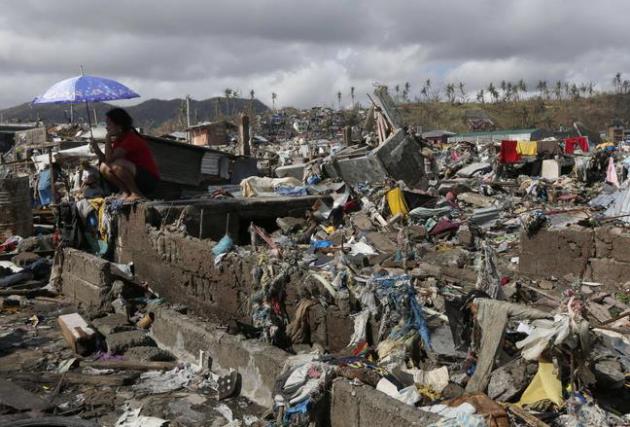
Photo credit above: "An
aerial view shows signs for help and food amid the destruction left
from Typhoon Haiyan in the coastal town of Tanawan, central Philippines,
Wednesday, Nov. 13, 2013. Typhoon Haiyan, one of the strongest storms
on record, slammed into six central Philippine islands on Friday leaving
a wide swath of destruction and thousands of people dead." Wally Santana/AP.
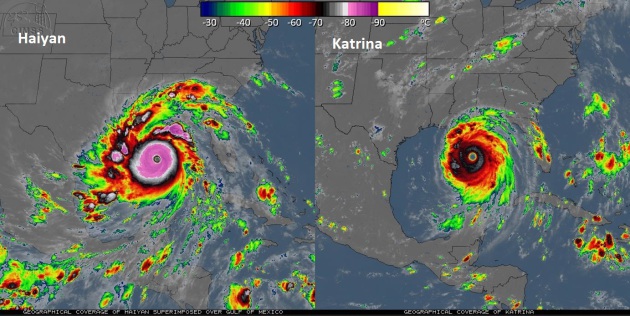
Side By Side Comparison. No, there is no Category 5 hurricane in the Gulf of Mexico.
CIMSS
at the University of Wisconsin-Madison did a comparison, showing much
colder temperatures with Haiyan before landfall. Most of this can be
attributed to a higher (colder) tropopause over the tropics vs. the Gulf
of Mexico, but the differences are still pretty striking.
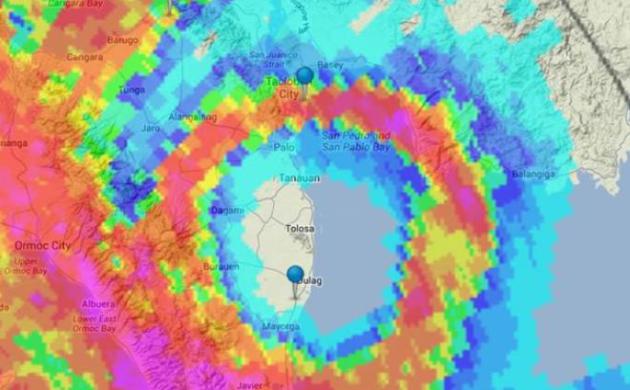
Chaser Team Documents Abrupt, Violent Onset Of Destructive Typhoon In Tacloban.
Here are more eye-opening details about a team on the ground close to
where Super Typhoon Haiyan came ashore in the Philippines, courtesy of
meteorologist Jason Samenow at
The Capital Weather Gang:
"The iCyclone chase team, which earned fame by sharing with the world
harrowing first-hand accounts of Super Typhoon Haiyan in Tacloban, has
published the data it recorded during the storm. It reveals a storm that
struck with sudden and excessive force and that, despite its short
duration, overwhelmed and ultimately destroyed much of the Philippine
city. Haiyan’s storm surge “rose very suddenly and rapidly” and was
estimated by the team – consisting of Josh Morgerman, James Reynolds,
and Mark Thomas – to be between 20 and 30 feet high.
Image credit above: "
Radar showing northern eyewall of Super Typhoon Haiyan passing through Tacloban at 7 a.m. local time on November 8." (iCyclone).
When Haiyan Struck. Here's an excerpt of another harrowing tale, this time from
The New Yorker: "
On
November 8th, after Typhoon Haiyan hit, Helen Merino, a
forty-four-year-old housemaid in Manila, tried to reach her parents in
rural Barangay Tolingon, part of Isabel municipality in Leyte province.
All power and communication lines were down, but somehow Facebook was
accessible—not for nothing is the Philippines known as the world’s
social-media capital. That evening, a cousin messaged Helen’s son on
Facebook and posted a picture of a tree that had crushed her parents’
house. But they were alive—they had taken refuge in a school that had
been turned into an evacuation center. The school’s roof had been blown
off..."
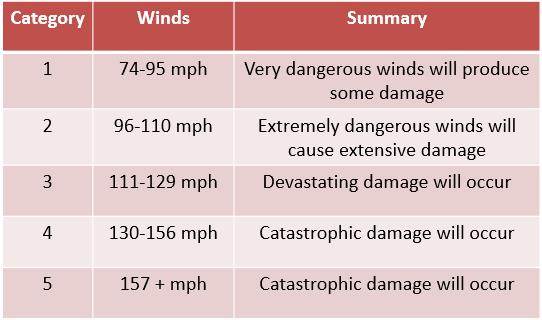
Should The Saffir-Simpson Scale Go Beyond 5?
This question is getting a lot of play among meteorologists and climate
scientists right now, in light of "Haiyan". Here's an excerpt of a post
at
scienceblogs.com: "
This is just a quick post to suggest an answer to the question posed by Greg Laden here: should we have a category 6 and above for hurricanes.
My answer is no. I say this in agreement with many of the points
expressed in Greg’s post, mainly that category 5 basically means total
destruction and for all practical purposes what is the difference
between flattened like a dirt road or flattened like a paved one? But
in acknowledgment of the other arguments and points of view, I would
suggest further categories into the higher wind speeds in the form of
Category 5A, 5B, 5C etc. It seems to me this would satisfy all concerns
on both sides with regard to distinguishing between increasing extremes
of measured wind speeds and not diluting the “run for your life”
message category 5 is supposed to deliver..."
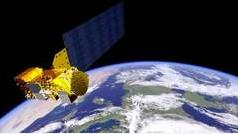 NASA Study May Help Predict Major West Coast Snow Falls
.
Climatescience.com has an interesting story - here's the intro: "
Atmospheric
rivers - short-lived wind tunnels that carry water vapor from tropical
oceans to mid-latitude land areas - are prolific producers of rain and
snow on California's Sierra Nevada mountains. The finding, published in
the journal Water Resources Research, has major implications for water
management in the West, where Sierra runoff is used for drinking water,
agriculture and hydropower. The research team studied how two of the
most common atmospheric circulation patterns in the Northern Hemisphere
interact with atmospheric rivers. They found when those patterns line up
in a certain way, they create a virtual freeway that leads the
moisture-laden winds straight to the Sierras..."
Image credit above: "
Launched
into Earth-orbit on May 4, 2002, on board the Aqua satellite
(pictured), the Atmospheric Infrared Sounder, AIRS, moves climate
research and weather prediction into the 21st century. AIRS is one of
six instruments on board the Aqua satellite, part of the NASA Earth
Observing System. AIRS along with its partner microwave instrument,
Advanced Microwave Sounding Unit (AMSU-A), represents the most advanced
atmospheric sounding system ever deployed in space. Together these
instruments observe the global water and energy cycles, climate
variation and trends, and the response of the climate system to
increased greenhouse gases."
7th Warmest Year On Record, To Date. This is for the period January through September, 2013; details from the WMO,
The World Meteorological Organization: "
The
year 2013 is currently on course to be among the top ten warmest years
since modern records began in 1850, according to the World
Meteorological Organization. The first nine months, January to
September, tied with 2003 as the seventh warmest such period on record,
with a global land and ocean surface temperature of about 0.48 C (0.86
F) above the 1961-1990 average..."
* The Guardian has more details
here.
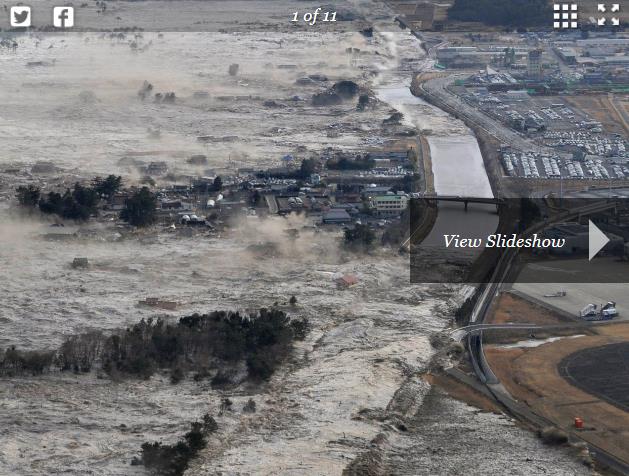
The Decade's Deadliest Natural Disasters.
Salon has a slide show highlighting the biggest disasters, worldwide. Here's the credit for the image above: AP/Kyodo News. "
March
11, 2011: A magnitude-9.0 earthquake off northeastern Japan causes a
tsunami that sweeps onto the coast. About 19,000 people are killed and
three nuclear reactors melt at the Fukushima Dai-ichi power plant."
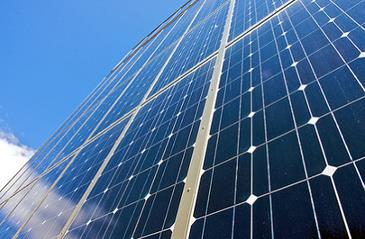
Solar Power Begins To Shine As Environmental Benefits Pay Off.
The New York Times has the story; here's a clip: "...
Solar
photovoltaic generation, known as PV, like wind power before it, is
coming into the mainstream — at great environmental benefit. Based on
comparative life-cycle analyses of power sources, “PV electricity
contributes 96 percent to 98 percent less greenhouse gases than
electricity generated from 100 percent coal and 92 percent to 96 percent
less greenhouse gases than the European electricity mix,” said Carol
Olson, a researcher at the Energy Research Center of the Netherlands..."
Xcel, Advocates At Odds Over Minnesota Solar Garden Rules.
Midwest Energy News has the story - here's the intro: "
As
customers begin putting money down to join one of Minnesota’s first
community solar gardens, new comments to state regulators reveal
significant disagreements about how the program should work. A new state law
requires Xcel Energy to develop a program that will allow customers to
buy shares of power produced at nearby solar installations, known as
community solar gardens. The idea is to make solar power accessible to
the majority of Minnesotans who either don’t own their home or have a
rooftop that isn’t sunny enough, strong enough, or angled correctly for
installing solar panels..."
Photo credit above: Mike Baker via Creative Commons.
Nuclear Power Can Save America From An "Energy Cliff". Here's the intro to an Op-Ed at
CNN: "...
America
is heading toward an energy cliff in the next 20 years, and the impacts
could be much worse than those of the recent recession. Simply put, we
cannot keep out of economic downturn without a readily available supply
of clean and abundant energy -- from sources that are affordable,
scalable to meet long-term demand and that do not compound the problem
of global climate change. CNN Films' documentary "Pandora's Promise" correctly suggests that nuclear power is the safest, most stable and most secure option for achieving that goal..."
Photo credit: CNN. "Roderick: While the building of U.S. nuclear reactors slowed, the world increased its nuclear fleet to more than 430 reactors."
A Giant Inflatable Plug To Keep Our Subways Dry During Storms.
Fast Company Co.Exist/Ideas has the remarkable story out of New York City (in light of Sandy's destruction). Here's an excerpt: "...T
he
MTA is now looking at a more robust and deployable solution: An
enormous tunnel-engorging plug. The Resilient Tunnel Plug (RTP), to give
it its formal title, is being developed by the firm ILC Dover
in Delaware, with help from the Department of Homeland Security. ILC
demonstrated it twice this year at New York's South Ferry station (see
images). And it's now making its first full installation (though the
location is secret "for security reasons"). The RTF, which is taller
than a double-decker bus, has three layers. On the outside is a woven
fabric layer composed of strips roughly the width of a seatbelt..."
Photo credit above: "The Resilient Tunnel Plug fills up a subway tunnel to prevent water from getting in."
A 100 Year Forecast Is Harder Than It Looks. Here's a clip from a fascinating story at
Gizmodo: "...
The
January 6, 1910 Cedar Rapids Evening Gazette in Iowa published a list
of things that they believed humanity would achieve during the
century...The complete list from the Cedar Rapids Evening Gazette
appears below, strange grammar and all.
- Cure for cancer.
- Discovery south pole.
- Prevent or cure insanity.
- Influence sex by parental treatment.
- Create living organisms by artificial means.
- Phonograph records substitute for letter..."
Free Life Advice: Marry A "Modern Family" Fan.
Yes, advertisers and programmers can estimate household income based on
the shows you watch on a routine basis. Good grief. Glad I watch so
much PBS. Sesame Street, mostly. Here's an excerpt from
The Wrap: "
The
Dunphys of “Modern Family” might not eat at “Bob’s Burgers” — and fans
of the shows might not eat at the same restaurants, either. The two
comedies are at opposite ends of the spectrum in terms of their average
viewers’ median incomes. The median “Modern Family” viewer in the 18-49
demographic rakes in $81,100 annually, according to Nielsen data. “Bob’s
Burgers” watchers in the demo, on the other hand, earn around $48,000
per year..."
NBC To Televise First Virgin Galactic Commercial Flight.
Have an extra 250K sitting around burning a hole in your pocket? Prices
will come down, but yes, this is definitely on my bucket list. Details
from Gizmag: "
NBCUniversal has signed an exclusive partnership with
Sir Richard Branson’s Virgin Galactic to televise the space tourism
company's first commercial passenger flight. Expected to take place next
August, the flight will covered in a special three-hour edition of the
US NBC network's Today program. Aboard the VSS Enterprise, will be Sir Richard, age 63, and his children, Holly, 31, and Sam, 28. The other passengers and crew have not yet been named..."

Video: The First Flying Car Goes On Sale In 2015 - Can Take Off Vertically In Traffic Jam! One word response. Damn.
Shock Mansion and Reuters have the must-see video; here's an excerpt: "
The
first flying cars are set to go on sale to the public as early as 2015.
Terrafugia has announced its Transition design, which is part sedan,
part private jet with two seats, four wheels and wings that fold up so
it can be driven like a car, will be on sale in less than two years. The
Massachusetts-based firm has also unveiled plans for a TF-X model that
will be small enough to fit in a garage, and won’t need a runway to take
off. Would you buy one?"
* photo above: Steve Burns.
Climate Stories...
Global Warming Since 1997 Underestimated By Half. About that alleged "pause" in warming.
Real Climate has today's top climate news headline - here's an excerpt of their story: "
A new study
by British and Canadian researchers shows that the global temperature
rise of the past 15 years has been greatly underestimated. The reason is
the data gaps in the weather station network, especially in the Arctic.
If you fill these data gaps using satellite measurements, the
warming trend is more than doubled in the widely used HadCRUT4 data, and
the much-discussed “warming pause” has virtually disappeared.
Obtaining the globally averaged temperature from weather station data
has a well-known problem: there are some gaps in the data, especially in
the polar regions and in parts of Africa. As long as the regions not
covered warm up like the rest of the world, that does not change the
global temperature curve..."
The Disappearing Hiatus. Michael Tobis has more on this thread at
Planet 3.0; here's an excerpt: "...
Indeed, the conclusions allude to this:
While
short term trends are generally treated with a suitable level of
caution by specialists in the field, they feature significantly in the
public discourse on climate change.
There’s
another aspect to this, though, and it may be a bigger deal than might
at first be apparent. It adds up to a pretty scary situation. That’s
because the “slowdown” or “hiatus” has also had a number of alternative
explanations. Decreased solar activity. Increased volcanic activity. A
prevalence of cool-phase El Nino oscillations. Increase in aerosol
loading from rapid and dirty Chinese industrial expansion. Heat export
to deeper ocean layers..."
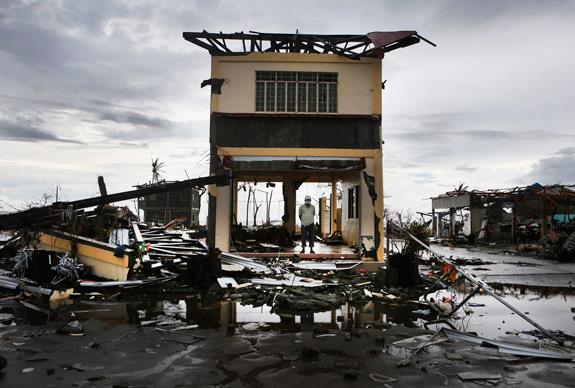
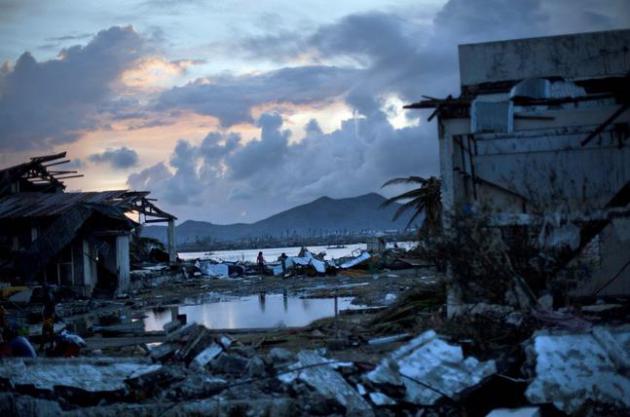
Typhoon Haiyan Influenced By Climate Change, Scientists Say.
A warmer Pacific Ocean didn't spark the storm, but a deep layer of
unusually warm water may have made the storm worse, as detailed in this
story at
The Sydney Morning Herald; here's an excerpt: "...
Professor
Will Steffen, a researcher at the ANU and member of the Climate
Council, said scientists understand how a hotter, moister climate is
already affecting storms such as Haiyan. “Once [cyclones] do form, they
get most of their energy from the surface waters of the ocean,”
Professor Steffen said. “We know sea-surface temperatures are warming
pretty much around the planet, so that's a pretty direct influence of
climate change on the nature of the storm.” Data compiled from the US
National Oceanic and Atmospheric Administration shows sea temperatures
were about 0.5 to 1 degree above normal in the waters to the east of the
Philippines as Haiyan began forming. The waters cooled in the storm's
wake, an indication of how the storm sucked up energy..."
Photo credit above: "
A
survivor sits among debris in the typhoon ravaged city of Tacloban,
Leyte province, central Philippines on Wednesday, Nov. 13, 2013. Typhoon
Haiyan, one of the strongest storms on record, slammed into several
central Philippine provinces Friday, leaving a wide swath of destruction
and thousands of people dead." (AP Photo/Vincent Yu).
Update: Super Typhoons And Global Warming. Here's a clip from a story at
Slate that caught my eye: "...
After I posted my article, climatologist Michael Mann pointed out a paper
written in 2008 that does in fact show that top wind speeds in the
strongest cyclones have increased in recent times. The paper is titled,
“The increasing intensity of the strongest tropical cyclones”, and the
very first line is this:
“Atlantic
tropical cyclones are getting stronger on average, with a 30-year trend
that has been related to an increase in ocean temperatures over the
Atlantic Ocean and elsewhere.”
That seems pretty clear*.
They found that in the strongest cyclones, the maximum wind speeds have
risen by about 29 kilometers per hour (18 mph) over the period of 1981 –
2006, a substantial amount..."
Photo credit above: "
Typhoon
Haiyan" survivors walk through the ruins of their neighborhood on the
outskirts of Tacloban, central Philippines on Wednesday, Nov. 13, 2013.
Typhoon Haiyan, one of the most powerful storms on record, hit the
country's eastern seaboard on Friday, destroying tens of thousands of
buildings and displacing hundreds of thousands of people." (AP Photo/David Guttenfelder).
Climate Change: When Ignorance Is A Recipe For Disaster.
Even if warmer oceans aren't triggering more numerous or more intense
typhoons and hurricanes, rising sea levels are increasing the potential
for coastal damage, argues this article at Australia's
The Age. Here's an excerpt: "...
But
that's not the end of the story. Climate change might not have made
cyclones more frequent or more intense. But it is having other effects
that threaten to be force multipliers for cyclones. The IPCC report
again: ''It is very likely that mean sea-level rise will contribute to
upward trends in extreme coastal high water levels in the future … There
is high confidence that locations currently experiencing adverse
impacts such as coastal erosion and inundation will continue to do so in
the future due to increasing sea levels, all other contributing factors
being equal. ''The very likely contribution of mean sea-level rise to
increased extreme coastal high water levels, coupled with the likely
increase in tropical cyclone maximum wind speed, is a specific issue for
tropical small island states...''
Illustration above: John Shakespeare.
How Climate Change Will Affect The Southeast USA. Here's an excerpt from
USA Today: "
Rising
sea levels, warming temperatures, heat waves, worsening air quality and
stresses on the water supply are issues the Southeast will face over
the next 20 years because of man-made climate change, according to a
report released Tuesday. "The Southeast is a key part of the problem,"
said Keith Ingram, director of the Southeast Climate Consortium and a
professor at the University of Florida. "With 26% of the total
population of the U.S. living there, the region emits 25% of the
country's total carbon dioxide emissions..."
Image credit: NASA.
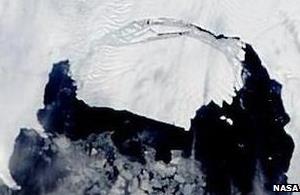
Vast Antarctic Ice Berg "Could Threaten Shipping". Here's an excerpt from a story at
The BBC: "
UK
researchers have been awarded an emergency grant to track a vast
iceberg in Antarctica that could enter shipping lanes. Latest images
show several kilometres of water between the iceberg, estimated to be
about 700 sq km (270 sq miles), and the glacier that spawned the block.
The £50,000 award will fund a six-month project that will also predict
its movement through the Southern Ocean. The icy giant broke away from
the Pine Island Glacier (PIG) in July..."
Image credit above: "
UK researchers will closely monitor the movement of the iceberg as it travels through the Southern Ocean."
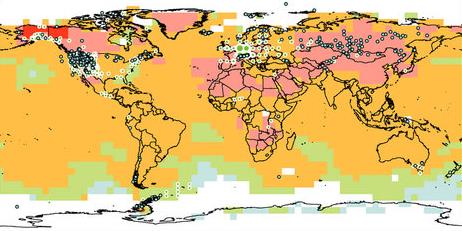
The Inequality Of Climate Change. Here's a clip from a story at the Economix Blog at
The New York Times: "...
That
is the firmly established view of numerous national governments,
development and aid groups and the United Nations as well. “It is the
poorest of the poor in the world, and this includes poor people even in
prosperous societies, who are going to be the worst hit,” said Rajenda
Pachauri of the Intergovernmental Panel on Climate Change, speaking to reporters in Brussels back in 2007. The reason is twofold. First is the geography of climate change itself. The higher the latitude, the bigger the temperature increase.
And generally, the farther from the equator, the wealthier the country —
meaning rich countries like Norway and Canada might see a
disproportionate impact from global warming..."
Image credit above: "
Changes in physical and biological systems and surface temperature, 1970-2004." Source: Intergovernmental Panel on Climate Change.
Three-Foot Higher Sea Levels Could Flood $156 Billion Of Florida's Real Estate.
Quartz has the story; here's the introduction: "
Florida’s
1,197-mile (1,926 km) long coast line has long been some of the hottest
real estate in the country for retirees and beach lovers. Billions
worth of those homes are likely to soon be underwater—and not in the
real estate sense. “$76 billion of Florida property sits on land less than two feet [0.6 meters] above the high tide line,” says a recent report (pdf)
co-authored by Climate Central, a group of scientists. ”Within less
than the term of a 30-year mortgage, sea level rise could cause floods
this high to occur once every five years, or even every year, depending
on location within the state...”
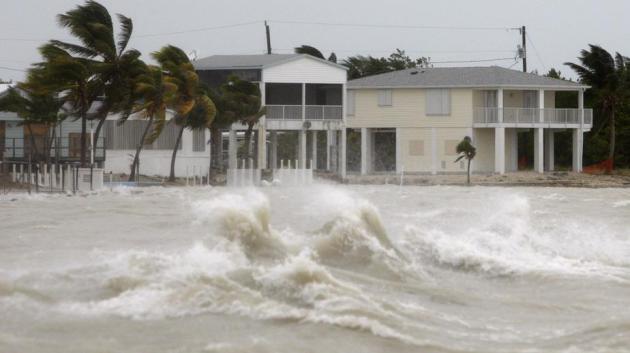
Photo credit above: "Some coveted Key West property." Reuters/Carlos Barria.
Climate Change Opens Door To Forest Pests New To Great Lakes. A few degrees warmer sounds pretty good, until you realize that (new) pests like the warmth too.
The Great Lakes Echo has the story; here's an excerpt: "...
It’s
a phenomenon not confined to webworms and honeylocust trees as the
Earth’s temperature rises and the variability of climate increases.
Climate change will increase the frequency of droughts, increase the
severity of snow/rain storms and make frosts occur later, said Sophan
Chhin, assistant professor in the department of forestry at Michigan
State University. As climate changes and growing seasons are
interrupted by drought and frost, trees are preoccupied with regaining
their strength and become more vulnerable to insects and disease..."
Photo credit above: "
The changing climate upsets can leave trees vulnerable to harmful insects like the pine beetle." Photo: USDA Forest Service.
A Fortune Made Of Sand: How Climate Change Is Destroying Cancun.
GlobalPost has the story; here's a clip: "...
Cancun’s
perfect tropical beach is its principal selling point. Made from the
remains of long-dead corals, it famously stays cool even on the most
scorching days. Yet the only reason the resort still has a beach is
thanks to a $70 million project in 2010 to replenish it by dredging up
more than 1 billion gallons of sand from the seabed. That was a response
to the devastation wrought by Hurricane Wilma
in 2005, which overnight swept away eight miles of Cancun’s prime
beach. Although scientists are wary of attributing specific weather
events to climate change, most agree that warming seas in the Caribbean
have already made devastating hurricanes like Wilma — not to mention
Katrina and Sandy which respectively ravaged New Orleans and New York —
increasingly frequent..."
Peru Uses Climate Twist To Lure Tourists To Shrinking Glacier. Here's an excerpt of a story from
Reuters: "
In
its heyday, the Pastoruri glacier in central Peru, drew daily throngs
of tourists packed into dozens of double-decker buses 16,000-feet
(5,0000-meters) high into the Andes to ski, build snowmen and scale its
dizzying peaks. It was so bright with ice and snow that sunglasses were mandatory.
But in less than 20 years, including at least 10 of the hottest on
record, Pastoruri has shrunk in half, and now spans just a third of a
square mile (0.9 square km)..."


