Low Expectations
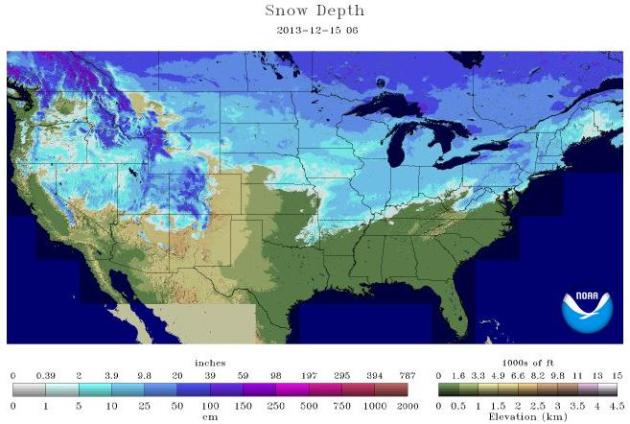
NOAA
reports 53 percent of the contiguous USA had snow on the ground as of
December 15, the most in 11 years. No need to worry about a white
Christmas this year.
I'm looking forward to removing a few extra
layers of clothing Wednesday, as highs "surge" into the 30s. A chilly
weekend gives way to another potential thaw Christmas Eve, then colder
Christmas Day. A clipper drops another inch of fluff on your favorite
freeway this morning. Leave a little extra time.
It's human nature
to wonder & worry about what comes next. "Is it going to be this
miserable all winter?" Based on numerous factors, including a positive
phase of the Arctic Oscillation and a brewing El Nino for 2014 I think
there's a very good chance January may wind up a little milder than
December.
Winter came on with a vengeance. The January Thaw will
also come early, and if I had to bet I'd go with an early spring in
2014. Snowfall? Close to normal, around 55 inches.
That's based more on intuition and gut feel vs. hard science, but I do see a little relief from The Numb in coming weeks.
December is 11F colder than average; 6 subzero nights so far this month. But it's not necessarily a taste of what's to come.
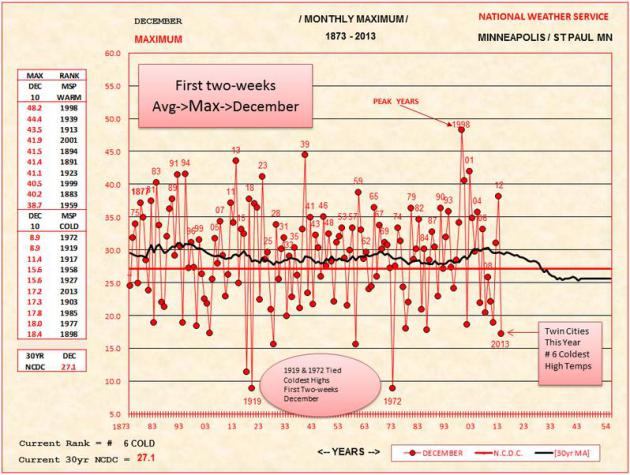
First Half of December: 6th Coldest High Temperatures Since 1873. A cold start to the month? No question about that. According to the
Twin Cities National Weather Service
the first half of the month featured an average daytime high (max) of
17.2F, the 6th coldest first half of December on record. Nighttime lows
averaged 5F, the 21st coldest first half of December since 1873.
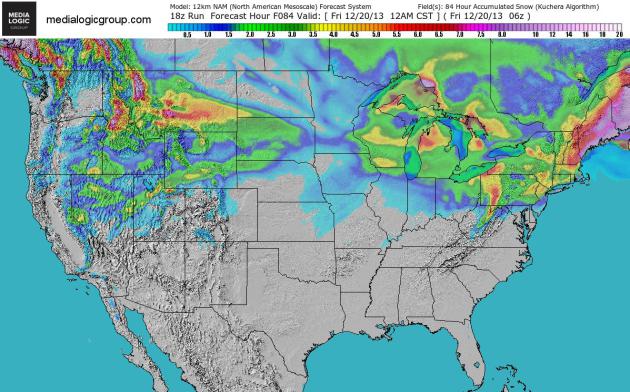
84-Hour Snowfall Prediction.
An especially strong Alberta Clipper whips up a few inches of snow
today from Pennsylvania into much of New England, maybe a couple of
sloppy inches for the suburbs of New York City and Boston. 84 hour NAM
snowfall prediction courtesy of NOAA and Ham Weather.
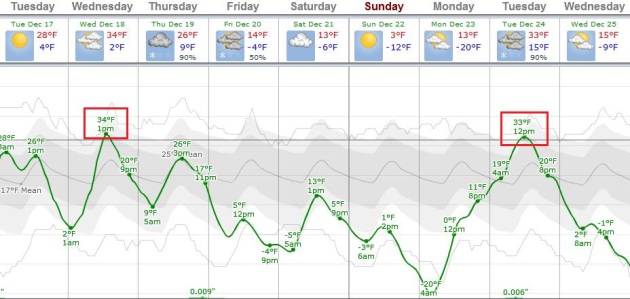
Big Swings.
With these fast-moving Alberta Clippers you can see 30-35 degree
temperature swings in the span of 36 hours or less. We enjoy 20s today
(where else but Minnesota would you see THAT in a sentence) and 30s
tomorrow before another late-week relapse. Another thaw is possible
Christmas Eve, based on ECMWF data. Source: Weatherspark.
Hints of Moderation.
We're due for a major shift in the pattern, and it's on the way,
especially for the eastern third of the USA by late week and next
weekend. The coldest subzero air (solid green line) brushes New England
before lifting north into Quebec, the 32F isotherm on the move
(northward for a change). 2-meter NAM predicted temperatures from NOAA
and Ham Weather.
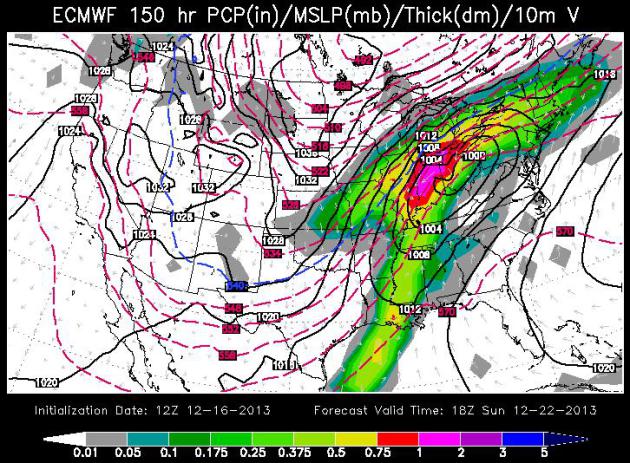
Major Sunday Snowfall Kansas City to Chicago?
It's still early for specifics, but the next surge of numbing air may
spin up a significant storm tracking from the Mississippi Valley into
the Ohio Valley over the weekend, pulling moisture from the Gulf of
Mexico into the Great Lakes, where low-level temperatures may be cold
enough for heavy wet snow. Meanwhile, out ahead of the storm, a surge of
southern warmth boosts the mercury into the 50s, 60s and 70s. Midday
Sunday ECMWF outlook: WSI Corporation.
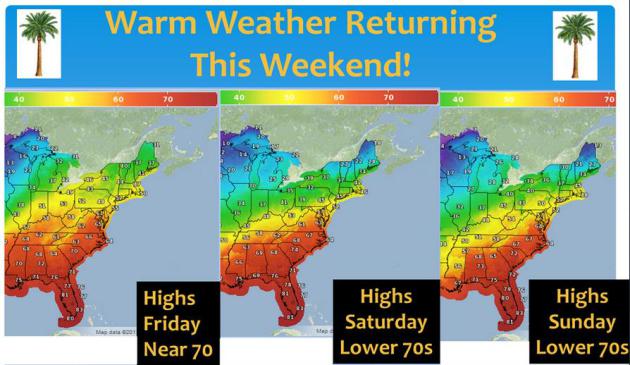
January Thaw Comes Early.
By the weekend 70s may push as far north as Richmond, even Washington
D.C., with 60s into the Delaware Valley, 50-degree highs from New York
City to Boston. A far cry from heavy, wind-whipped snow. Source:
Wilmington, North Carolina National Weather Service.
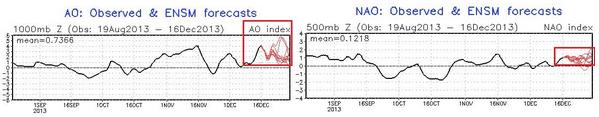
Pattern Shift?
I want to see a few more model runs and get a better sense of whether
this is a fluke or a true trend, but a positive phase of both the AO
(Arctic Oscillation) and NAO (North Atlantic Oscillation) could mean
more of a Pacific influence across much of the USA as we end December.
We're due for a thaw. Source: NOAA.
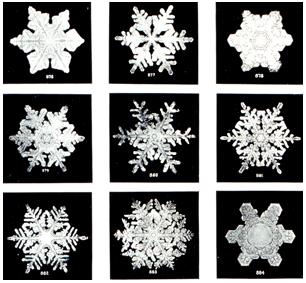
How Do Snowflakes Form? Here's an excerpt of a detailed explanation from
NOAA: "
A
snowflake begins to form when an extremely cold water droplet freezes
onto a pollen or dust particle in the sky. This creates an ice crystal.
As the ice crystal falls to the ground, water vapor freezes onto the
primary crystal, building new crystals – the six arms of the snowflake.
That’s the short answer. The more complex explanation is this: These ice
crystals that make up snowflakes are symmetrical (or patterned) because
they reflect the internal order of the crystal’s water molecules as
they arrange themselves in predetermined spaces (known as
“crystallization”) to form a six-sided snowflake. Ultimately, it is the
temperature at which a crystal forms — and to a lesser extent the
humidity of the air — that determines the basic shape of the ice
crystal. Thus, we see long needle-like crystals at 23 degrees F and very
flat plate-like crystals at 5 degrees F..."
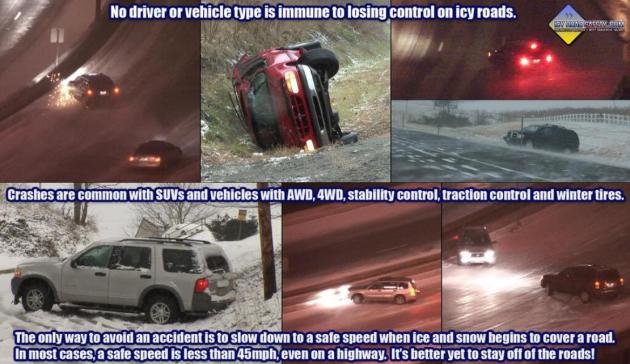
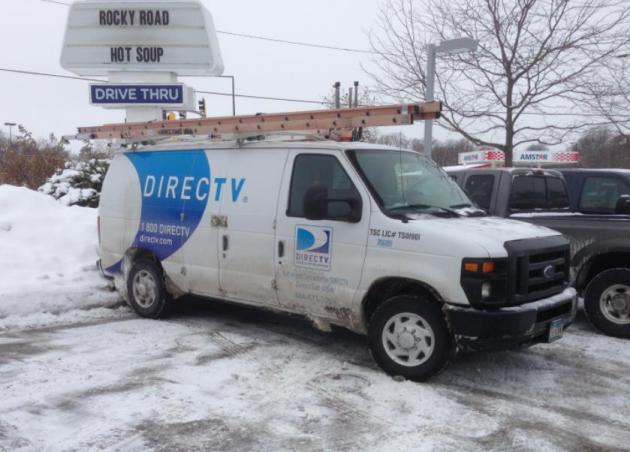
Testing The Laws of Physics.
It's ironic, but I've noticed a trend in recent years: SUV's are some
of the first vehicles to wind up in area ditches or fender-benders when
the flakes are flying. Sitting up high, and having AWD gives a (false)
sense of security. Nothing is going to help if you hit a patch of black
ice - the only thing you can do is slow down. Graphic:
icyroadsafety.com.
Mobile Apps Will Transform All Business Processes - Is Your Company Ready? Here's a snippet of an interesting story at
LinkedIn: "...
So,
what does all this mean for your business? It means that mobile apps
designed by businesses for their internal use and competitive advantage
will explode over the next two years. Therefore, all business leaders
need to ask themselves: “Two years from now, do I want to be one of the
companies that is not developing mobile apps to transform business
processes?” Once you see the hard trends driving this software
revolution, it would be hard to answer “no.” Remember, a hard trend will
happen; a soft trend might happen. The hard trend is that businesses
will be developing mobile apps customized for their company for various
functions. The soft trend is whether your company will be one of them..."
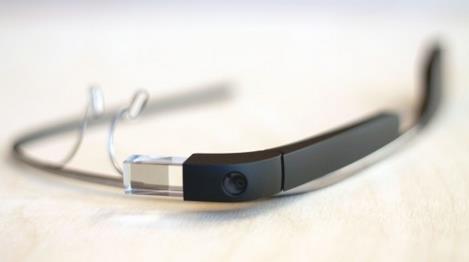
Google Glass: Early Impressions. This is all I want for Christmas, although I'm still not exactly sure what I'd do with them, other than look even dorkier. But
gizmag.com is here to help me understand why this has the potential to change my life: "
Most companies conduct their experiments behind closed doors. If, say, a new iPhone
hits store shelves, then chances are the dirty work has been done and
it's already pretty polished. But Google is very different, sometimes
letting the public join in on the beta testing fun. Gizmag recently
joined Google's US$1,500 smartglasses beta program, and though we're still a ways off from a full Google Glass review, these are our early impressions..."
KARE-11 Anchor Diana Pierce Featured In "Jeopardy!" Clue. Congrats to Diana - this couldn't happen to a nicer person. Details and video clip via
TVSpy: "
KARE anchor Diana Pierce
was featured in on Friday’s episode of “Jeopardy!” in the form of a
clue: “Diana Pierce anchors the news on KARE in this city, a lot better
than Ted Baxter did at fictional WJM.” Contestants guessed Cincinnati
and Chicago before settling on the correct answer, Minneapolis. “30 years at KARE and I become a Jeopardy question? Too funny!” Pierce tweeted after the show aired."
Top 10 Things You CAN'T Have For Christmas 2013.
Gizmag has the list and they're checking it twice - here's an excerpt: "
Luxury,
so they say, comes at a price, but in the world of innovation and new
technology, things can sometimes get way out of hand. It's with this in
mind that each year we compile a list of the most expensive, ambitious
and completely over-the-top products and ideas that have crossed our
desk in the past 12 months. So from the praiseworthy to the
preposterous, here's Gizmag's list of the top 10 things you won't be
getting for Christmas in 2013..."
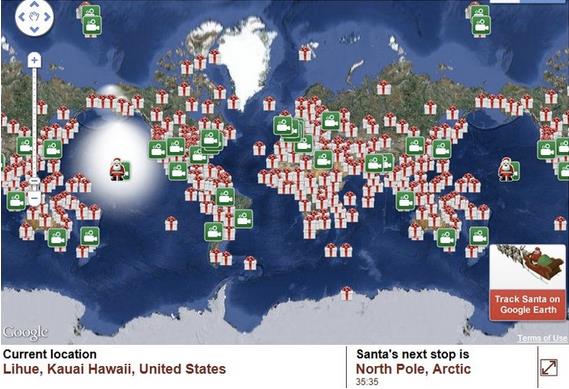
NORAD Tracks Santa's Path On Christmas Eve Because Of A Typo.
WHY does NORAD track Santa Claus, you may be wondering? Great question.
I love this story - amazing but true, brought to you by
The Atlantic; here's the intro: "
It was 1955, and Christmas was approaching, and Sears had a new idea for a yuletide gimmick.
In local newspapers, the department store placed ads ... on behalf
of Santa himself. "HEY KIDDIES!" the ad read, in a greeting that would
seem creepy only in retrospect. "Call me on my private phone and I will
talk to you personally any time day or night." The ads then listed local
numbers for area children to call to get some one-on-one Kris Kringle
time..."
Climate Stories...
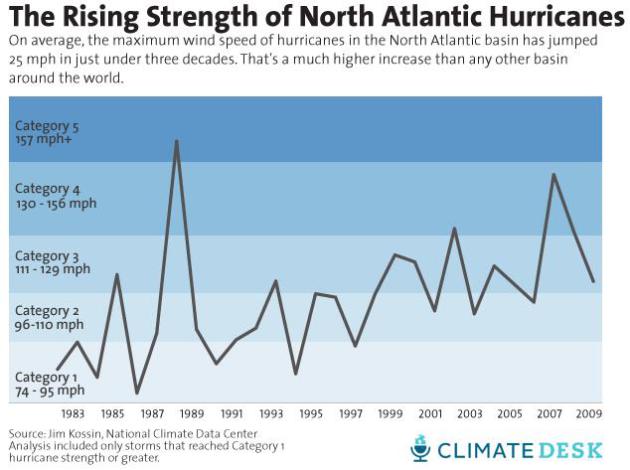
Are Hurricanes Getting Stronger? Science May Finally Be Approaching An Answer.
Mother Jones has a very interesting article that caught my eye - here's an excerpt: "...
The
result? The scientists found that globally, hurricane wind speeds are
increasing at a rate of a little more than two miles per hour per
decade, or just faster than six miles per hour over the entire period.
There are some key caveats, though, the biggest being that the trend
they found was not statistically significant at usually accepted levels.
(For nerds: the p value
was 0.1). But there were strong and significant trends in some
hurricane basins of the world, especially the North Atlantic (the region
encompassing the Caribbean, Gulf of Mexico, and open Atlantic north of
the equator), where storms have been strengthening at the rate of nearly
nine miles per hour per decade (see chart above). But other basins
offset that, including the western North Pacific, which showed a
negative trend..."
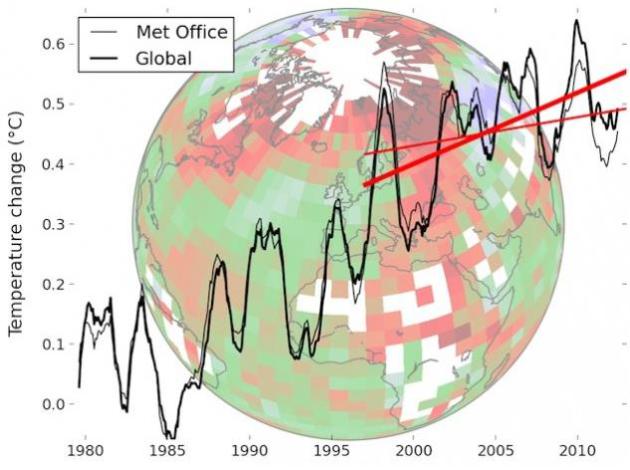
Faux Pause 2: Warmest November On Record, Reports NASA, As New Studies Confirm Warming Trend. Here's an excerpt of a good explanation from
ThinkProgress: "
A new study
by British and Canadian researchers shows that the global temperature
rise of the past 15 years has been greatly underestimated. The reason is
the data gaps in the weather station network, especially in the Arctic.
If you fill these data gaps using satellite measurements, the warming
trend is more than doubled in the widely used HadCRUT4 data, and the
much-discussed “warming pause” has virtually disappeared.
“There
are no permanent weather stations in the Arctic Ocean, the place on
Earth that has been warming fastest,” as New Scientist explained five years ago.
“The UK’s Hadley Centre record simply excludes this area, whereas the
NASA version assumes its surface temperature is the same as that of the
nearest land-based stations...”
Graphic credit above: "
The corrected data (bold lines) are shown compared to the uncorrected ones (thin lines)." Via RealClimate.
New Climate Records Focus On Earth's Sensitivity. Here's a clip from a story at Climate New Network and
Climate Central: "...
The Geological Society of London (GSL)
says the sensitivity of the Earth’s climate to CO2 could be double
earlier estimates. The Society has published an addition to a report by a
GSL working party in 2010, which was entitled Climate Change: Evidence
from teh Geological Record. The
addition says many climate models typically look at short term, rapid
factors when calculating the Earth’s climate sensitivity, which is
defined as the average global temperature increase brought about by a
doubling of CO2 in the atmosphere..."
Photo credit above: "
Evidence
from studies of past climate change suggest if longer-term factors are
taken into account, the Earth's sensitivity to a doubling of CO2 could
also be double than predicted." Credit: world.edu.
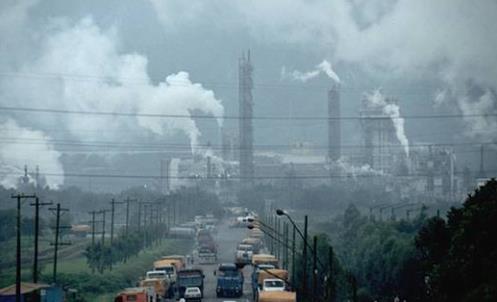
China Roars Ahead With Renewables. Here's an excerpt of a story at Australia's
The Conversation: "...
The
remarkable feature is that the share of renewables has leapt in
significance. Whereas non-fossil fuel capacity additions totalled 31
million kW in 2012, these renewable and nuclear power stations have
totalled 36 million kW so far this year – and could be projected to be
43 or 44 million kW for the whole year. That’s one new non-fossil power
station of 1 million kW nearly every week! But the even more astounding
feature is that the additions powered by renewables now exceed those
powered by fossil fuels (coal and gas) and nuclear..."
Photo credit above: "
Despite being the world’s biggest greenhouse gas emitter, China is increasing its renewable sources of energy."
AAP/HOW HWEE YOUNG.
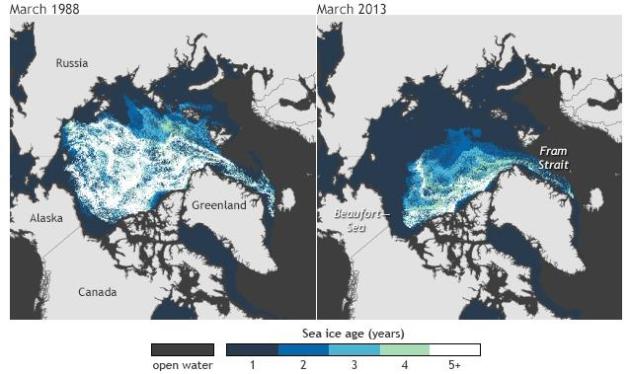
2013 Arctic Report Card: Only 7% Of The Ice Cover At The End Of Winter, 2013 Was Old, Thick Ice. Details from
NOAA's climate.gov: "
The
most common metric for tracking changes in Arctic sea ice over time is
sea ice extent. Extent approximates the sea ice you would see from a
bird's-eye view, and it has been declining at a rate of more than 14
percent per decade since satellite measurements began in 1979. If you
were to descend below the sea surface, your fish's-eye view would
provide an equally dramatic decline: sea ice is not only shrinking
across the ocean surface, it's also thinning. Directly measuring sea ice
thickness is more complicated than measuring sea ice extent, but a
useful proxy for ice thickness is age. Older ice is generally thicker
ice. As this pair of maps shows, the amount of very old, thick ice that
exists at the end of the Arctic winter in March has dropped
significantly in the past three decades. White corresponds with the
oldest, thickest ice. The darkest blue represents first-year ice: ice
that has survived one summer melt season..."
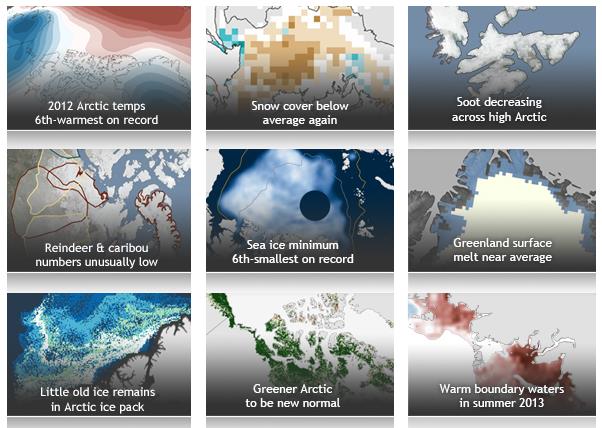
2013 Arctic Report Card: Visual Highlights. Here's an overview from
NOAA's climate.gov: "
From
reindeer to regional temperature patterns, from sea ice age to
Greenland surface melt, the Arctic Report Card is a yearly assessment of
the Arctic's physical and biological systems and how they are changing.
This collection of visual highlights from the 2013 report is a story of
the Arctic in pictures. Based on the report's major themes, it was
developed by the NOAA Climate.gov team in cooperation with Arctic Report
Card authors and other Arctic experts."
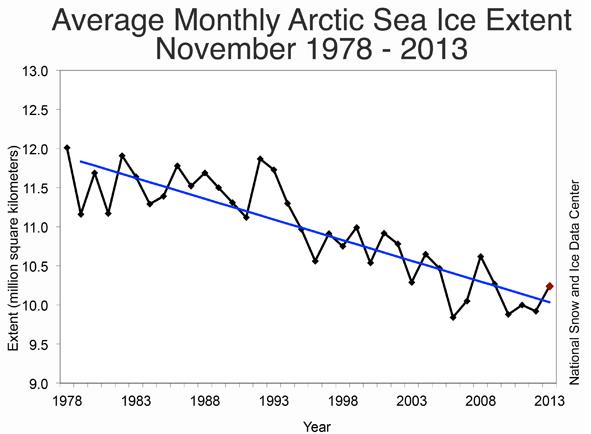
We're Still Losing Ice At The Poles. Here's an excerpt from a good summary at
Slate: "...
I’m
not sure how much stock to put in a prediction of an ice-free Arctic in
just a few years, but that day is clearly coming, and soon. Looking at the sea ice extent
(essentially, how much area is covered by ice) over the past few years,
we’ve lost about 2 million square kilometers over 15 years.* The extent
is at roughly 10 million sq. km now, so extrapolating we have 75 years
left. I’ll note that’s very rough, and I’d consider that only a decent
upper limit to how long it will take. With feedback processes, that’s
likely to be a severe overestimate..."
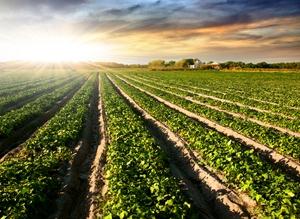
The Good And Bad News: How Climate Change Is Affecting Farming In Michigan. This has obvious parallels with agriculture in Minnesota. Here's an excerpt from
The Battle Creek Enquirer: "...
Bring
up the issue of climate change at the dinner table, and chances are
you’ll get served with a variety of differing, heated views. The same is
true in the fields. “There’s still a lot of skepticism in the farming
community over how big of an issue climate change really is or if it’s
happening at all,” Boring said. “I think you see a lot of guys
struggling to figure out really what’s going on and looking for answers
on it, because there’s so much conflicting information.” While a common
conception of climate change is sharply rising temperatures, Boring said
climate change is really about a gradual warming. In fact, the most
damaging aspect of climate change is how this subtle rise in temperature
may increase risk factors for extreme weather events such as more
intense hurricanes, heavier rainfall, droughts and heat waves..."
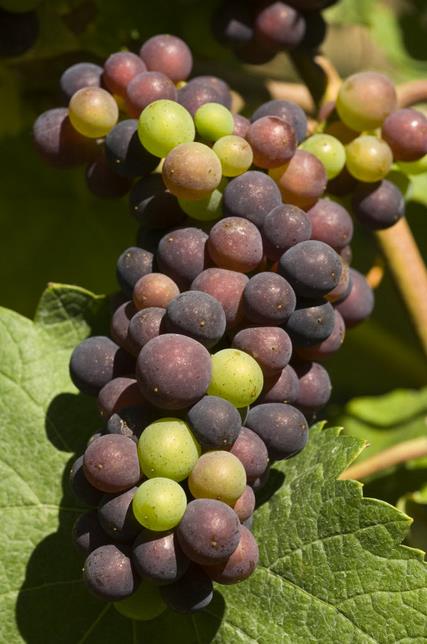
British Wine Benefits As The Climate Change. "A fine British wine?" As Europe continues to warm the concept may not be as far-fetched as it sounds. Here's an excerpt from
The New York Times: "...
More
obvious, though, may be the meteorological motive that is at least
partly behind Mr. Elzinga’s move. By the middle of this century, Britain
could become one of the world’s big wine producers, as global warming
moves the limits of viticulture ever farther north. “The wine industry
in Europe will certainly change to follow the climate changes,” said Mr.
Elzinga, who is now chief winemaker at Denbies Wine Estate, one of
Britain’s largest vineyards. “You can’t beat the climate, so you have to
follow it...” (File: Andrea Johnson).