More record heat across the southern Plains today, highs range from 100-110 from Oklahoma into Texas. The Lonestar state is experiencing the worst drought since 1957, the 3rd worst on record, according to NOAA.
"...The sponge is fully saturated - there is nowhere for any additional water to go," said Jack Hayes, Ph.D., director of NOAA's National Weather Service. "While unusual for this time of year, all signs point to the flood threat continuing through summer." - Reuters story below on the historic flooding underway across the USA, expected to linger most of the summer.
"...
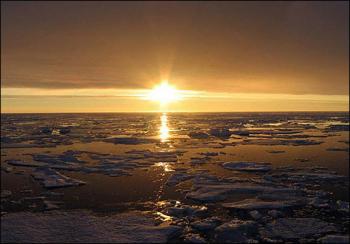
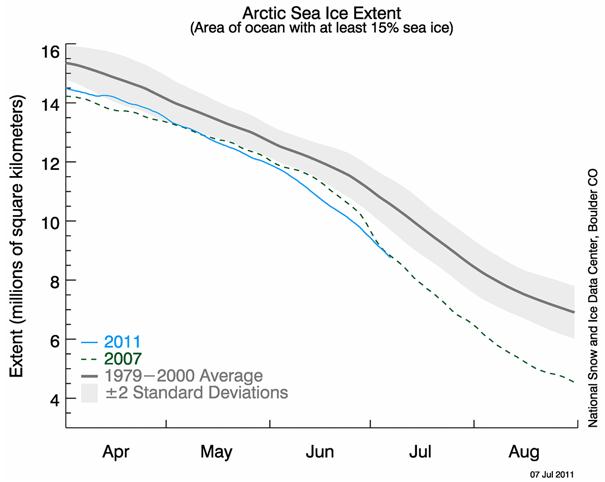
The summer melt season is in full swing in the Arctic, and sea ice there is in record retreat. Arctic sea ice is currently at its lowest extent on record for early July, according to estimates from the National Snow and Ice Data Center and University of Bremen. Moreover, Arctic sea ice volume is at its lowest on record, according to the University of Washington Polar Science Center, and during June 2011, was reduced by nearly half (47%) compared to its maximum at the beginning of the satellite era, in 1979." - Dr. Jeff Masters in his
Wunderblog post, details below.
"...
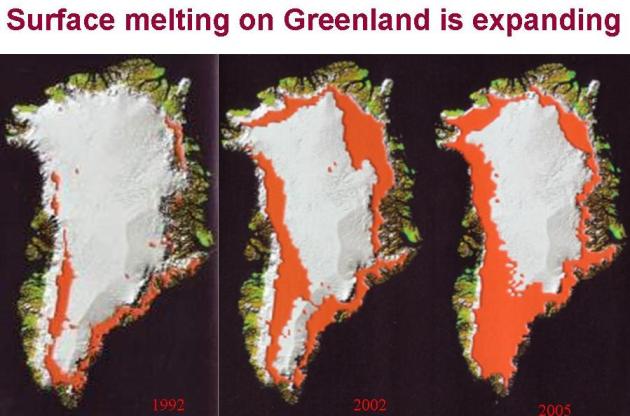
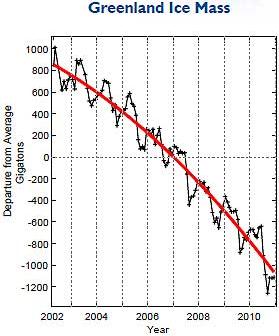
Greenland’s ice sheet lost more mass in 2010 than in any year during the last decade. The melt rate was nearly 10 percent more than the previous record year for loss, 2007. Mountain glaciers globally lost mass for the 20th straight year."
- article on "unmistakable" global warming from NOAA and the AMS below.
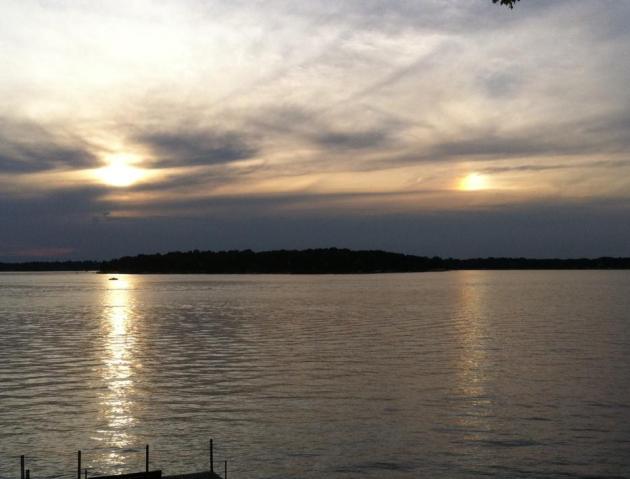
Photo Of The Day: "Alien Sunset". Since when did we have two setting suns? I took this photo a few days ago (with my trusty new Olympus SZ-30 MR), showing a spectacular example of a "sun dog". An example of parhelia, sun dogs are triggered by sunlight being refracted (bent) off hexagonal ice crystals about 25,000 feet above the ground. Cirrus clouds act as billions of microscopic prisms, bending white light into the colors of the rainbow. Pretty cool.
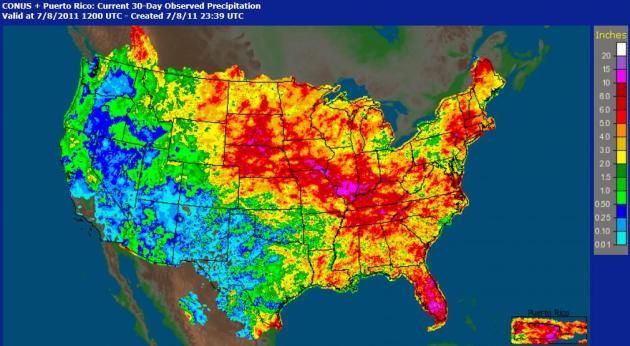
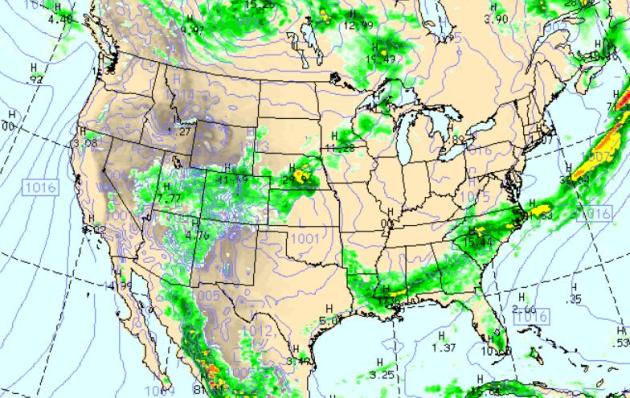
Time To Build An Ark? The 30-day rainfall map is impressive: a huge swatch of real estate from the Dakotas into the Middle Mississippi Valley and interior New England has picked up 5-8" of rain since June 8, 2011. The purple areas show Doppler rainfall estimates over over 10", that's 2-3 month's worth of rain from southeastern Iowa into southern Illinois and southern Florida. Click here to see the rainfall estimates, for the last day, week or month, courtesy of the Advanced Hydrologic Precipitation Analysis, a division of NOAA.
24 Hour Rainfall Records For July 8:
Florence SC: .79”
Tampa FL: 3.65”
Lakeland FL: 2.90"
St. Petersburg, FL: 3.23”
Williamsport, PA: 1.44”
Syracuse, NY: 1.34
Record Highs For July 8:
Hattiesburg, AL: 99
Wichita Falls, KS: 110
Monroe, LA: 100
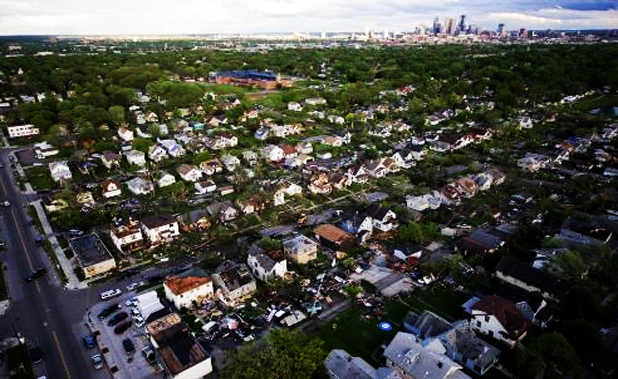
SBA Offers Disaster Assistance To Hennepin County Residents Affected By Severe Storms & Tornadoes In Minnesota.
Marketwatch.com has an update: "
WASHINGTON, Jul 07, 2011 (BUSINESS WIRE) -- Residents and businesses affected by the severe storms and tornadoes on May 21-22 in Hennepin County, Minn., can apply for low-interest disaster loans from the U.S. Small Business Administration, SBA Administrator Karen G. Mills announced today. Mills made the loans available in response to a letter from Minnesota Gov. Mark Dayton on July 1, requesting a disaster declaration by the SBA. The declaration covers Hennepin County, and the neighboring counties of Anoka, Carver, Dakota, Ramsey, Scott, Sherburne and Wright in Minnesota. "The SBA is strongly committed to providing the people of Minnesota with the most effective and customer-focused response possible to assist homeowners, renters, and businesses of all sizes with federal disaster loans," said Administrator Mills. "Getting businesses and communities up and running after a disaster is our highest priority at SBA." "Loans up to $200,000 are available to homeowners to repair or replace damaged or destroyed real estate. Homeowners and renters are eligible for loans up to $40,000 to repair or replace damaged or destroyed personal property," said Frank Skaggs, director of SBA's Field Operations Center East in Atlanta. SBA's customer service representatives will be on hand at the Disaster Loan Outreach Center to answer questions about the disaster loan program, explain the process, issue and help individuals complete their applications."
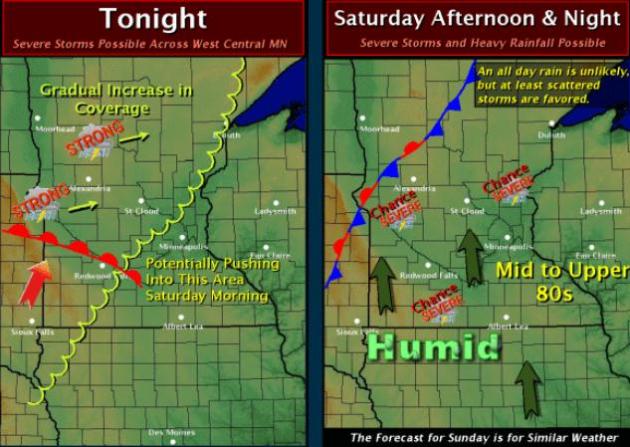
Weekend Weather Story. The Chanhassen office of the NWS has an overview of our weekend weather set-up: a cool front approaching from the Dakotas runs out of gas and stalls out over western and central Minnesota. Storms should be most frequent north/west of the Twin Cities, some packing torrential rains - a few may turn severe.
Saturday Evening Weather Map. The WRF/NAM model is forecasting a line of strong/severe storms stretching from Wisconsin into Minnesota and Iowa later today, a squall line firing out ahead of a weak cool front, which will temporarily stall over the Upper Midwest, prolonging the thunder threat. The soggy remains of a tropical wave (that soaked Florida with 3-4 days of torrential rains and T-storms) will spark more heavy T-storms over the Carolinas, more thundery weather along the Gulf coast. New England dries out, most of the west coast stays sunny and dry - a few monsoon-related T-storms flaring up from southern Utah and northern Arizona to the Front Range of Colorado.
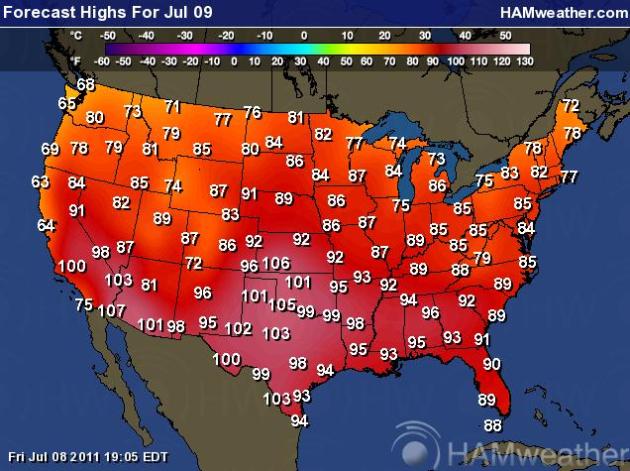
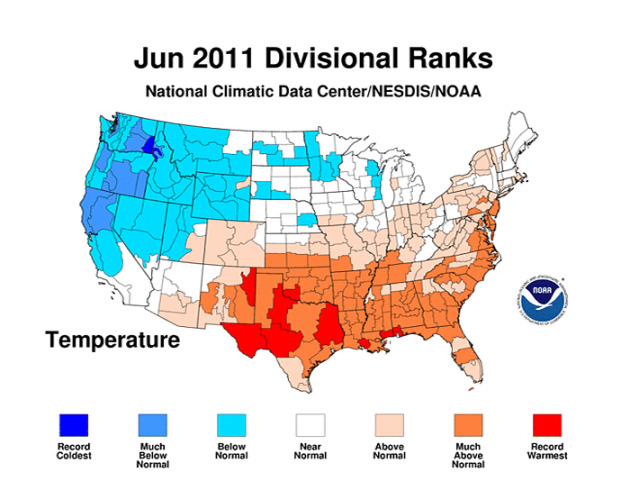
More Scorching Heat. Afternoon highs shoot up into the 100-110 range again today over the southern Plains and Texas, suffering through the 3rd worst drought in the state's history. More moderate 80s and 90s are predicted for most of America, the Pacific Northwest still unusually cool for mid July. Map courtesy of
Ham Weather.
Saturday Severe Storm Risk. The greatest potential for hail, damaging straight-line winds and even a few isolated tornadoes will come from Duluth to the Twin Cities, St. Cloud, southwestward to Sioux Falls and the Denver area. Map courtesy of SPC.
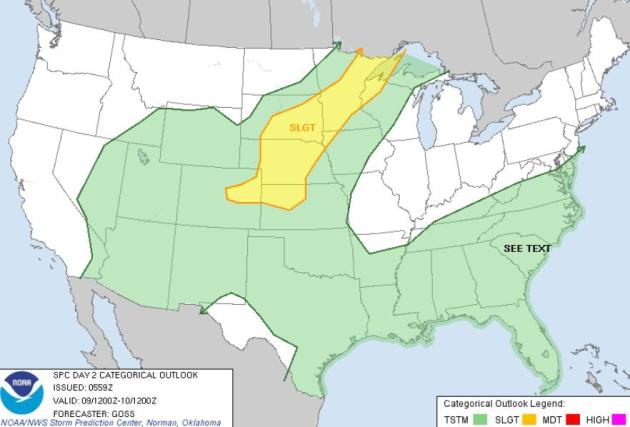
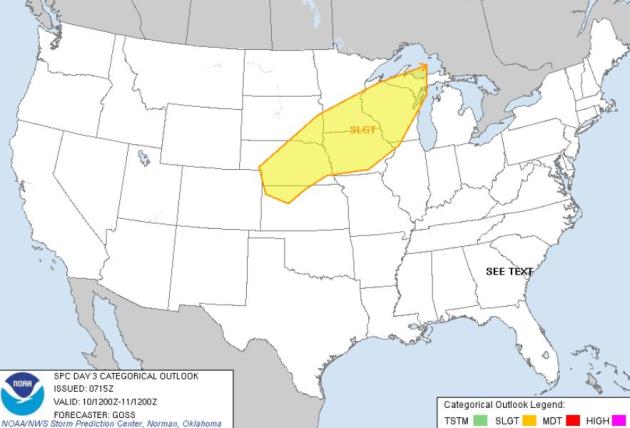
Sunday Severe Threat. SPC has roughly the southern half of Minnesota in a "slight risk" on Sunday, strong/severe storms bubbling up ahead of a very slow moving cool front. The risk extends from Green Bay and Madison westward to Des Moines and Omaha.
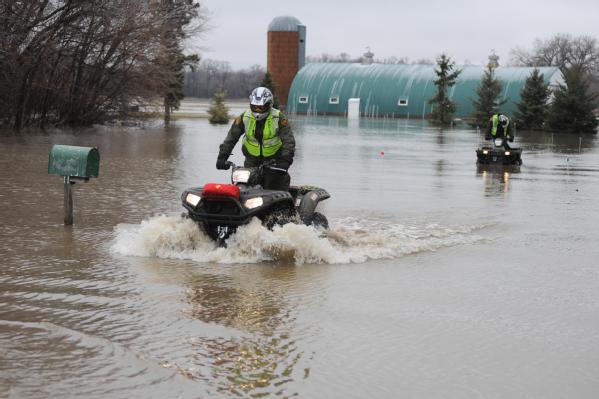
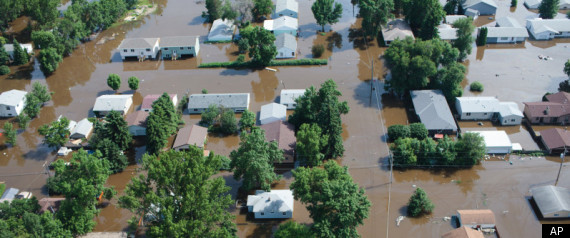
America Set To Suffer Continued Flooding Through Summer. Reuters has the grim news: "The American Midwest and northern Plains are preparing for continued flooding, with the threat of above average rainfall expected to continue through the summer, says the National Oceanic and Atmospheric Administration's National Weather Service, who believe that flooding this year could rival the Great Flood of 1993.
Rivers are already running high, and the soils are saturated with water, which means that even a little bit of rain could trigger further flooding in and around locations which have already seen flooding this year. NOAA's Climate Prediction Center is also forecasting above-normal rain for most of these vulnerable areas in the next two weeks, and above-normal rainfall in much of the region in the one- and three-month outlooks. In addition, with increasing temperatures expected over the Rockies, the water melt from the remaining snowpack will makes its way down the mountains and into the already swamped rivers. "The sponge is fully saturated - there is nowhere for any additional water to go," said Jack Hayes, Ph.D., director of NOAA's National Weather Service. "While unusual for this time of year, all signs point to the flood threat continuing through summer."
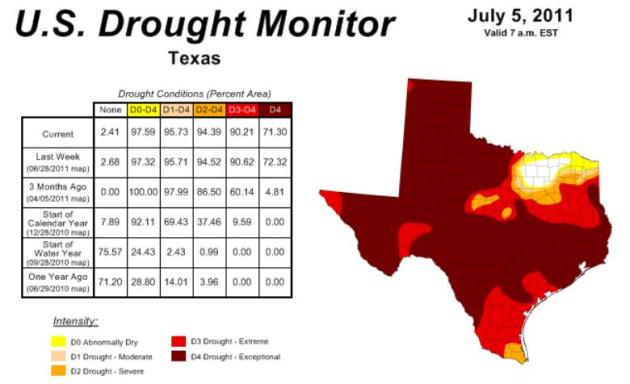
The Great Drought of '11. Some staggering numbers coming out of Texas. 94.39% of the state is suffering through a severe drought - 71.3% of Texas is in an "exceptional drought", as bad as it gets. Last year at this time only 4% of the Lonestar State was in a moderate drought, with no severe or exceptional drought reported in 2010. Map courtesy of NOAA's
Drought Monitor. More facts:
- At a drought conference in Austin yesterday, the Texas State Climatologist called the current drought the third worst on record for the state behind only 1956 & 1918. They are now 9 months into this drought.
- The massive exceptional drought area stretches from Arizona to South Carolina and Florida.
- That covers approximately 12% of the Lower 48, or around 367,000 square miles.
- This area is larger than the entire Northeast region of 15 states (Maine to Ohio to North Carolina) plus the District of Columbia.
- Since the Drought Monitor was first regularly produced in 2000, this is the largest coverage of exceptional drought.
- In Texas, the drought has made things "very difficult in lots of ways for wildlife," says Kirby Brown, an official with the Texas Wildlife Association. Even if they can find water, the animals may have trouble getting enough food, as trees and plants suffer from the lack of moisture. In West Texas, one of the areas of the state worst hit by the drought, local newspapers have reported animals creeping into cities in search of bugs that reside on lawns, and other nourishment. Wild turkeys are in trouble, Brown says. So are quail, and deer. It's fawning season for deer around the state, and they won't get much to eat. Deer hunters should also expect less spectacular antlers this year, when hunting season begins. Hunters will see the impact in September, when the Texas dove hunting season kicks off. Squirrel hunting in October will also be tough. Fish are in trouble, too. (http://www.chicagotribune.com/news/nationworld/kdaf-lengthy-drought-takes-toll-on-texas-wildlife-story,0,7178023.story)
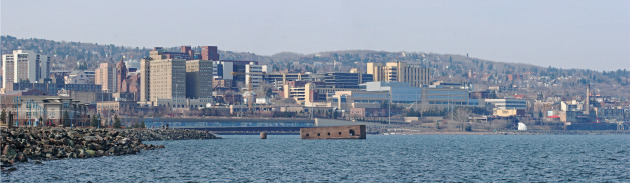
. Here's a story about the new NOAA "normals", the running 30-year averages, and the observed warming trend in the last 10 years, most prominent across the northern third of the USA. The
Duluth News Tribune has the story: "
Average temperatures in Duluth have gone up enough over the past decade to raise what the National Weather Service considers long-term normal temperatures, with the biggest warm-up seen in overnight low temperatures. That means it’s going to take even more warmth to beat the daily normal highs and lows that local weather forecasters show every day as a measure against that day’s actual weather. Once each decade the Weather Service updates the 30-year running average temperatures — in this case dropping the 1970s and adding the 2000s. The new 30-year “normal” period runs from 1981 through 2010. The effect from the 2000s — which scientists already knew was the warmest decade since accurate records have been kept — was enough to pull the 30-year average up considerably. “It is interesting how the (warmer) winter low temperatures stand out,” said Steve Gohde, observation program leader for the National Weather Service in Duluth."
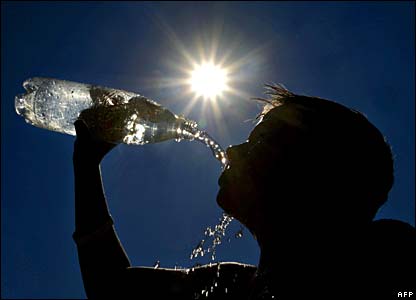
NOAA: U.S. Warmer And Drier Than Normal in June.
NOAA has the details: "
June 2011 brought temperature and precipitation extremes across the United States. An oppressive heat wave, accompanied by intensifying drought conditions, shattered temperature records in the South and Southwest. Overall, the nation had its 19th driest and 26th warmest June on record, according to scientists at NOAA’s National Climatic Data Center (NCDC) in Asheville, N.C. The average U.S. temperature in June was 70.7 degrees F, which is 1.4 degrees F above the long-term (1901-2000) average. Precipitation, averaged across the nation, was 2.48 inches. This was 0.41 inch below the long-term average, with large variability in different locations. This monthly analysis, based on records dating back to 1895, is part of the suite of climate services NOAA provides.
- Several locations broke all-time high temperature records. On June 26, Amarillo, Texas, set an all-time high temperature record of 111 degrees F, breaking the record of 109 degrees F set just two days prior. On June 15, Tallahassee, Fla., also recorded an all-time high, 105 degrees F. For the month, 42 U.S. locations tied or broke all-time maximum high temperatures.
- The expansive heat across Texas resulted in an average temperature of 85.2 degrees F, which was 5.6 degrees F above normal, surpassing 1953 as the warmest June in 117 years of records. This was the fourth consecutive June in Texas with temperatures at least 2 degrees F above the long-term average."
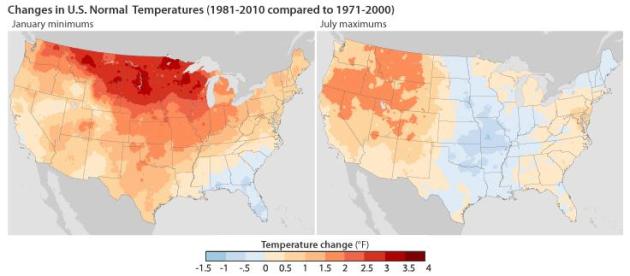
The New Climate "Normals" - A Trend Toward Warmer Nights. NOAA's
Climate Watch has details of what the new, running, 30-year temperature averages are showing: "
When several grand sugar maples at the famous Longwood Gardens in Pennsylvania succumbed to disease recently, grounds manager Shawn Kister wondered if warm winters were to blame. Some plant diseases are stopped by cold, he knew, and others are encouraged by longer warm periods. Sugar maples like the cold, and Longwood is already at the southern edge of their historical range. A few hundred miles south, Charlotte-based TV meteorologist John Ahrens noticed that area rainfall had remained lower than normal for several years. The farmers and landscapers around Charlotte were compensating with more irrigation, but those systems are expensive. What was going on? Was this going to be the new normal?
Defining normal
Gardeners, meteorologists, businesses, weather junkies and others will get answers to some of these questions in July, when NOAA’s National Climatic Data Center (NCDC) releases the latest version of an official weather product called the U.S. Climate Normals. Updated each decade, the U.S. Climate Normals are 30-year averages of many pieces of weather information collected from thousands of weather stations nationwide. Each time they are updated, an old decade is dropped, and a new one added. Starting in July, when you hear that a day was hotter, or colder, or rainier than normal, that ”normal” will be a little different from what it was in the past."
Warming Trend. Across much of the country, overnight low temperatures in January are as much as several degrees warmer in the 1981–2010 Normals than they were in the 1971-2000 version (left). Meanwhile, the average maximum temperatures in July are actually cooler across some parts of the country (right). (Maps by NOAA.)
You 'Wanna Talk Hot? Dr. Mark Seeley has some good (and stinking hot) weather trivia in this week's edition of his
WeatherTalk blog: "
July 8, 1936 was the middle of a terrible heat wave in Minnesota, lasting from July 5th to the 18th. Virtually every climate station in Minnesota reported daytime temperatures of 100 degrees F or greater, with the exception of Two Harbors (98 F) and Grand Marais (89 F) along the Lake Superior shoreline. Moorhead reported 9 days over 100 degrees F, including 114 degrees F on the 6th. The July heat wave was blamed for over 800 deaths in Minnesota."
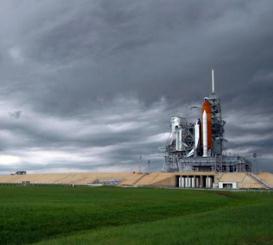
Why Does NASA Launch Space Shuttles From Such A Weather-Beaten Place? Great question. Central Florida sees more cloud to ground lightning than any other stretch of real estate in the USA, over 130 days/year with thunderstorms nearby.
Scientific American has the story: "
Space shuttle Endeavour remains on the launch pad today after a series of weather delays nixed launch attempts Saturday, Sunday and Monday. Much of the country is balmy and dry this time of year but precipitation, wind and lightning are a mainstay along Florida's Atlantic coast, home to Kennedy Space Center. Many satellite launches, including some for NASA, lift off from elsewhere in the U.S., namely Vandenberg Air Force Base in California. And the space agency utilizes other arid sites for shuttle operations, as well, landing the orbiter at Edwards Air Force Base in California when the weather over Kennedy is poor and even once easing it down at New Mexico's White Sands Space Harbor. All of which begs the question: Why did NASA pick Cape Canaveral for its launch site, not only for the space shuttle program but also for the manned missions of the Mercury, Gemini and Apollo programs?"
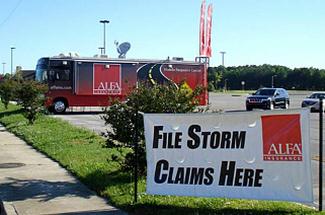
People, Processes and Technology Combine To Deal With Alabama Tornadoes.
Propertycasualty360.com has a story about how insurance adjusters are using new technology to not only track severe weather, but help customers with insurance claims as quickly and efficiently as possible: "
There may not be a nastier rivalry in all of college sports than the University of Alabama and Auburn University. The two sides love to hate each other, yet when tragedy strikes, as it did on April 27, an entire state becomes one and chants of “Roll Tide” or “War Eagles” are put aside—at least until the fall—so all Alabamans can bond and help one another. April 27 was the day a tornado roared through the northern part of Alabama, claiming 243 lives and causing over $2 billion in insured damage. The daytime storm allowed television cameras to capture the fury of this storm for the entire state to view. “We were almost eyewitnesses, says Eileen Senn, vice president of claims operations, Alfa Insurance, which is based in Montgomery. “We watched tornados live on TV ripping through Tuscaloosa and Birmingham. Some of our managers watching on TV knew they had employees in the area and some had college-age students in the basement of the buildings as we watched the storms form. That was a monumental day for the state of Alabama.”
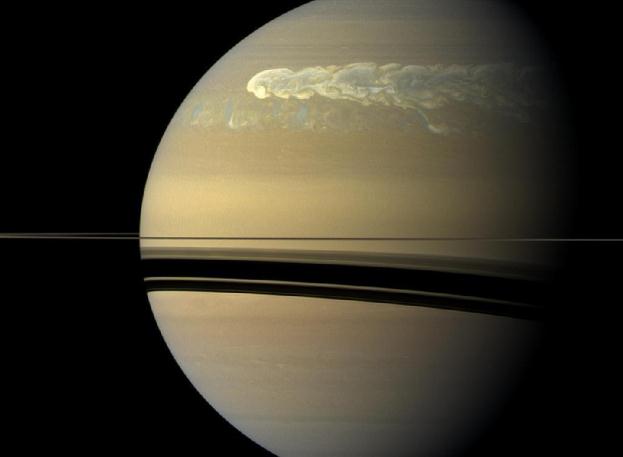
Massive Storm On Saturn 8 Times The Size Of Earth. NASA has released some new and stunning photos -
Huffington Post has a story about a giant storm of swirling gases prominently visible on the surface of Saturday: "
This storm on Saturn is bigger than you can possibly imagine. According to NASA, it's actually eight times the surface area of Earth. It is the biggest storm ever observed on the planet, and is at least 500 times bigger than any other storm observed by the Cassini spacecraft that orbits the ringed planet. It seems the beast of a storm is as destructive as it is large. "The storm is about 500 times larger than the biggest storm previously seen by Cassini during several months from 2009 to 2010. Scientists studied the sounds of the new storm's lightning strikes and analyzed images taken between December 2010 and February 2011. Data from Cassini's radio and plasma wave science instrument showed the lightning flash rate as much as 10 times more frequent than during other storms monitored since Cassini's arrival to Saturn in 2004. The data appear in a paper published this week in the journal Nature." Scientists are excited by the storm because it provides further insight into the weather patterns of the planet. Apparently this occurrence shows just how much the change of seasons can affect the planet's major weather."
Outlook: "Free Sauna"
This is the time of year I wish I could slow the space-time continuum and hit "pause". Every evening I spend 3 hours out by the lake, reading, contemplating, praying for another day just like today. "Retire in Minnesota!" I urge my parents. "The pace is slower, the people are nicer, and everyone has their own lake (or pond/wetland/creek). Nothing like it on Earth. Tough winters? People wouldn't stick around if the summers didn't compensate for the slush & pain.
Speaking of ice, NOAA's National Snow & Ice Data Center reports record low levels of Arctic ice for early July; 47% less ice than 1979, when the satellite record began. We may come close to the all-time record minimum for ice in 2007.
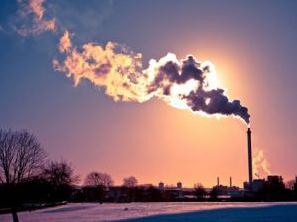
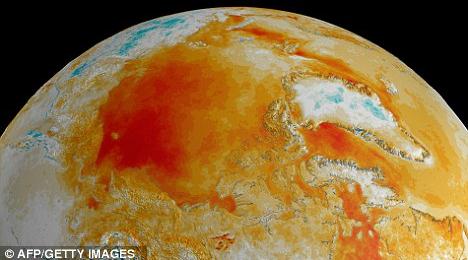
NOAA: "Unmistakable" Global Warming Continues. Here's a post from the AMS Blog, "
The Front Page": "
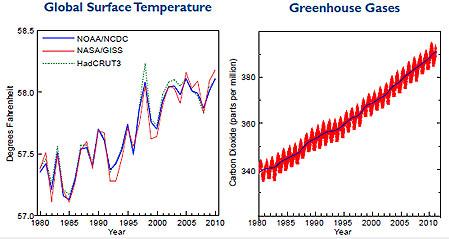
NOAA released the 2010 edition of its annual State of the Climate report this week revealing that Earth’s atmospheric and oceanic temperatures are rising unabated. The 218-page report, consisting of the peer-reviewed conclusions of more than 350 researchers in 45 nations, will be distributed with the June issue of the Bulletin of the AMS. A press briefing summarizing the report’s findings noted a “consistent and unmistakable signal from the top of the atmosphere to the bottom of the oceans” that the world continues to warm. Those signals include last year’s global surface temperatures virtually tying 2005 as the warmest in the reliable global record, which dates to 1980. The Arctic warmed about twice as fast as the rest of the world, reducing sea ice extent to its third lowest level on record."
Graphic above: "Rising global surface temperatures (left panel), and CO2 concentration levels (right panel, from Mauna Loa observatory). NOAA and NASA temperatures in 2010 are virtually tied with 2005 for warmest year on record. The UK Hadley Center Research Unit's data shows 2010 second to 1998 for warmest year." Courtesy AMS & NOAA.
Greenland: Increasingly Green. "
Greenland’s ice sheet lost more mass in 2010 than in any year during the last decade. The melt rate was nearly 10 percent more than the previous record year for loss, 2007. Mountain glaciers globally lost mass for the 20th straight year." Source:
AMS (American Meteorological Society) and NOAA.
Arctic Sea Ice In Record Retreat. Dr. Jeff Masters has a post about the alarming trends at the top of the world in his
Wunderblog. I know, another example of all those NASA/NOAA/NAS scientists scamming us again. Cue the conspiracy theorists and professional science-deniers: "
The summer melt season is in full swing in the Arctic, and sea ice there is in record retreat. Arctic sea ice is currently at its lowest extent on record for early July, according to estimates from the National Snow and Ice Data Center and University of Bremen. Moreover, Arctic sea ice volume is at its lowest on record, according to the University of Washington Polar Science Center, and during June 2011, was reduced by nearly half (47%) compared to its maximum at the beginning of the satellite era, in 1979. The latest surface analysis from Environment Canada shows a 1039 mb high pressure system centered north of Alaska, which is bringing clear skies and plenty of ice-melting sunshine to the Arctic. The combined action of the clockwise flow of air around the high and counter-clockwise flow of air around a low pressure system near the western coast of Siberia is driving warm, southerly winds into the Arctic that is pushing ice away from the coast of Siberia, encouraging further melting. This pressure pattern, known as the Arctic Dipole, was dominant over the Arctic during June, leading to the record low extent observed at the beginning of July. The Arctic Dipole began emerging in the late 1990s, and was unknown before then; thus climate change is suspected as its primary cause. The Arctic Dipole has become increasingly common in the last six years, and has contributed significantly to the record retreat of Arctic sea ice."
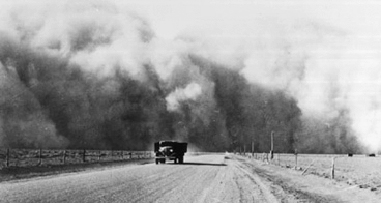
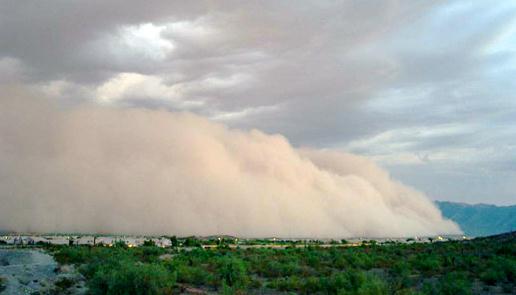
Huge Phoenix Dust Storm Tied To Climate Change. I know there's a temptation to link every extreme weather event to climate change, which is probably simplistic (and incorrect). But climate change may be driving perpetual drought conditions over the southwest, which (in turn), helped to create the conditions necessary for the largest haboob on record.
Peoplesworld.org connects the dots: "
A report by AZFamily.com said this dust storm is regarded as one of "historic" proportions. At one mile high, 50 miles wide, and moving at nearly 30 mph, the storm overtook Phoenix at about 7:30 p.m. on Tuesday, leaving dust and debris in its wake, said AZ Central. As the storm caused damage in various areas of the state - including blackouts in Tempe and, in one case, a small fire - the Phoenix Fire Department received around 700 calls for help throughout the night. Overall, roughly 8,000 people have been left without power, and Phoenix-bound flights were delayed for many hours as visibility was reduced to zero. Jeff Masters, a meteorologist at Weather Underground, notes that this storm had a higher amount of dust than usual for such storms, and says the amount of dust the storm carried could be attributed to the severe drought conditions the region has been experiencing. A drought has gripped the Southwest for the past decade, according to the National Climatic Data Center. Climate Central draws a link between the latest storm and climate change. It reports that scientists have predicted that rainfall will become increasingly scarce in the southwestern U.S. in the coming years. As a result, droughts will become more frequent in this region. So when the summer monsoon thunderstorms occur, they can whip up large amounts of dust off the dry ground, which would cause dust storms like the one seen on Tuesday."
Climate Change: Still Worse Than You Think. Alarmist hype? We'll see.
Mother Jones has the story: "
While I was on vacation last week I took a side trip to New Haven to visit Jeff Park, an old high school friend who's now a geology professor at Yale. We ate some pizza at Frank Pepe, walked around the campus a bit, and then dropped by his office, where he had a stack of reprints of his latest journal article. Take one, he said. Maybe it'll be good fodder for the blog. The title is a mouthful: "Geologic constraints on the glacial amplification of Phanerozoic climate sensitivity," coauthored with Dana Royer. (The Phanerozoic, in case it's slipped your mind, is the geologic eon spanning approximately the last 500 million years.) Roughly speaking, the article is an updated look at a computer model that estimates how much climate reacts to a doubling of CO2 in the atmosphere. The model originally concluded that a doubling of CO2 produces a temperature increase just under three degrees Celsius, an estimate that's in pretty good agreement with other models. So far, so good. But 500 million years is a long time, and several researchers have proposed that climate sensitivity might vary over that period depending on whether or not the earth is in an ice age. So in the new paper, the authors modeled glacial and non-glacial eras separately. And the best fit with the data suggests that climate sensitivity does indeed change depending on glaciation. In fact, during an ice age, the most probable climate sensitivity is six to eight degrees Celsius for a doubling of CO2, more than twice the previous estimate."
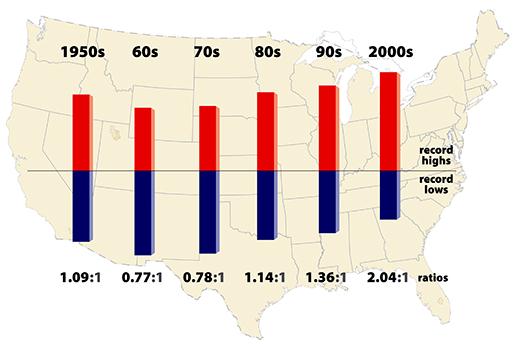
Record High Temperatures Far Outpace Record Lows Across The USA.
Climate Progress has the story: "
This graphic shows the ratio of record daily highs to record daily lows observed at about 1,800 weather stations in the 48 contiguous United States from January 1950 through September 2009. Each bar shows the proportion of record highs (red) to record lows (blue) for each decade. The 1960s and 1970s saw slightly more record daily lows than highs, but in the last 30 years record highs have increasingly predominated, with the ratio now about two-to-one for the 48 states as a whole. (©UCAR, graphic by Mike Shibao.)"
Wars, Food Shortages And Mass Immigration: How Global Warming Poses Dire Threat To Britain's Security. The U.K.'s
Daily Mail has the story:
"Global warming will threaten Britain's security by triggering wars, food shortages and mass migration, Energy Minister Chris Huhne warned today. Although the UK may escape the worst physical impacts of rising temperatures and sea levels, the UK will still be exposed to 'alarming and shocking' consequences of climate change elsewhere, he said. The warning comes as Ministers are preparing a White Paper that will usher in a new wave of nuclear power stations and a massive expansion of wind farms to cut Britain's greenhouse gas emissions. In a speech to the Royal United Services think tank, Mr Huhne warned that climate change was a 'systemic threat' 'With luck, the UK may well escape the worst physical impacts,' he said. 'But in a connected world, we will be exposed to the global consequences. And they are both alarming and shocking.' The most recent report from the Intergovernmental Panel on Climate Change forecasts that world temperatures could rise between 1.1C and 6C this century, increasing sea levels by seven to 23 inches and making heat waves, droughts and floods more common."