Minnesota's Campgrounds: Sitting Ducks. There are thousands of campgrounds across the USA that are vulnerable to severe weather, high winds and tornadoes. Many of these campgrounds don't have:
2). Not enough (concrete/steel) reinforced shelters within a 2-5 minute dash of each campsite. In some cases bathrooms or "comfort stations" can work if a severe storm is approaching, but there's no way to cram hundreds of campers into one bathroom.
3). No NOAA weather radio. This is just asking for trouble, a huge potential legal liability. NOAA Weather Radio is the ONLY device (other than an app on your smartphone) that will wake you up at 2 am if a tornado warning is issued for your county. Weekend campers may not even realize what county they're in - potentially oblivious to dangerous weather moving their way.
Here in Minnesota police officers describe a "metro mentality", city residents come north to escape, to get away and enjoy the lakes. They believe (wrongly) that the level of weather and storm preparedness Up North is equivalent to what it is in the metropolitan areas of Chicago, the Twin Cities, Milwaukee or Des Moines. Nothing could be farther from the truth. Siren coverage is spotty, and many campgrounds haven't spent the money to "storm-proof" their campsites. This is an accident waiting to happen.
Here are a few steps you can take the next time you take the family camping, either at a campground, or roughing it out in the backwoods:
2). Situational Awareness. Any good camper can read the sky and (on some level) know if a severe storm is brewing. High humidity, a southeast breeze, building clouds are all tip-offs that storms may be brewing. Wherever you are, hiking, camping, enjoying the outdoors, always have an "escape route" in the back of your mind. Where could you seek shelter if skies turn threatening? Under a rocky overhang, a nearby store or lodge? With a little planning and a Boy Scout "be prepared" mindset you can lower the risk of disaster by thinking and planning ahead.
3). Smartphone apps. This is where the real revolution is taking place in warning technology. There are some terrific apps out there for getting the time-sensitive information you need to stay ahead of the storm. They cost a few bucks, but think of it as another form of life insurance. My company, WeatherNation, offers warning solutions for major corporations, but there are some great options (that aren't in any way related to my business) that can be personalized for the locations you care about, even your real-time GPS location. They're worth every penny:
"RadarScope is a specialized display utility for weather enthusiasts and meteorologists that allows you view NEXRAD Level 3 radar data along with our most requested new feature, Tornado, Severe Thunderstorm, and Flash Flood Warnings issued by the National Weather Service. It can display the latest reflectivity, velocity, and other products from any NEXRAD radar site in the United States, Guam and Puerto Rico. These aren't smoothed PNG or GIF images, this is real Level 3 radar data rendered in its original radial format for a high level of detail.
This version *now includes* support for Hawaii, Alaska, and Guam!
Whether you are scanning reflectivity for a mesocyclone's tell-tale hook echo, trying to pinpoint the landfall of a hurricane's eye wall, or looking for small features like velocity couplets in the storm relative radial velocity product, only RadarScope gives you the power to view true radial NEXRAD weather radar on your iPhone or iPod touch.
When there are any Tornado Warnings (outlined in RED), Severe Thunderstorm Warnings (YELLOW polygons), or Flash Flood Warnings (GREEN polygons) in effect throughout the US, tap the warning button in the top right corner to browse the list of current warnings, view the details, and even zoom to the selected warning on the map".
"The award-winning My-Cast app delivers comprehensive yet intuitive weather information specifically for the iPhone and iPod Touch. Un-cluttered base maps display animated radar, clouds and StormWatch severe weather alerts allowing effortless interpretation of how the weather affects your day. As you check out the current weather, you may see drifting clouds or falling rain as My-Cast's distinctive weather themes come to life. Whether you are interested in weather for today, tomorrow or next week, My-Cast has you covered. When severe weather strikes, My-Cast transmits the latest alerts direct from the National Weather Service.
• Real-time, animated radar
• Weather Map with conditions, temperatures, dew points, wind direction and wind speed overlays
• Animated Visible and Infrared Clouds
• Interactive StormWatch map with National Weather Service alerts
• Complete severe weather warnings, watches, and advisory alert text
• 7-day forecast with high/low temperatures and chance of precipitation
• Hourly forecast with temps, wind speed/direction and chance of precipitation
• Forecast graph including past, present and forecast wind, dew point, temperature, and sky conditions
• Save your favorite and recently viewed locations for anywhere in the U.S.
• Shake for live data refresh
• One-button push for GPS positioning
• No ads!"
"Listen to over 170 scanner radio stations providing access to NOAA Weather Radio All Hazards (NWR) broadcasts. NWR is a nationwide network of radio stations broadcasting continuous weather information. NWR broadcasts official Weather Service warnings, watches, forecasts and other hazard information 24 hours a day, 7 days a week. Weather Radio comes with Twitter & Facebook support: tell your friends what station you're listening to, "live", without stopping your audio to invoke an external Twitter or Facebook client! Weather Radio allows users to select from NWR audio streams by State-City, or add your favorite stream."
* all 3 apps are available on iTunes. Some of these may be available for Android and Blackberry as well. It's well worth your time to look into this and download these onto your phone, set up your favorite locations (home, work, cabin, beach, etc) and see how they can give you the information you need to make smarter decisions, and keep your family out of storm-related trouble.
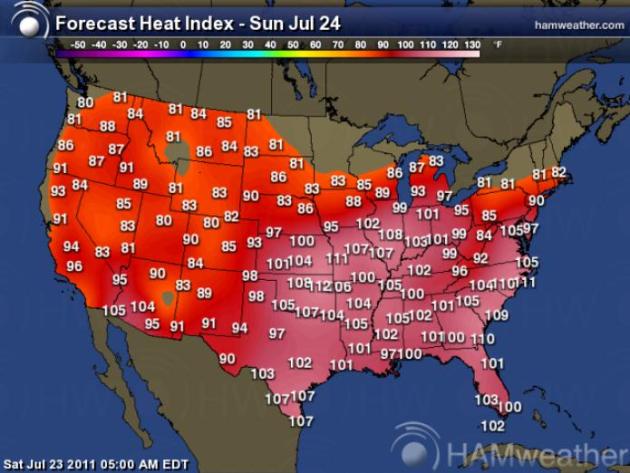
CITY MAX TEMP MAX HEAT INDEX
RICHMOND VA 101 109
NORFOLK VA 103 113
NEWPORT NEWS VA 101 111
WAKEFIELD VA 101 107
WALLOPS ISLAND VA 99 112
SALISBURY MD 103 116
OCEAN CITY MD 100 119
ELIZABETH CITY NC 99 112
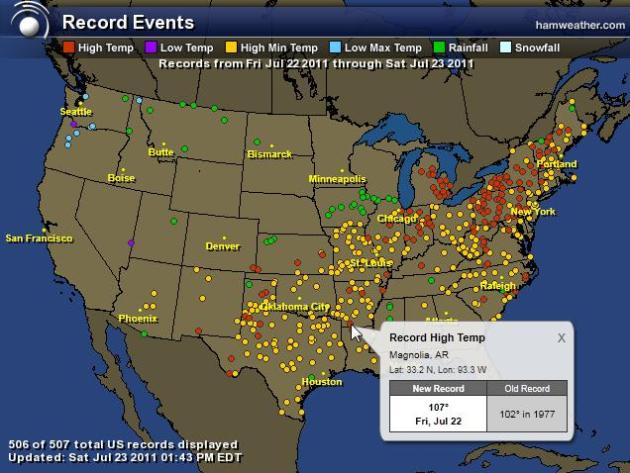
...RECORD HIGH TEMPERATURE SET AT BALTIMORE MD...
THE HIGH TEMPERATURE OF 102 DEGREES AT BALTIMORE MD TODAY TIES THEOLD RECORD OF 102 DEGREES LAST SET IN 1991. ...RECORD HIGH TEMPERATURE SET AT NORFOLK VA...
THE HIGH TEMPERATURE OF 103 DEGREES OCCURRED AT NORFOLK VA TODAY.THIS TIES THE OLD RECORD OF 103 SET IN 1952. .RECORD HIGH TEMPERATURE SET AT WASHINGTON DULLES DC...
THE HIGH TEMPERATURE OF 99 DEGREES AT WASHINGTON DULLES DC TODAYTIES THE OLD RECORD OF 99 SET IN 1991. ...RECORD HIGH TEMPERATURE SET AT WASHINGTON NATIONAL DC...
A RECORD HIGH TEMPERATURE OF 102 DEGREES WAS SET AT WASHINGTONNATIONAL AIRPORT IN DC TODAY. THIS BREAKS THE OLD RECORD OF 101 SETIN 1991. ...RECORD HIGH TEMPERATURE SET AT TRENTON NJ...
A RECORD HIGH TEMPERATURE OF 104 DEGREES WAS SET AT TRENTON NJTODAY. THIS BREAKS THE OLD RECORD OF 99 SET IN 1991. ...RECORD HIGH TEMPERATURE SET AT READING PA...
A RECORD HIGH TEMPERATURE OF 100 DEGREES WAS SET AT READING PATODAY. THIS BREAKS THE OLD RECORD OF 99 SET IN 1955. ...RECORD HIGH TEMPERATURE SET AT PHILADELPHIA PA...
A RECORD HIGH TEMPERATURE OF 101 DEGREES WAS SET AT PHILADELPHIA PATODAY. THIS BREAKS THE OLD RECORD OF 99 SET IN 1991. ...RECORD HIGH TEMPERATURE SET AT WILMINGTON DE...
A RECORD HIGH TEMPERATURE OF 100 DEGREES WAS SET AT WILMINGTON DETODAY. THIS BREAKS THE OLD RECORD OF 99 SET IN 1991. ...RECORD HIGH TEMPERATURE SET AT ATLANTIC CITY NJ...
A RECORD HIGH TEMPERATURE OF 105 DEGREES WAS SET AT ATLANTIC CITY NJTODAY. THIS BREAKS THE OLD RECORD OF 100 SET IN 1991. ...RECORD HIGH TEMPERATURE SET AT GEORGETOWN DE...
A RECORD HIGH TEMPERATURE OF 104 DEGREES WAS SET AT GEORGETOWN DETODAY. THIS BREAKS THE OLD RECORD OF 101 SET IN 1952. ...RECORD HIGH TEMPERATURE SET TODAY AT CENTRAL PARK NY......HISTORIC HEAT ON FRIDAY AT CENTRAL PARK NY...
A RECORD HIGH TEMPERATURE OF 100 DEGREES WAS SET AT CENTRAL PARK NYTODAY. THIS BREAKS THE OLD RECORD OF 99 SET IN 1991. ON FRIDAY...SEVERAL HEAT RELATED RECORDS WERE ALSO SET. A RECORDHIGH TEMPERATURE OF 104 DEGREES WAS SET...WHICH BROKE THE OLD RECORDOF 101 FOR THAT DATE SET IN 1957...AND TIED THE SECOND HIGHEST DAILYHIGH TEMPERATURE ON RECORD...WHICH WAS ALSO REACHED ON JULY 21 1977AND AUGUST 7 1918. THE HIGHEST DAILY HIGH TEMPERATURE FOR CENTRALPARK REMAINS AT 106 DEGREES...SET ON JULY 9 1936. A RECORD HIGH MINIMUM TEMPERATURE OF 84 DEGREES WAS ALSO SET AT THEPARK ON FRIDAY. THIS BROKE THE OLD RECORD OF 80 FOR THAT DATE SET IN1957...AND TIED THE HIGHEST DAILY HIGH MINIMUM TEMPERATURE ON RECORDFOR THE PARK...WHICH WAS LAST REACHED ON JULY 15 1995. THE DAILY AVERAGE TEMPERATURE OF 94 AT THE PARK ON FRIDAY MAY ALSOBE THE HIGHEST DAILY AVERAGE ON RECORD...BUT THESE STATISTICS ARENOT KEPT OFFICIALLY. ...RECORD HIGH TEMPERATURE SET AT ISLIP NY...
A RECORD HIGH TEMPERATURE OF 97 DEGREES WAS SET AT ISLIP NY TODAY.THIS BREAKS THE OLD RECORD OF 95 SET IN 1991. ...RECORD HIGH TEMPERATURE SET AT KENNEDY NY..
A RECORD HIGH TEMPERATURE OF 102 DEGREES WAS SET AT KENNEDY NY TODAY.THIS BREAKS THE OLD RECORD OF 100 SET IN 1972. ...RECORD HIGH TEMPERATURE SET AT NEWARK NJ...
A RECORD HIGH TEMPERATURE OF 102 DEGREES WAS SET AT NEWARK NJTODAY. THIS BREAKS THE OLD RECORD OF 100 SET IN 1955. 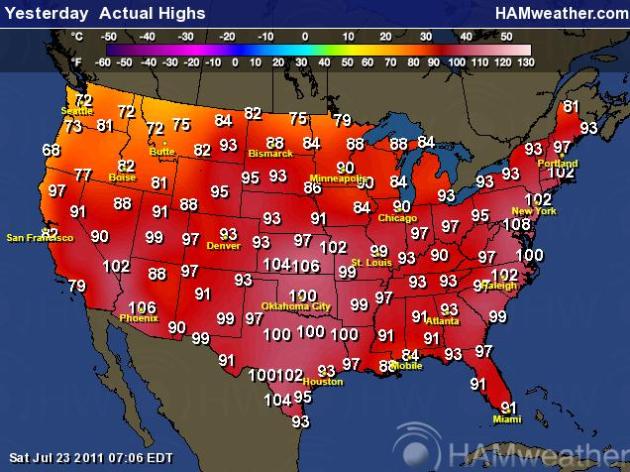
- Consolidated Edison said Friday power use in the New York City area set a preliminary record of 13,189 megawatts as a strong heatwave continued to crank up air conditioning. The record barely eclipsed the previous high of 13,141 MW set in August 2006 before the economic recession weakened demand.
- A stubborn, stifling heat wave that has gripped much of the region for the past week spurred a new record for peak power demand early Friday afternoon from PPL Electric Utilities customers (Penn). The new mark at 7,622 megawatts tops the company's all-time high for summer peak demand of 7,554 megawatts set in 2006, as well as the all-time winter peak of 7,577 megawatts set in 2007.
- To the south, the PJM Interconnection, a regional transmission organization serving 13 states.
- Including New Jersey, Pennsylvania and Virginia, set a new record Thursday for peak power use at 5 p.m., when demand hit 158,450 megawatts. A megawatt is enough electricity to power about 750 to 1,000 homes at any one moment. The grid operator in the Midwest said the region set a new record for peak power demand on Wednesday.
More Records: (how much time to you have?)
Record Heat
Austin, TX 104
Baltimore, MD 102
Washington D.C. 102
North Little Rock, AR 100
Trenton, NJ 104
Reading, PA 100
Philadelphia, PA 101
Wilmngton, DE 100
Atlantic City, NJ 105
Georgetown, DE 104
Shreveport, LA 102
Joplin, MO 105
Topeka, KS 106
Central Park, NY 100
Islip, NY 97
Kennedy, NY 102
Northfolk, VA 103
Salisbury, MD 103
RECORD RAIN
Dickinson, ND 1.41”
Chicago, IL 6.86”
Jackson, MS 1.60” ***still raining
RECORD LOWS
Chicago, IL 6.86”
Jackson, MS 1.60” ***still raining
RECORD LOWS
Burns, ID 37
Butte, MT 35
Meacham, OR 31
Seattle, WA 50
Butte, MT 35
Meacham, OR 31
Seattle, WA 50
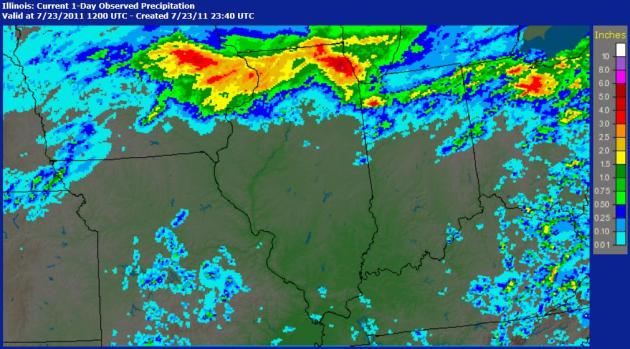
* AS OF 6 AM CDT...CHICAGO OHARE AIRPORT HAS MEASURED 6.85 INCHES OF
RAINFALL.
* 6.91 inches of rain fell between 1 and 7am CT on Saturday morning. Wettest day on record in the city. 8.20 inches of rain has fallen during the past 24 hours.
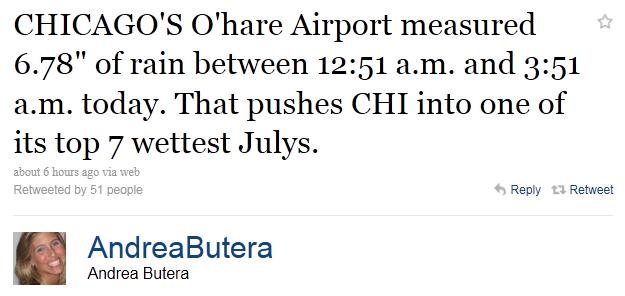
*CHICAGO'S O'Hare Airport measured 6.78" of rain between 12:51 a.m. and 3:51 a.m. today. That pushes CHI into one of its top 7 wettest Julys.
NOAA STATEMENT: AT 557 AM CDT...NATIONAL WEATHER SERVICE DOPPLER RADAR INDICATED
SHOWERS AND THUNDERSTORMS HAVE SINCE EXITED THE WARNED AREA.
HOWEVER...ADDITIONAL THUNDERSTORMS OVER WESTERN AND NORTH CENTRAL
ILLINOIS MAY MOVE ACROSS NORTHEAST ILLINOIS LATER THIS MORNING
PROVIDING ADDITIONAL RAINFALL TO AREAS WHICH HAVE RECEIVED BETWEEN
FOUR AND SEVEN INCHES.
DUE TO THESE HIGH RAINFALL TOTALS...RAPID RISES HAVE OCCURRED ON
MANY RIVERS AND CREEKS IN THE WARNED AREA...AND MAY RISE ABOVE FLOOD
STAGE AS RUNOFF FROM HEAVY RAIN CONTINUES TO DRAIN INTO THE
WATERWAYS...INCLUDING THE NORTH BRANCH OF THE CHICAGO RIVER...THE
DES PLAINES RIVER...THE SKOKIE RIVER AND WELLER CREEK.
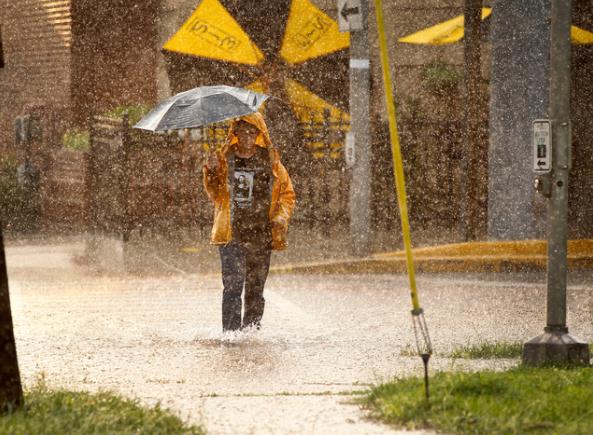
WIDESPREAD AND SIGNIFICANT FLOODING HAS BEEN REPORTED IN THE CITY
OF CHICAGO WITH CARS STUCK IN FLOOD WATERS ON CHICAGO AVENUE AND
THE OHIO STREET RAMP TO INTERSTATE 94 WAS CLOSED. MANY VIADUCTS
HAVE ALSO BEEN FLOODED. ALSO..BOTH IN BOUNDS AND OUT BOUNDS OF
INTERSTATE 190 INTO OHARE HAVE BEEN CLOSED DUE TO FLOODED WATERS.
From earlier this morning: MAJOR FLOODING FORCED CLOSURE OF ALL LANES OF I-94... THE DAN RYAN EXPRESSWAY...IN BOTH DIRECTIONS AT 87TH STREET AND NORTHBOUND AT 67TH STREET.
RAINFALL.
* 6.91 inches of rain fell between 1 and 7am CT on Saturday morning. Wettest day on record in the city. 8.20 inches of rain has fallen during the past 24 hours.
*CHICAGO'S O'Hare Airport measured 6.78" of rain between 12:51 a.m. and 3:51 a.m. today. That pushes CHI into one of its top 7 wettest Julys.
NOAA STATEMENT: AT 557 AM CDT...NATIONAL WEATHER SERVICE DOPPLER RADAR INDICATED
SHOWERS AND THUNDERSTORMS HAVE SINCE EXITED THE WARNED AREA.
HOWEVER...ADDITIONAL THUNDERSTORMS OVER WESTERN AND NORTH CENTRAL
ILLINOIS MAY MOVE ACROSS NORTHEAST ILLINOIS LATER THIS MORNING
PROVIDING ADDITIONAL RAINFALL TO AREAS WHICH HAVE RECEIVED BETWEEN
FOUR AND SEVEN INCHES.
DUE TO THESE HIGH RAINFALL TOTALS...RAPID RISES HAVE OCCURRED ON
MANY RIVERS AND CREEKS IN THE WARNED AREA...AND MAY RISE ABOVE FLOOD
STAGE AS RUNOFF FROM HEAVY RAIN CONTINUES TO DRAIN INTO THE
WATERWAYS...INCLUDING THE NORTH BRANCH OF THE CHICAGO RIVER...THE
DES PLAINES RIVER...THE SKOKIE RIVER AND WELLER CREEK.
WIDESPREAD AND SIGNIFICANT FLOODING HAS BEEN REPORTED IN THE CITY
OF CHICAGO WITH CARS STUCK IN FLOOD WATERS ON CHICAGO AVENUE AND
THE OHIO STREET RAMP TO INTERSTATE 94 WAS CLOSED. MANY VIADUCTS
HAVE ALSO BEEN FLOODED. ALSO..BOTH IN BOUNDS AND OUT BOUNDS OF
INTERSTATE 190 INTO OHARE HAVE BEEN CLOSED DUE TO FLOODED WATERS.
From earlier this morning: MAJOR FLOODING FORCED CLOSURE OF ALL LANES OF I-94... THE DAN RYAN EXPRESSWAY...IN BOTH DIRECTIONS AT 87TH STREET AND NORTHBOUND AT 67TH STREET.
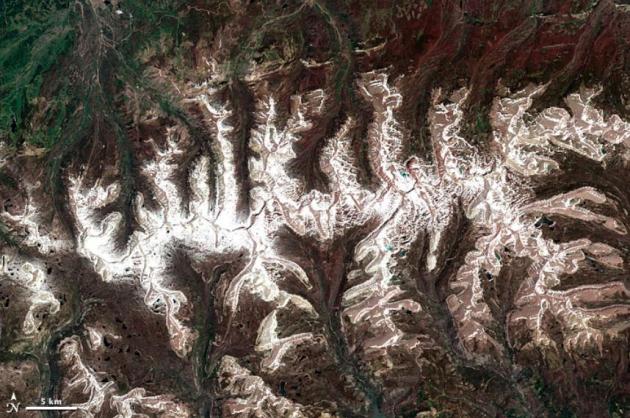
"By July in a typical year, the snow that covers the slopes of the Rocky Mountains has given way to grasses and wildflowers, leaving only the peaks capped in white. But 2011 has not been a typical year. As this image of the Uinta Mountains in northeast Utah shows, winter’s snow is lingering into summer. On June 26, the snowpack on the southern face of the range was 849 percent above average. The northern face had 892 percent more snow than average. The image above was taken by the Landsat 5 satellite on July 15, 2011. The lower image, also from the Landsat 5 satellite, shows more representative conditions on July 9, 2003. In the lower image, snow snakes along the high ridgelines, while the slopes are bare. Snow is a much more dominant part of the scene in 2011."

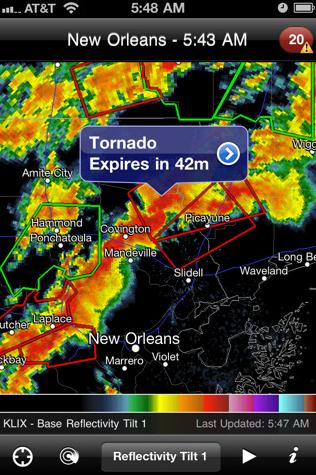
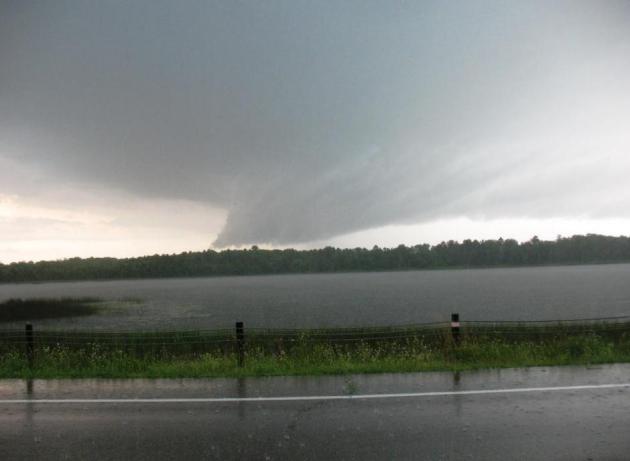
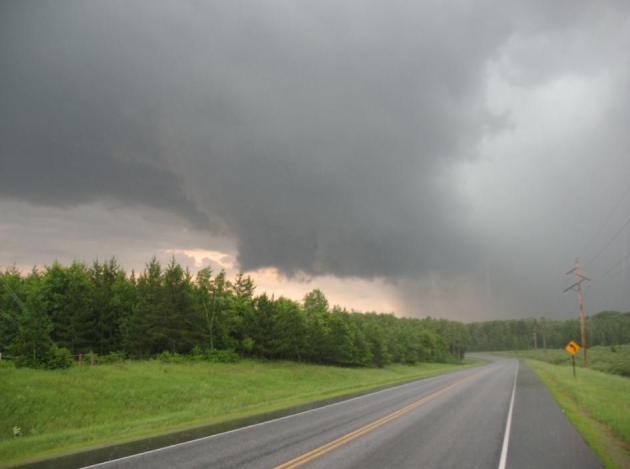
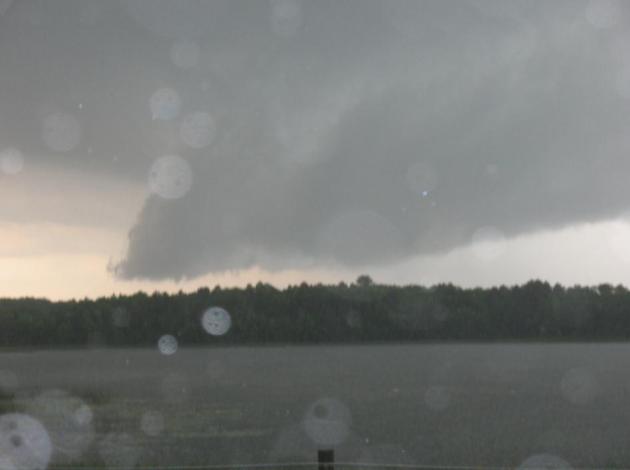
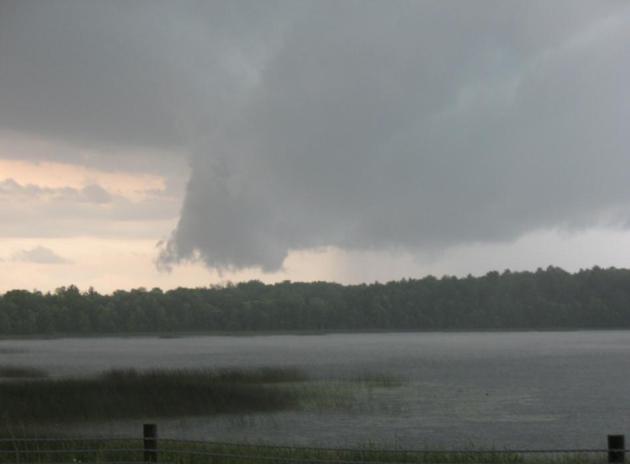
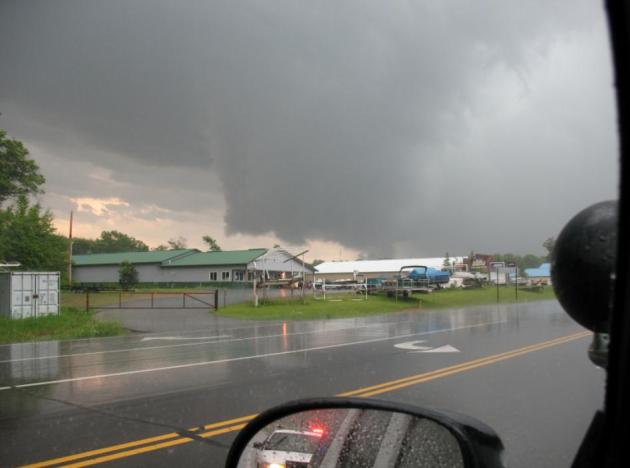
"Metro Mentality
Folks up north have a quaint term for metro residents who flee to their favorite northern lakes in search of watery fun. "Citiots". Nice.
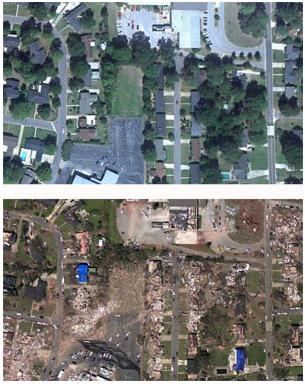
On Saturday I had a discussion with a Brainerd Lakes police officer, worried about an increase in severe storms, and a growing sense of apathy; the "it can't happen here" syndrome. "People who live in the Twin Cities come north, expecting the same level of protection & preparedness they have in the metro area," he said. "It doesn't exist." Many campgrounds and smaller towns don't have access to emergency sirens. What would you do if a Wadena-size, EF-4 tornado was steamrolling toward your cabin or camp site? Does your family have a plan? Do you have a $30 NOAA Weather radio, or warning apps loaded on your smartphone? The more sources of warning information, the better. More on my blog.
Climate Stories...
Why Global Warming Slowed In the 2000's: Another Possible Explanation. The story from knoxnews.com: "The world is getting progressively warmer, and the vast majority of evidence points to greenhouse gases spewed into the atmosphere by humans — carbon dioxide (CO2), especially — as the main culprit. But while the buildup of greenhouse gases has been steadily increasing, the warming goes in fits and starts. From one year to the next it might get a little warmer or a lot warmer, or even cooler. That’s because greenhouse gases aren’t the whole story. Natural variations in sunlight and ocean currents; concentrations of particles in the air, manmade and otherwise; and even plain old weather variations can speed the warming up or slow it down, even as the underlying temperature trend continues upward. And while none of those factors is likely to change that trend over the long haul, scientists really want to understand how they affect projections of where our climate is heading. The latest attempt to do so just appeared in Science Express, the online counterpart of the journal Science, where a team of climate scientists is reporting on their investigations of airborne particles, or aerosols, in the stratosphere. It’s well known, says co-author John Daniel, of the National Oceanic and Atmospheric Administration’s Earth System Research Laboratory in Boulder, Colo., that these particles have a cooling effect, since they reflect sunlight that would otherwise warm the planet." (photo courtesy of reason.com).
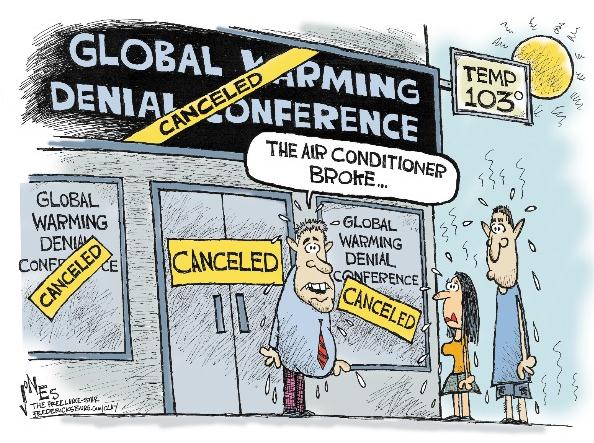
Global Warming Denial. Thanks to cartoonist Clay Jones and fredericksburg.com for keeping a sense of humor during these extreme Dog Days of summer, and pointing out the hypocrisy of climate change deniers. It's ok to poke fun at warming when it snows, but during a month-long heat wave you don't hear much from the likes of Senator Imhofe and other (oil-soaked) politicians: "One of the many reasons that makes a right-wing nut job a right-wing nut job is their denial that man is changing the climate…or that the climate is changing at all. To deny climate change you have to adjust data, make stuff up, leave out information that supports your cause and listen to a few discredited scientists who are rarely, if ever, published in serious publications. It also doesn’t hurt if you’re party of a think tank that’s funded by corporations that desire lesser EPA regulations. To believe climate change is real all you have to do is walk outside. A lot of cartoonists, right-wing nut job cartoonists, do cartoons when it’s cold in January saying “Aha! Take that you global warming freaks! It’s snowing in Chicago!” These same cartoonists are silent on the issue in July and August. To pursue science in this issue, one should leave out the financial and political implications of your argument. Use real research. There are some climage change believers who use it for their politics, but a HUGE majority of scientist believe in climate change…and there’s not any politics to it. Those who deny climate change use it for their politics. Even the annual conference of some sort that denies climate change is funded is large part, if not entirely, by corporations that need fewer EPA regulations."