"...All 12 months saw an increase in the normal low temperature, but January's 3.2-degree rise was emphatic and double the next-steepest increase, according to the report released Friday. Normal highs, meanwhile, rose for nine of 12 months in the Twin Cities. January's 1.8-degree jump also led that category....For the Twin Cities, the new normal is mostly wetter and certainly warmer than what was normal from 2001 to 2010. Normal annual precipitation is now 30.6 inches, up 1.2 inches from the previous mark and the highest since the 30-year normals began in 1960." - Star Tribune article on the "new normals", details below.
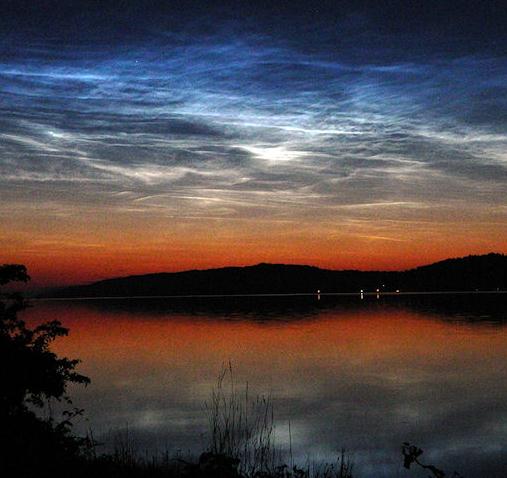
Photo Of The Day. Thanks to spaceweather.com for a spectacular example of "noctilucent clouds". These clouds form at dusk in the upper levels of the troposphere, possible the stratosphere. They are rare, mysterious, and on the increase - some climatologists theorize that climate change may be responsible for these clouds become more frequent with time: "On July 1st and 2nd, a bank of rippling electric-blue noctilucent clouds spilled across the Canadian border into the lower United States. In doing so, the clouds made their farthest excursion of the year away from the Arctic, their usual environment. "These were the most brilliant NLCs I have ever witnessed!" reports Steven Rosenow, who sends this picture from Washington state."
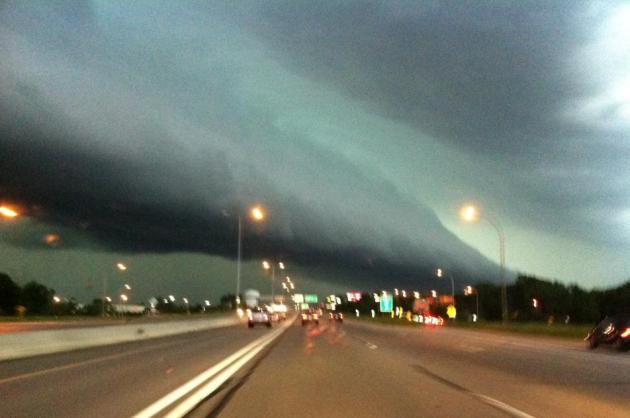
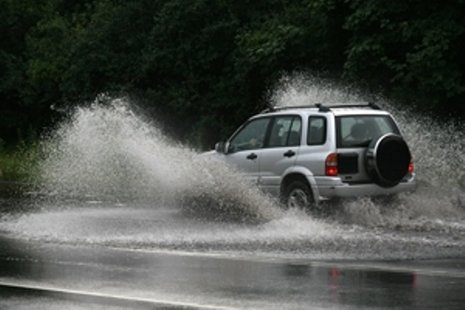
Second Photo Of The Day. OK, I was driving when I snapped this photo with my iPhone, that's why it's not in sharp focus. This is a shelf cloud, marking the leading edge of a severe thunderstorm that swept into the metro area Friday evening, unleashing straight-line winds in the 50-70 mph range. I took this near Ridgedale, heading west, driving right into blinding rains and horizontal hail. I know, not smart.
June Records. Yes, it was a month of wild extremes across the USA. From flood to drought, record chill to record heat, snow, fire, flood (and western snows). Am I missing anything here? No volcanoes - that's a good thing. Here are just a few of the many records set last month:
Miami Beach: Driest June on record 1.15”. Previous record 1.45”
Midland, TX: Highest average monthly temp 88. Previous 86.5 in June 1990. Previous highest overall (all months) 87.2 August 1964. Record no rain June 2011 in Midland. Old record 0.01 in June 2001
San Angelo, TX: Hottest average monthly temp 88.6. Old record 88.2
San Angelo, TX: Hottest average monthly temp 88.6. Old record 88.2
Philadelphia, PA: 9th warmest June on record 75.4
Atlantic City: 3rd warmest June 74.3
Alamosa, CO: Record dry June...only a trace
Louisville, KY: thru June 30th...2nd wesstest year @ 41.26”
Austin Mabry, TX: 2nd warmest June 87.1
Del Rio, TX: 3rd Warmest June 88.0
San Antonio, TX: 4th warmest June 86.2
Austin (Bergstrom): 4th warmest June 85.3
Smith, AR: Warmest June on Record 85
Wichita Falls: Warmest June on Record. Greatest number of days reaching 100 degrees...28
Tulsa, OK: 2nd Warmest June 84.4
Fort Smith, AR: record for most days at or above 90....30 days
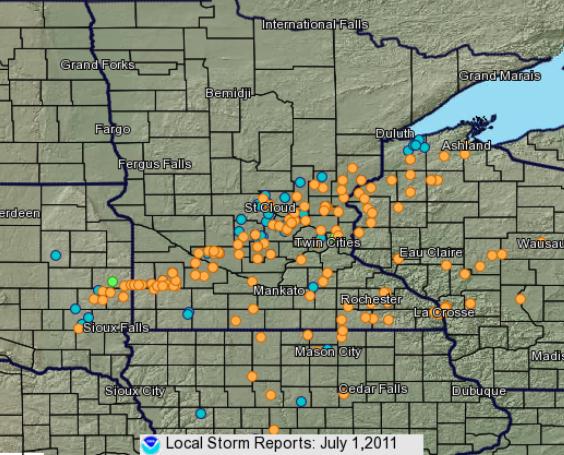
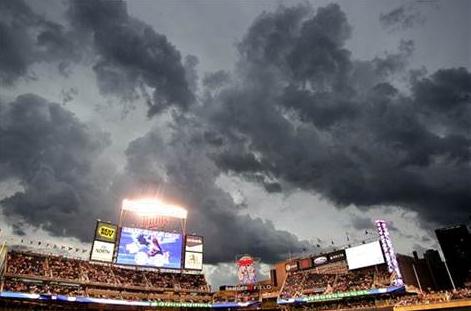
Fierce Storm Surprises Wisconsin Campers, Child Killed. Photo credit: "Storm clouds hover over Target field delaying the baseball game between the Milwaukee Brewers and the Minnesota Twins, Friday, July 1, 2011 in Minneapolis. (AP Photo/Andy King)" MSNBC.com and AP have the details: "GRANTSBURG, Wis. — A fierce thunderstorm swept through a rural Wisconsin county that was packed with holiday campers, toppling trees that killed an 11-year-old girl, blowing boats ashore and injuring more than three dozen people, officials said Saturday. The storm moved across Minnesota and Wisconsin on Friday, packing winds approaching 80 mph and hail as large as softballs. In northwestern Wisconsin's Burnett County, at least 39 people went to hospitals after the storm toppled hundreds of trees and left several thousand utility customers without power. Authorities said most of the injured were treated and released, but three were in critical condition Saturday evening. Heavy winds upended boats in the area and blew them ashore, while an airport hangar in neighboring Douglas County collapsed onto a single-engine plane. Searches were conducted The storm came at one of the worst times of the year for rural Burnett County: a summer holiday weekend, when the area's lakes and rivers attract tens of thousands of visitors, said Rhonda Reynolds, a regional director for Wisconsin Emergency Management."
Lamberton 8.44 inches
Cook 7.92 inches
Faribault 7.91 inches
Lake City 7.89 inches
Rushford 7.57 inches
La Crescent 7.16 inches
Theilman 6.61 inches
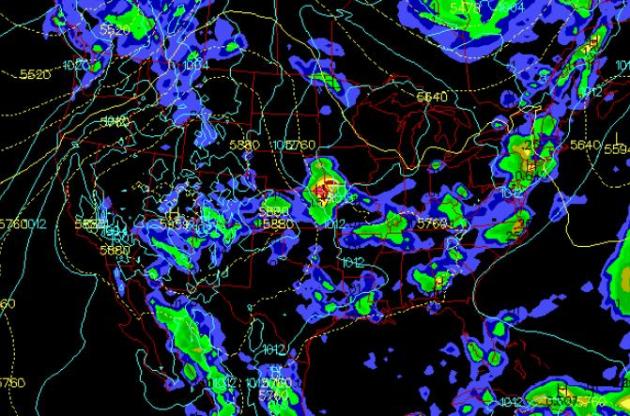
Sunday Weather: A Parade Of Thunderstorms. Strong/severe storms are most likely from Iowa and Missour east to the Carolinas, an eastbound cool front sparking scattered showers and storms frm Boston and New York southward to D.C. A few T-storms may fall on Arizona and New Mexico, higher humidity levels helping firefighting efforts in both states. Dry weather should be the rule form the Great Lakes westward to the Dakotas. A few storms over Montana may turn severe.
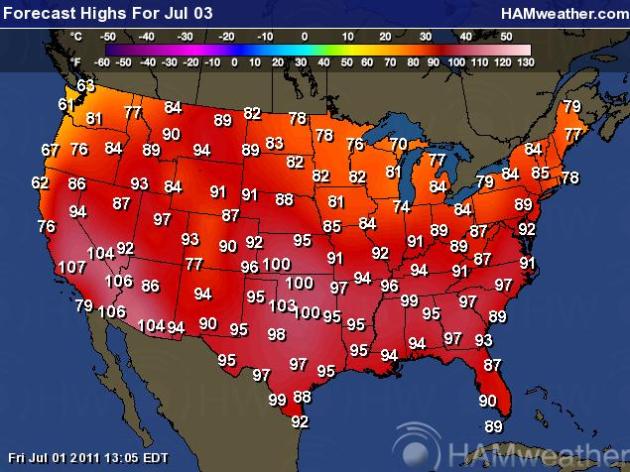
Sunday Highs. More 100s today from California eastward to the central and southern Plains. New England enjoys 70s and low 80s, with comfortable weather (low humidity) over the Great Lakes states, while the Upper Midwest begins to warm up again with higher humidity levels.

Too Dry For Fireworks? According to the Wall Street Journal: More fires are reported on July 4 than on any other day in a typical year, and fireworks account for more than half the fires, according to the National Fire Protection Association. Fireworks caused an estimated 18,000 fires during 2009, the most recent year reported, leading to 30 civilian injuries and $38 million in property damage, the association said.
In Oklahoma, 36 counties suffering from extreme to exceptional drought have issued burn bans, which include a prohibition on fireworks except for public displays.
In Kansas, fireworks have been banned in Dodge City and surrounding rural areas due to the extreme drought.
In Louisiana, fireworks have been banned in Shreveport and neighboring Bossier because of extreme heat and drought.
In Texas, 170 counties have fireworks bans, including all of metropolitan Houston. Nearly all of Texas has burn bans as well. Because of the extreme drought, Fourth of July fireworks displays have been canceled in Texas towns large and small: San Antonio, Austin, Amarillo, Lubbock, Plainview, Magnolia, Tomball, DeSoto, Woodlands, Roman Forest, and Patton Village.
In Arizona, authorities have banned fireworks from Flagstaff in the north to Tucson, Douglas and Sierra Vista in the south.
In New Mexico, Gov. Susana Martinez (R-NM) has said that there is “absolutely no reason to buy, sell or use personal fireworks.” She has declared a “state of emergency in New Mexico regarding the use of fireworks.” Albertson’s, WalMart, and Smith’s stores have stopped selling fireworks in the state. Taos, with wildfires raging nearby, has canceled its fireworks display.
In Joplin, Missouri, where a devastating tornado hit on May 22, officials have banned fireworks because of the amount of combustible debris in the tornado’s path.
In Massachusetts, the historical recreation site Old Sturbridge Village has canceled its fireworks display because its fireworks launch site was flooded and alternative launch sites were damaged by tornadoes.
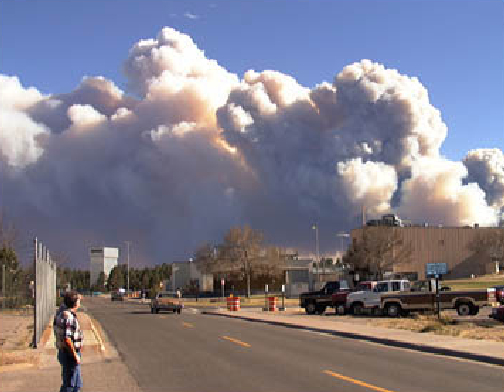
Los Alamos Blaze Now Largest In New Mexico History. The "Las Conchas" fire has charred over 103,000 acres, making it the largest in New Mexico history. NASA is monitoring carbon monoxide levels from low-orbit. Why? "Detecting nitrogen dioxide is important because it reacts with sunlight to create low-level ozone or smog and poor air quality. The fire has blackened more than 162 square miles in the last six days, making it the largest fire in New Mexico history. Erratic winds and dry fuels helped it surpass the 2003 Dry Lakes fire, which took five months to burn through 94,000 acres in the Gila National Forest. The Los Alamos National Laboratory remained closed, and fire officials said there was no chance the thousands of evacuated residents and lab employees would be able to resume their normal lives Friday."
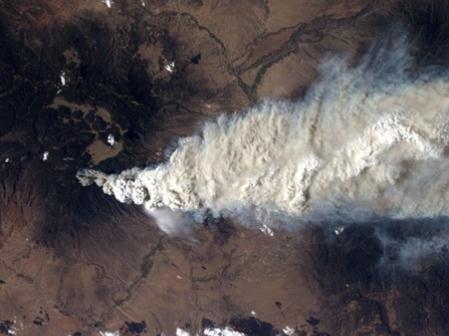
More On Las Conchas Fire. The Washington Post's Capital Weather Gang has the story. So far, in just the last 2 weeks, both Arizona and New Mexico have experienced their largest respective fires in state history. Photo above: "A crew member aboard the International Space Station, flying at an altitude of approximately 235 statute miles on June 27, 2011, exposed this still photograph of a major fire in the Jemez Mountains of the Santa Fe National Forest in north-central New Mexico. The fire is just southwest of Los Alamos National Laboratories. (NASA) The Las Conchas wildfire burning along the western edge of Los Alamos National Laboratory in New Mexico has grown to more than 103,800 acres (according to the Associated Press), making it the largest forest fire in New Mexico history. This new record has been set less than month after the Wallow fire in Arizona became the largest in state history, burning more than 470,000 acres. And firefighters have responded to nearly 1500 wildfires in Texas this year, which have burned a record3.3 million acres. The old Texas record was 1.98 million acres in 2006 (records have been kept for 25 years) according to Amarillo.com."

Record Heat On Saturday:
Phoenix, AZ: 117 *hottest day in Phoenix since July 21 2006 when it was 118.
Longview, TX: 104
Joplin, MO: 103
Monroe, LA: 102
New Orleans: 100
New Iberia, LA: 100
Toledo, OH: 98
In Stark Contrast:
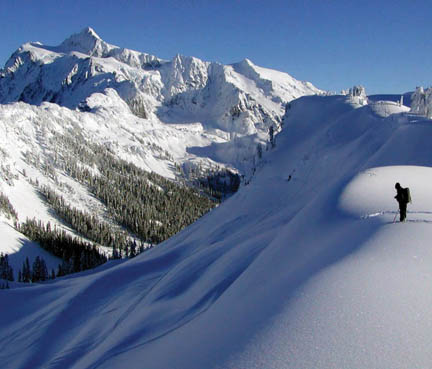
Road To Artist Point (Washington) Buried Under 50 Foot Drifts. Snow 50 feet deep still buries the road (State Route 542) to Artist Point at Mount Baker and will keep the upper portion of the road closed all summer. “This is the deepest snow I’ve seen since the world-record year 1999, when the highway didn’t open for the summer.” WSDOT will forgo clearing the last two miles of snow-covered highway to the upper parking lot because the snow is simply too deep and would take too long to clear. The work would tie up maintenance crews for the next two months when they could be working on other state priorities like fixing potholes, signs and guardrail. “The restroom in the upper parking lot is nowhere to be seen. The road to Artist Point is 2.7 miles long and more than 5,000 feet above sea level, and is typically buried under snow and closed October through June. In recent years, it has usually opened in July.
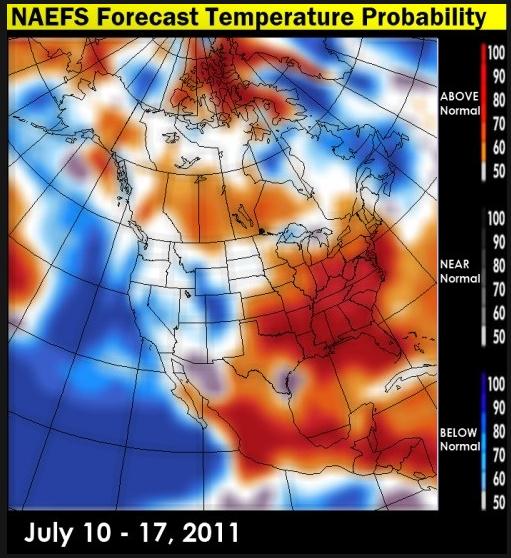
Growing Heatwave. Map above courtesy of Environment Canada. Meteorologist Larry Cosgrove has some insights into the unfolding weather pattern in his WEATHERAmerica newsletter at examiner.com. Looks like Minnesota will be on the northern edge of a massive heatwave that will cover much of America through mid July, stretching from the Plains to the East Coast.

PUBLIC INFORMATION STATEMENT
NATIONAL WEATHER SERVICE LUBBOCK TX
1111 AM CDT FRI JUL 1 2011
...JUNE 2011 WAS THE HOTTEST MONTH ON RECORD FOR LUBBOCK TEXAS...
THIS MAY NOT COME AS NEWS TO ANYONE WHO HAS ENDURED THE RECENT HEAT
WAVE OVER THE SOUTHERN PLAINS OF WEST TEXAS...BUT TEMPERATURES AT
LUBBOCK TEXAS FOR THE MONTH OF JUNE WERE THE HOTTEST EVER RECORDED...
AVERAGING 85.9 DEGREES. THIS BROKE THE ALL-TIME RECORD FOR THE HOTTEST
MONTH EVER AT LUBBOCK...PREVIOUSLY 85.4 DEGREES FROM JULY OF 1966.
THE HIGHS FOR THE MONTH OF JUNE 2011 AT LUBBOCK ALSO WERE THE
HOTTEST EVER RECORDED OVER AN ENTIRE MONTH...AVERAGING 100.8 DEGREES.
THIS BROKE THE PREVIOUS RECORD OF 99.5 DEGREES SET IN AUGUST 1943.
April 14-16, 2011
At least 200 tornadoes were confirmed across 16 states killing an estimated 38 people. The three-day outbreak spread from the Great Plains on the first day, to Mississippi and Alabama the second, then swept through the Carolinas and Virginia on the third.
- NSSL Rotation Tracks file for April 16 (Eastern U.S., .kmz, 10.81 MB)
- Preliminary Tornado Tracks (4/16/2011) in the Raleigh area (click on tracks to see storm survey information)
- Outbreak Summary, Blacksburg, VA NWSFO
April 27-28, 2011
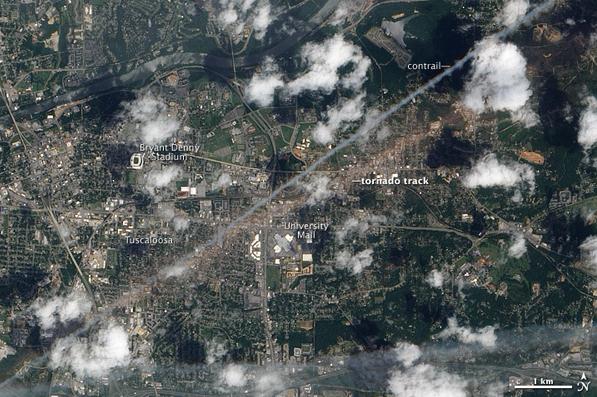
The April 27-28 tornado outbreak will go on record as the deadliest two-day period for tornadoes since 1936. More than 300 people were killed in Mississippi, Alabama, Georgia and Tennessee by an estimated 305 tornadoes. The outbreak of tornadoes began during the early morning of April 27 and ended during the early morning hours of April 28.
- NSSL Rotation Tracks file for April 27 (Continental U.S., .kmz, 15.1 MB)
- Preliminary Tornado Tracks (4/24–4/29/2011), NWS Southern Region HQ
- Tuscaloosa-Birmingham Tornado Summary, Birmingham, AL NWSFO
- Cordova Tornado Summary, Birmingham, AL NWSFO
- Outbreak Summary, Blacksburg, VA NSWFO
- NOAA Aerial Imagery of Storm Damage
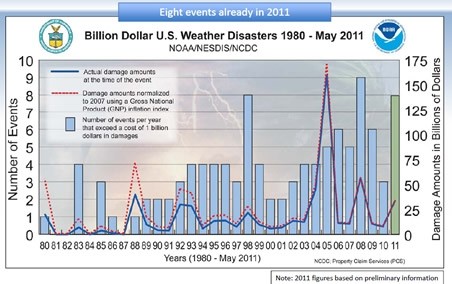
How Much Does A Hurricane Cost? AccuWeather has some estimates: "$1.8 billion (2011 adjusted) is the median amount of damage caused by an Atlantic hurricane that hits land in the United States. The median cost is the most accurate measure of the middle of the data because Hurricane Katrina's immense damage, at $145 billion (2011 adjusted), inflates the average cost of a hurricane to close to $9 billion. Take a look at the numbers: estimated damage in billions from hurricanes that directly hit the United States from 1980 to 2010. You can read the data and comment on Scribd."


Climate Stories...
Extreme Weather And Climate Science. The ABC Network in Australia has an eye-opening interview with climate scientist Kevin Trenberth: "One of the world's leading climate scientists, Kevin Trenberth, explains what's causing recent wild weather and why he has no doubt that humans are contributing to the increased incidence and severity of these weather events. He'll be speaking at the Earth on the Edge conference in Melbourne later today which has brought together more than 4,000 earth scientists and experts from more than 100 countries."
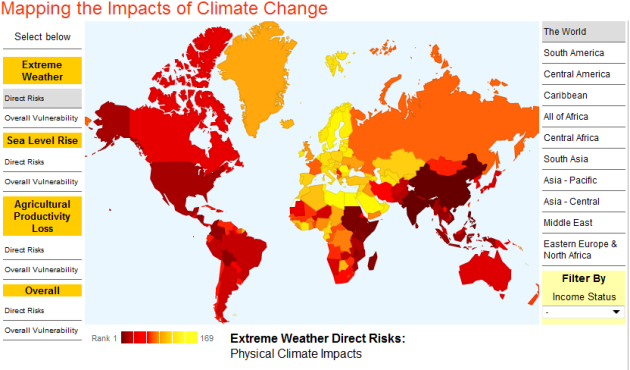
Global Interactive Map Of Climate Change Impact. Here's an interesting article from Humanosphere: "The Center for Global Development has created a great interactive map illustrating the relative impact of climate change on nations. The map is based on data predicting impacts caused by extreme weather events, sea level rise, agricultural productivity losses and overall rankings. No single nation ranks high risk in all categories. But clearly, Africa, India and other parts of Asia are predicted to fare the worst. Go to the link above to use the interactive map and. This is just a screen grab."