Weather conditions have certainly been a little more active as of late. The loop below shows two particular storms that we will be tracking. From heavy rain and severe weather potential to heavy snow across parts of the Great Lakes and Mountain West, it'll be active through next week.
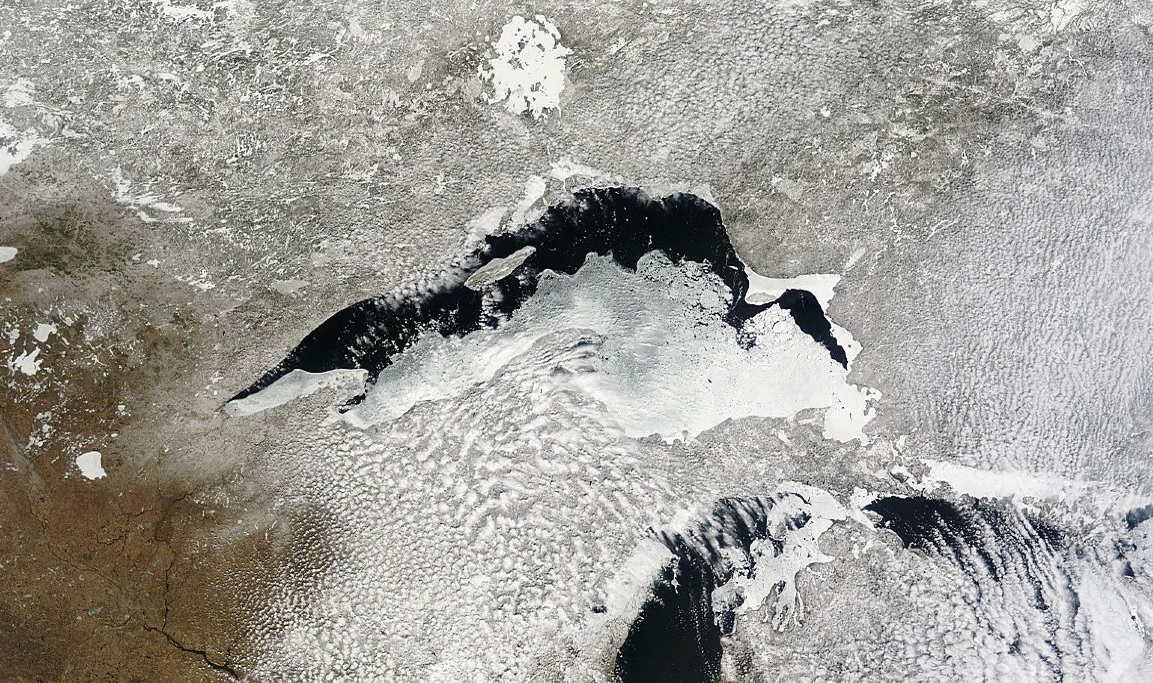
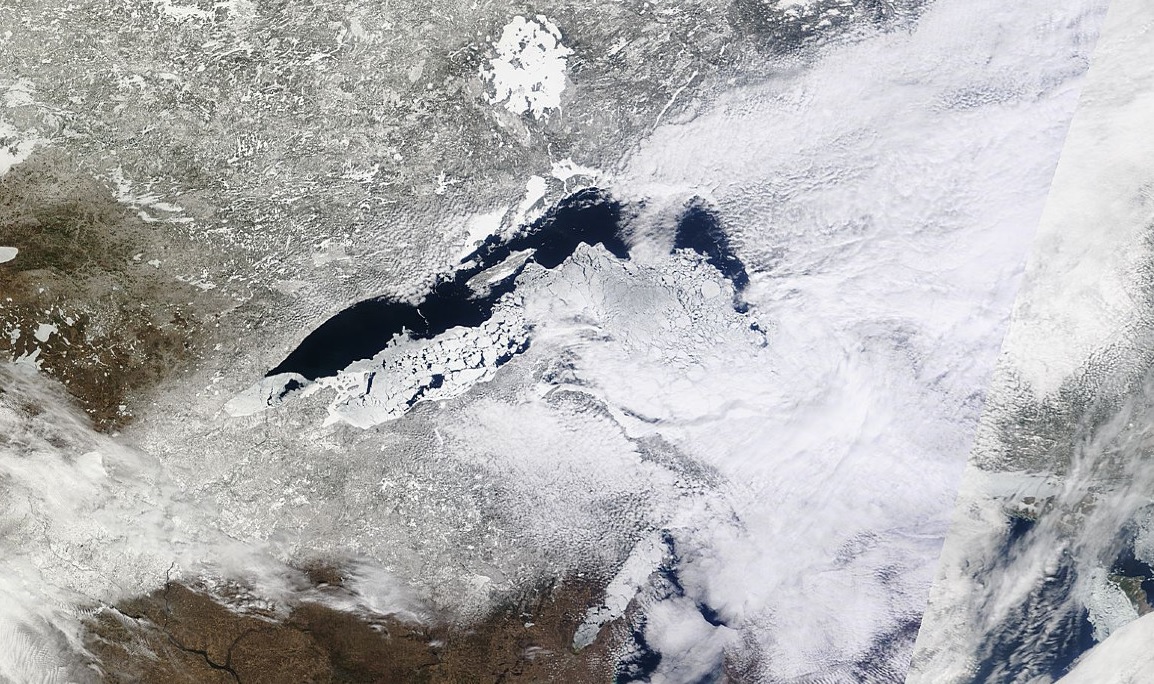
Lake Superior IceLake Superior early this year saw a peak ice coverage near 95%, but is currently down to 59.6%. Here were some visible satellite images from just a few days ago to show you how much ice there still is on Lake Superior.
Tuesday, April 15th
Note that you can also see Lake Mille Lacs, Leech Lake and Lake Winnibigoshish are still ice covered.
Friday, April 18th
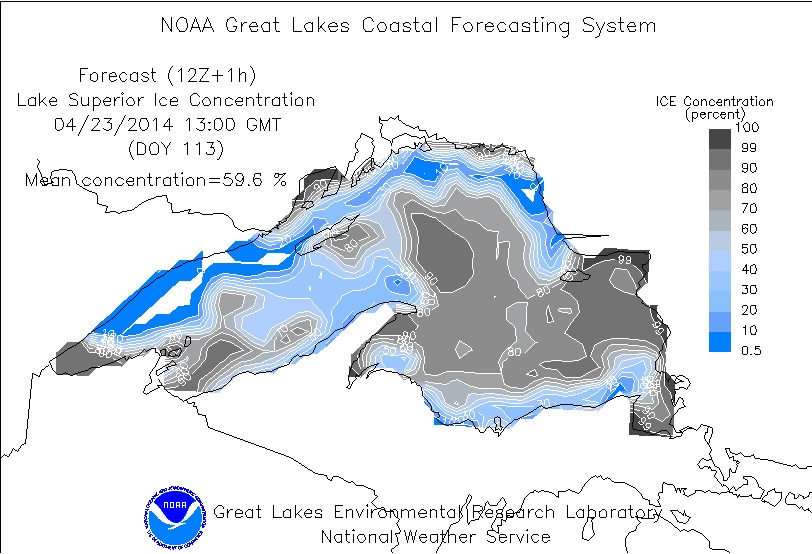
Wednesday, April 23rd
According to NOAA's GLERL, Lake Superior was still nearly 60% ice covered as of Wednesday, April 23rd. This is actually having an impact on the early shipping season...
Great Lakes Ice
According to NOAA's GLERL, the Great Lakes were still nearly 34% ice covered as of Tuesday, April 22nd. Interestingly, this is nearly 20 times more ice than the long term average.
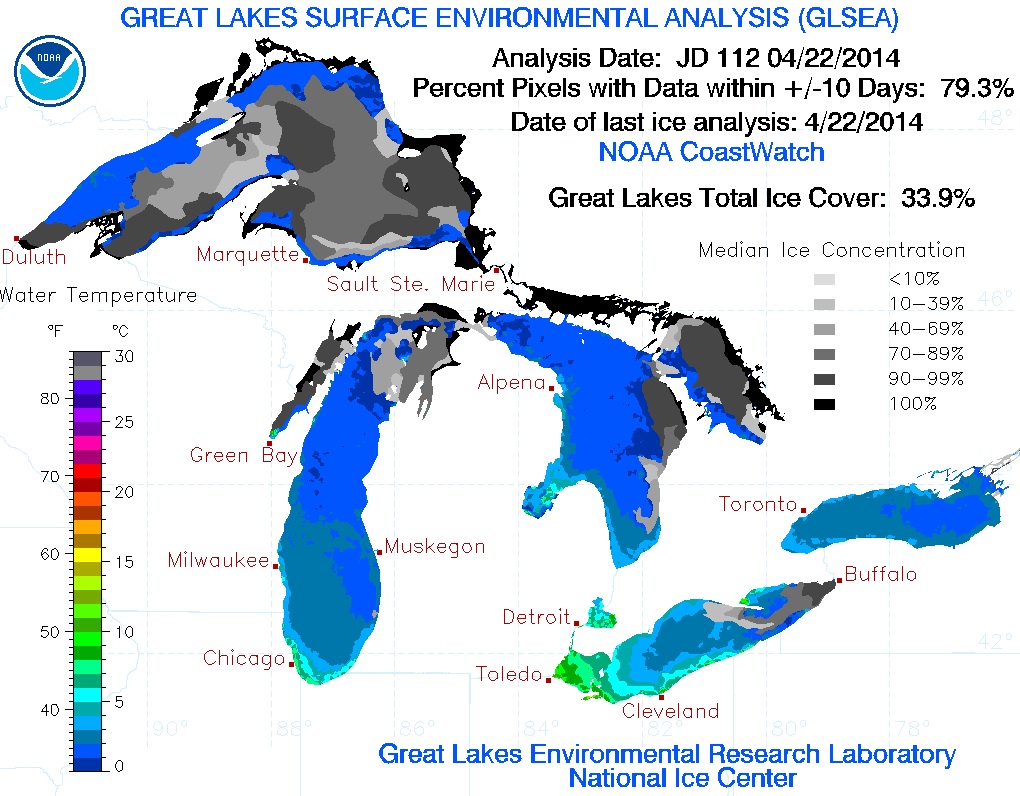
Record Levels of Great Lakes Ice?
The Capital Weather Gang has a nice, brief write-up about the recent high levels of Great Lakes ice this late in the season.
"It’s almost May and a third of the Great Lakes is still covered by ice. This is unprecedented in records dating back more than three decades, and it’s not even close.
Environment Canada’s Great Lakes ice dataset, which extends back to 1980-81, shows the current ice extent at a chart-topping 32.8 percent as of April 22. The year with the next greatest ice extent on this date, 1996, had about half as much ice – or 16.49 percent coverage. The average Great Lakes ice cover right now is 2.2 percent. There is roughly 16 times more ice than normal right now!"
See more from the WashingtonPost.com HERE:
Active Weather Continues
The higher resolution model below shows our first strong storm system wrapping up across the middle part of the country through the second half of the work week, while another strong storm system moves into the West Coast.
Severe Threat Thursday
Our current storm system in the middle part of the country will kick out some strong to severe storms on Thursday across parts of the Mississippi River Valley. Hail and high winds look to be the primary threat, but an isolated tornado can't be ruled out.
Strong Pacific Storm
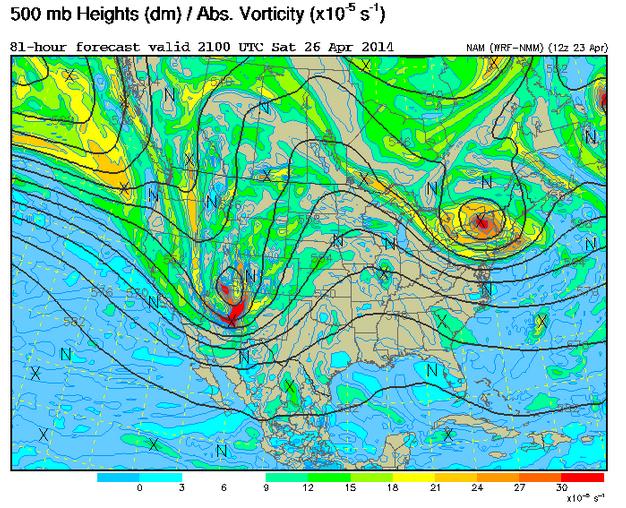
The next storm that we will be watching will be the impulse of energy moving into the western part of the country by late week. The 500mb vorticity (spin) map, shows a fairly stout disturbance moving into the Southwest over the weekend. As this particular storm system works out into the Plains, strong to severe storms look to once again push across the middle part of the country.
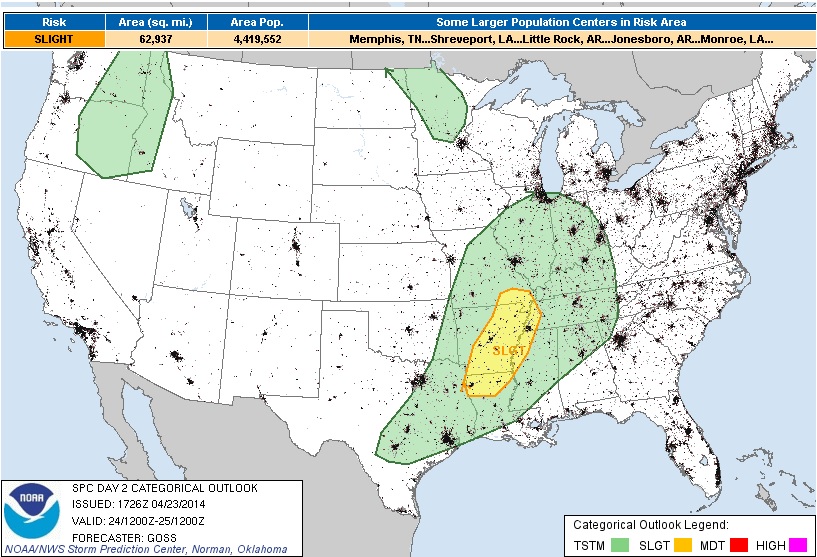
 Severe
 Storms Ahead?
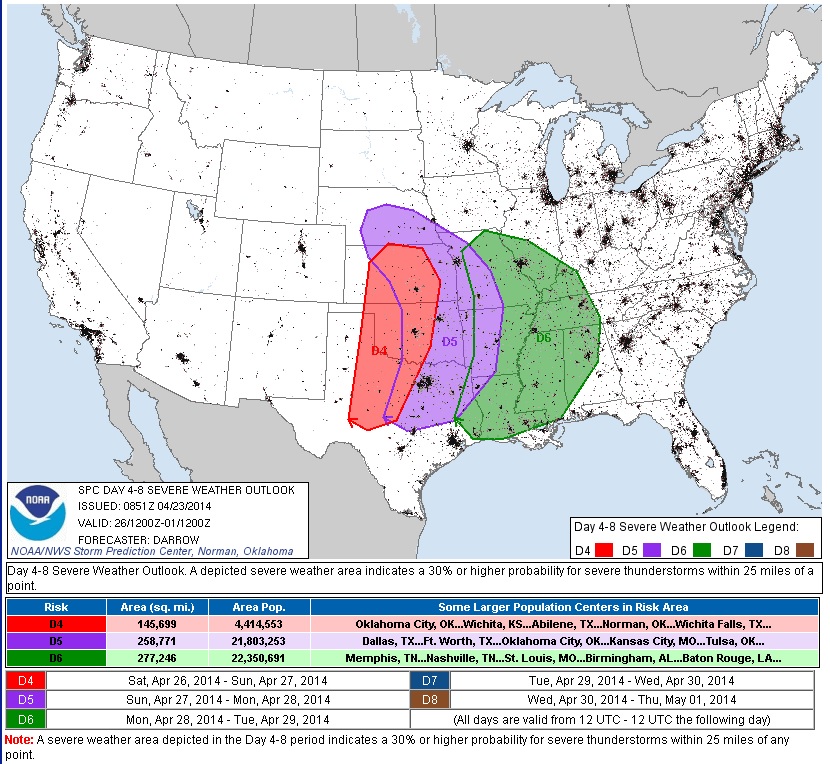
The Storm Prediction Center has already issued severe weather outlooks from Saturday through Monday for the areas below. The deepening area of low pressure looks to kick out a multi-day severe weather potential.
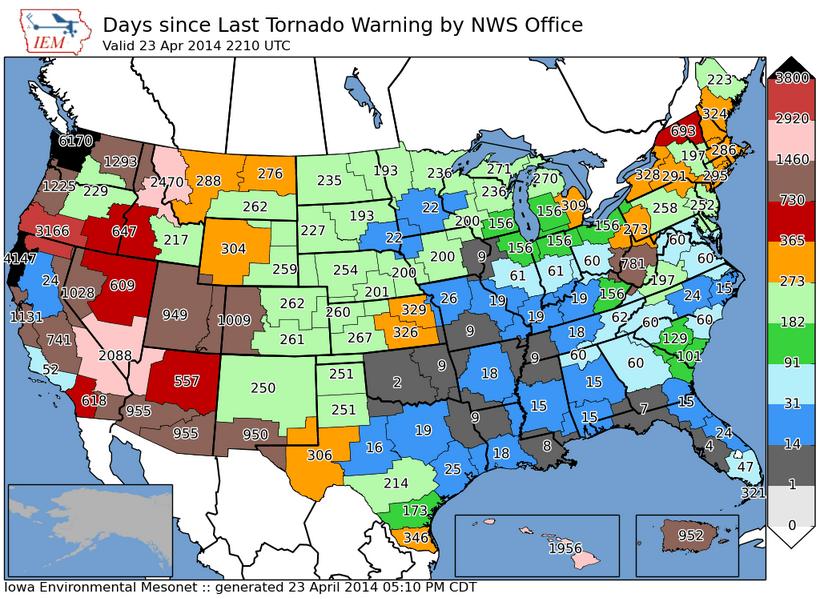
Days Since Last Tornado Warning
This is an interesting map that shows how many days it's been since we've seen a tornado warning in any particular National Weather Service county warning area. note that it has been nearly a year since we've seen a tornado warning in parts of eastern Kansas since the last tornado warning.
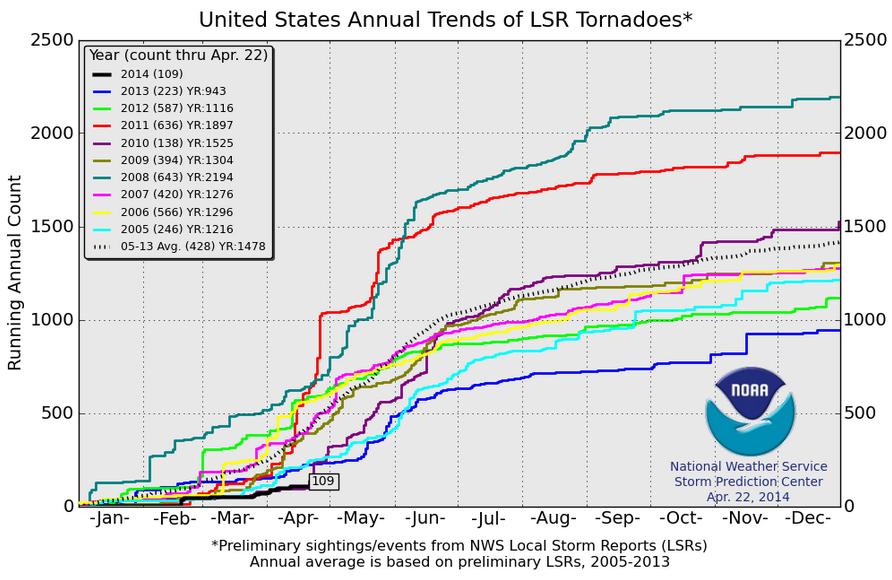
2014 Tornado Count
According to the Storm Prediction Center, the 2014 PRELIMINARY tornado count through April 22nd is at a very low 109 reports. The 2005-2013 average through April 22nd is 428 reports! In 2013 we saw just 223 reports through that date, while in 2008 there had been a whopping 643 reports through that date!
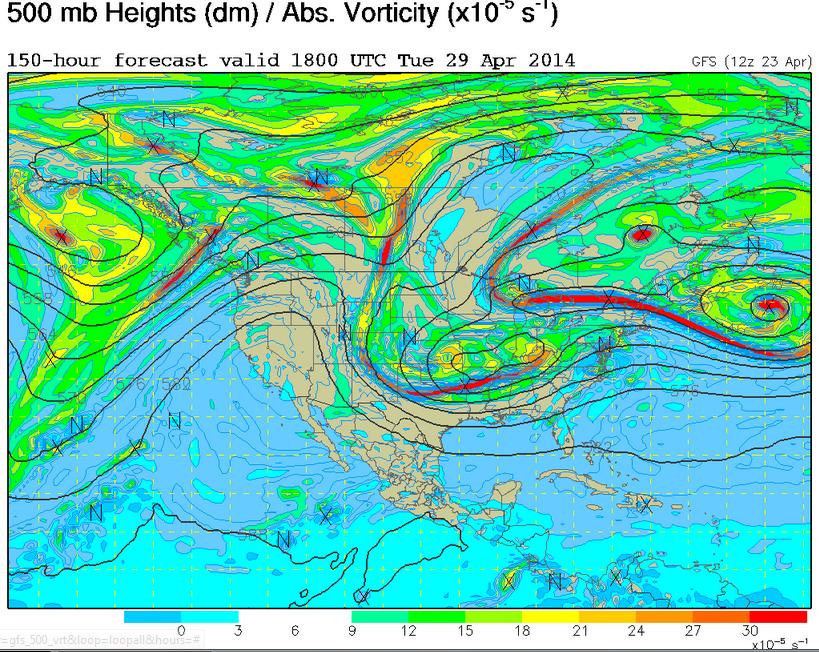
High Amplitude Weather Pattern
The strong storm that looks to kick out several days of strong to severe thunderstorms, looks to also nearly stall across the central/eastern part of the nation. The end result will be a just stream that will get all bent out of shape, this type of weather pattern is known as a High Amplitude weather pattern, which means that weather tends to get stuck... The image below shows the 500mb vorticity (spin) map for Tuesday, April 29th. Note how the lines bubble north in the western third of the country, while the lines dip south across the eastern two-thirds of the nation. This will dictate warming and cooling and it certainly looks warm/hot in the Southwest, while it appears to be quite chilly in the eastern two-thirds of the nation.
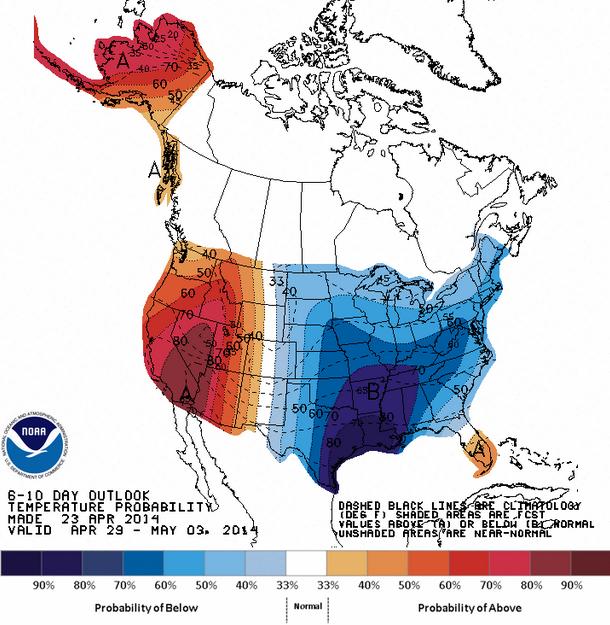
Temperature Outlook
Take a look at NOAA's HPC 6 to 10 day temperature outlook, which will take us into early May. Note that the temperature trends from April 29th to May 3rd mirror what the jet stream will look like next Tuesday, April 29th. Next week is going to feel very March-like...
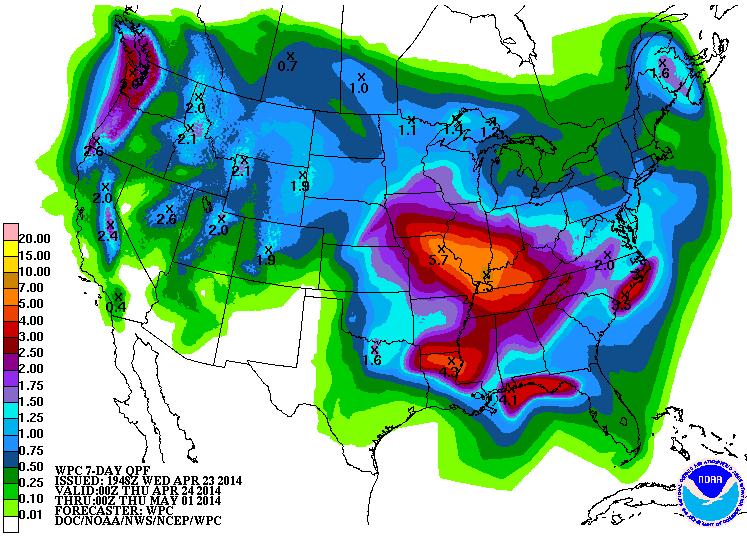
Precipitation Outlook
According to NOAA's 7 day precipitation outlook, it looks quite wet across much of the nation through early next week. As our 2 storm systems plow across the nation, heavy rainfall from convective type showers will likely several inches of precipitation in the central part of the country.
Thanks for checking in and have a great rest of your week! Don't forget to follow me on Twitter @TNelsonWNTV