Dazed & Amazed
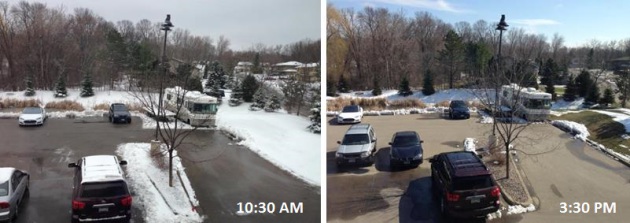
There was at least one Minnesotan excited to see snow on Wednesday. My youngest son took a few days off from Navy aviation, got off the plane and promptly tweeted photos of the snow to his friends in Pensacola, Florida. The excitement was palpable. He may have been the ONLY person happy to see big, fat flakes falling in mid-April.
Another head-shaking, jaw-dropping weather moment - a 20 inch variation in snow; from a coating of slush at MSP International to 20 inches at North Branch. Wow.
Any slush in your yard is doomed, considering the sun is as high in the sky as it was on August 24. Spring isn't on a dimmer switch; it's either ON or OFF.
Our temperature roller coaster reverses course, topping 50F today; 60s likely this weekend with a late-day thundershower possible Saturday. As the front stalls a shower may linger on Easter Sunday. At least it'll be a lukewarm rain.
The extended outlook next week calls for bright green: a streak of balmy 60s leading up to heavy showers/storms by Wednesday & Thursday.
According to Rhett Bollinger at MLB.com yesterday's 31F reading at Target Field made it the coldest Twins game on record. Is snow season over? I think so.
Place your bets.
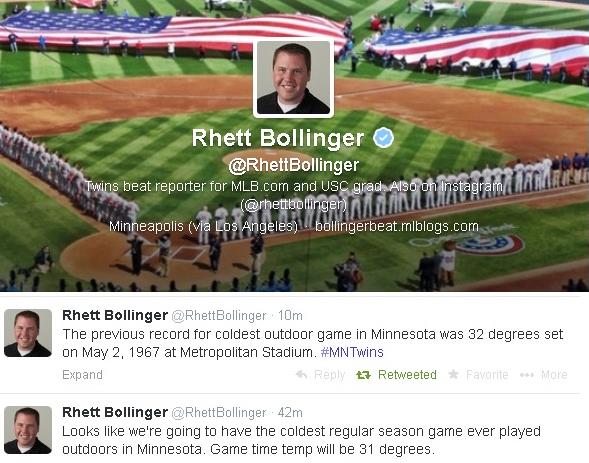
Coldest Twins Game On Record?
According to Rhett Bollinger, Twins beat reporter for MLB.com,
yesterday's midday temperature for the game at Target Field was a crisp
31F, beating the previous cold weather record of 32F, on May 2, 1967 at
Met Stadium. May you live in interesting times. Yep.
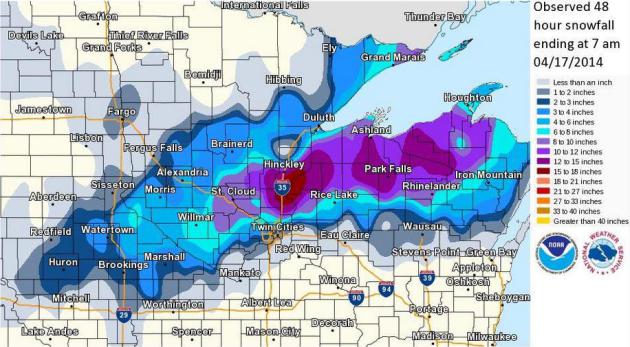
Snowfall Summary.
With any luck (and hours of prayer and meditation) may this be the LAST
time I post a snowfall map for the next 6 months. The northern and
western suburbs did, in fact, see plowable amounts, the heaviest (15"+)
amounts between Isanti and Taylors Falls and Hinckley. Source: National Weather Service.
1. 135.4 inches 1995-1996
2. 131.8 inches 1949-1950
3. 129.4 inches 2012-2013
4. 128.6 inches 1996-1997
5. 125.3 inches 2013-2014
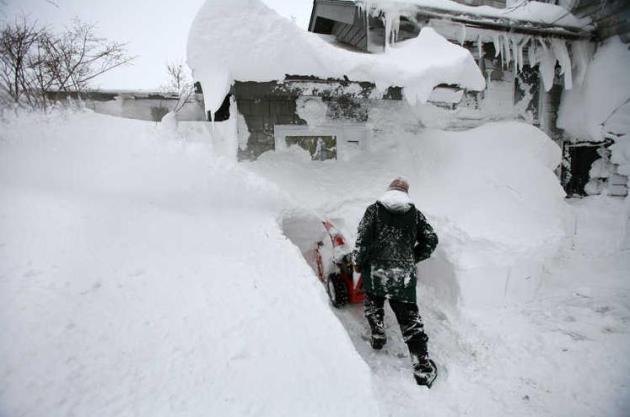
* file photo above courtesy of Brian Peterson at The Star Tribune.
Shifting Gears.
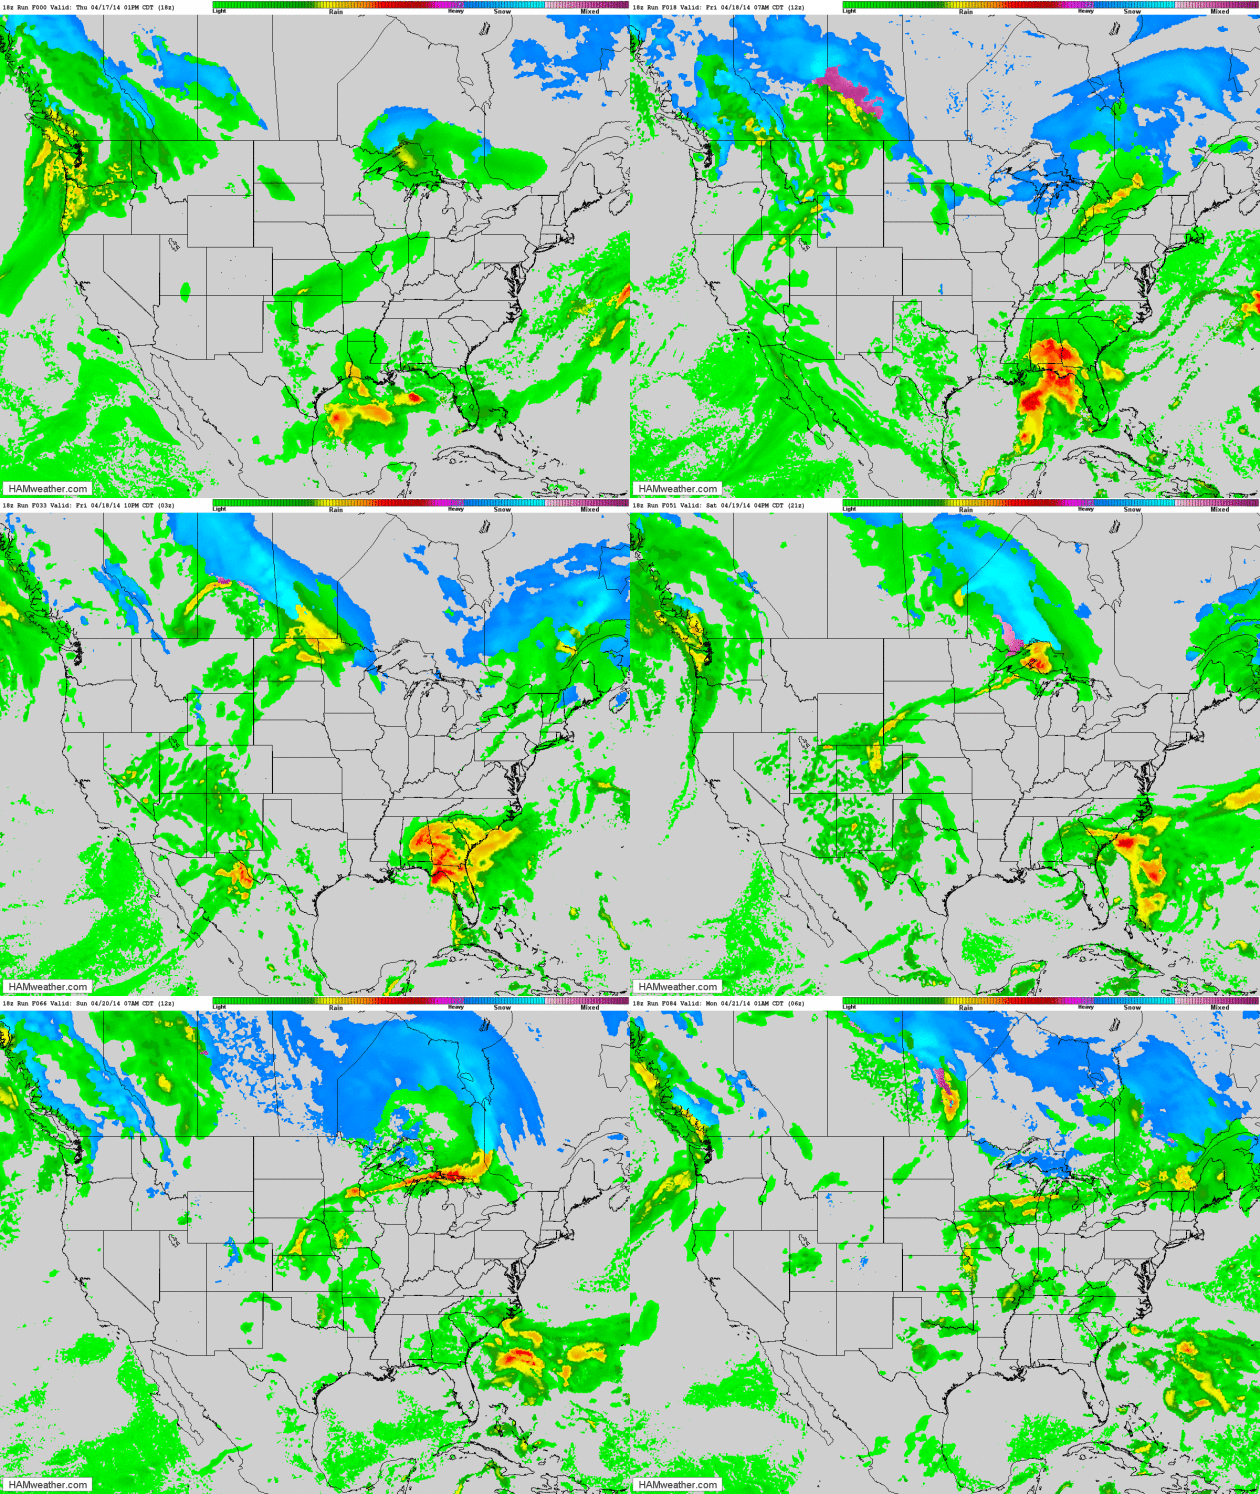
The jet stream is finally pushing north, an expanding ridge of high
pressure allowing warmer air to reach northern cities again much of next
week, sparking a few spirited rounds of showers and T-storms. Meanwhile
a disturbance in the Gulf of Mexico will soak the Florida Panhandle and
much of the Southeast, with more flash flooding likely. A Pacific storm
pushes heavy rain into the Seattle and Portland, but little or no
appreciable rain is likely across California. NAM Future Radar: NOAA and
HAMweather.
Shifting Gears - Rapidly.
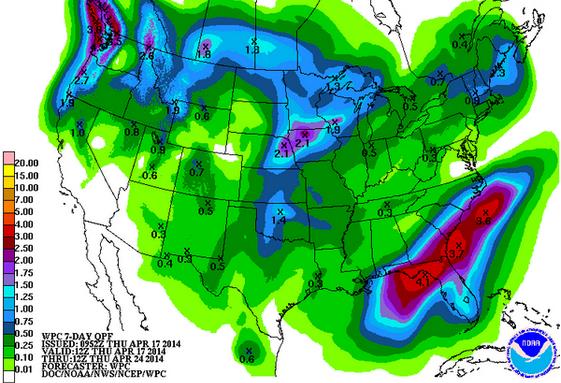
I'm continually amazed by how quickly the patterns can shift. Exhibit
A: next week, as warm air surges north, sparking waves of heavy showers
and T-storms over the Midwest, capable of 1-2" of rain. The heaviest
rains over the next week are forecast to soak the Pacific Northwest and
parts of the Southeast. 7-Day rainfall guidance through 12z next
Thursday courtesy of NOAA.

Will Spring Stick This Time?
After a few false starts, our on-again, off-again spring appears to be
on again, with temperatures forecast to be above average much of next
week, cooling off in about 1 week. No snow in the extended forecast, I'm
happy to report. ECMWF guidance shows highs near 70F Easter Sunday,
again Monday, with the best chance of (potentially heavy) showers and
T-storms Wednesday into early Thursday. Graphic: Weatherspark.
Pollution From Asia Makes Pacific Storms Stronger.
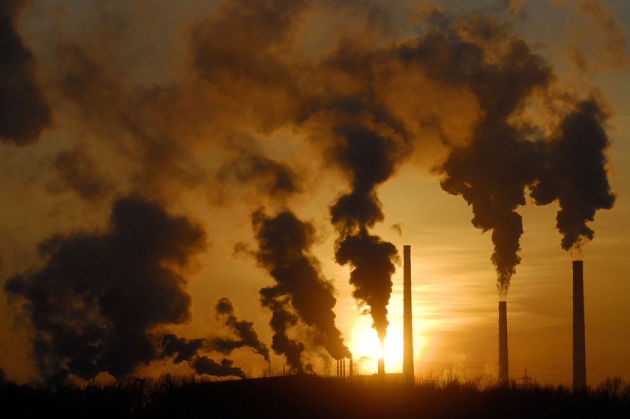
It's all about the aerosols, man-made pollutants seeding clouds and
ultimately storms hundreds, even thousands of miles downwind. Is Chinese
pollution impacting our weather? Here's a clip from National Geographic: "...Whether the weather [in North America] will change in a good direction or bad is hard to say at this time," says Renyi Zhang,
a professor of atmospheric sciences at Texas A&M University in
College Station. Zhang is a co-author, along with several scientists
from the U.S. and China, of a study released in the Proceedings of the National Academy of Sciences on Monday. The scientists say pollution from Asia is likely leading to stronger cyclones
in the midlatitudes of the Pacific, more precipitation, and a faster
movement of heat from the tropics toward the North Pole. As a result of
these changes, "it's almost certain that weather in the U.S. is
changing," says Zhang..."


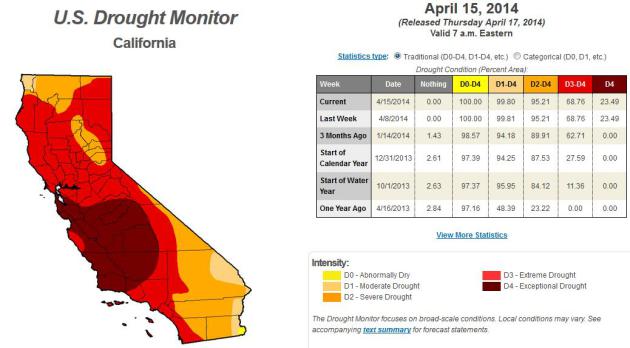
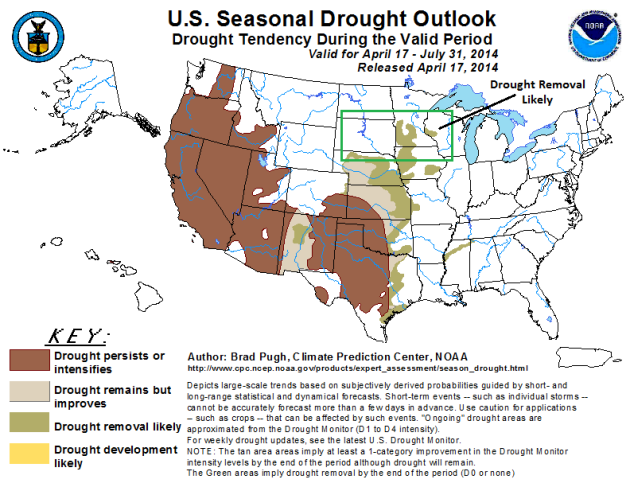
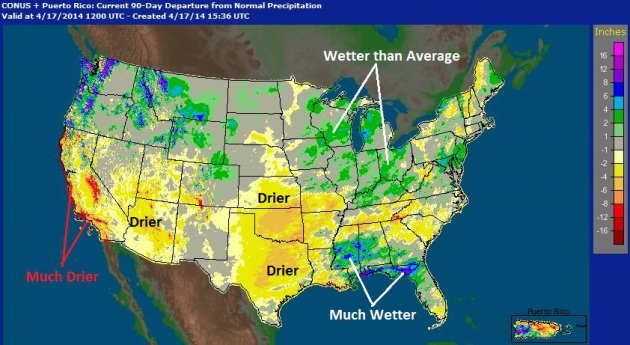
* latest U.S. Drought Monitor for California is here.
Despite
all the public education, a staggering 84 percent of people surveyed
still believe wind, not water,is the greatest threat to their safety,
and base their evacuation decisions on wind speed or a storm’s category,
the Federal Alliance for Safe Homes said this week.
The national Harris Interactive Survey, commissioned by the nonprofit group FLASH, revealed “frightening perceptions,” FLASH said Tuesday in a release.
The survey clashes with the reality that hurricane evacuation zones are based on the threat of water, not wind, and nearly all evacuation orders reflect the threat of inland flooding and storm surge.
- See more at: http://blogs.palmbeachpost.com/eyeonthestorm/2014/04/15/hurricane-survey-waters-the-threat-but-most-fear-wind/#sthash.6UHHm3wb.dpuf


Photo credit above: "Let's do this." AP Photo/Rick Bowmer.

Image credit above: "Egyptian geographer Claudius Ptolemy and Hiawatha Bray's "You Are Here". .
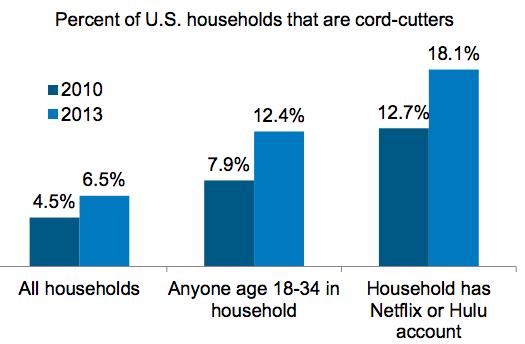
Graphic credit: Experian Marketing Services.

Climate Stories....
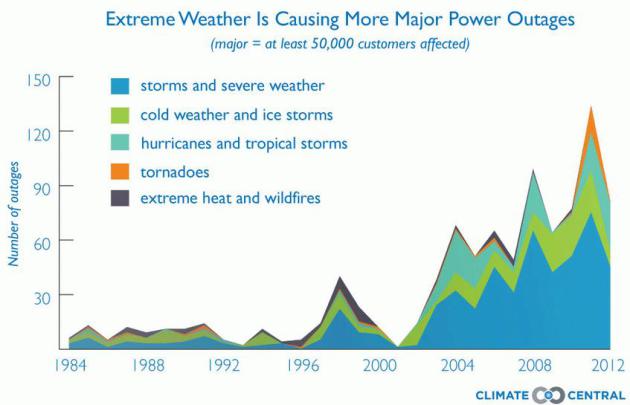
* Climate Central has a detailed 23 page report on power outage trends and the link to increasing outbreaks of severe weather impacting the grid here (PDF).
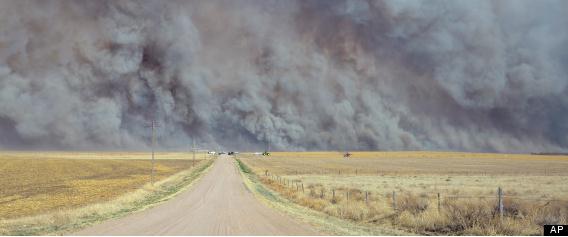
More, Bigger Wildfires Burning Western U.S. - Study Shows. Here's an excerpt from an interesting story at phys.org: "...The Number of wildfires over 1,000 acres in size in the region stretching from Nebraska to California increased by a rate of seven fires a year from 1984 to 2011, according to a new study accepted for publication in Geophysical Research Letters, a journal published by the American Geophysical Union. The total area these fires burned increased at a rate of nearly 90,000 acres a year - an area the size of Las Vegas, according to the study..." (File photo: AP).
The
number of wildfires over 1,000 acres in size in the region stretching
from Nebraska to California increased by a rate of seven fires a year
from 1984 to 2011, according to a new study accepted for publication in Geophysical Research Letters, a journal published by the American Geophysical Union.
The total area these fires burned increased at a rate of nearly 90,000 acres a year – an area the size of Las Vegas, according to the study. Individually, the largest wildfires grew at a rate of 350 acres a year, the new research says.
Read more at: http://phys.org/news/2014-04-bigger-wildfires-western.html#jCp
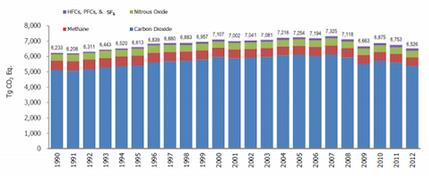
U.S. GHG Emissions At Lowest Levels In 20 Years. The
trends are encouraging in the USA, but any drop in carbon pollution
here has been more than offset by spiking greenhouse gas emissions in
China, India and other rapidly developing nations. Here's a clip from Climate Central: "U.S.
greenhouse gas emissions declined 3.4 percent in 2012 from 2011, the
Environmental Protection Agency announced Tuesday. Those emissions are
down 10 percent from what they were in 2005, the EPA said, and are at
their lowest levels since 1994.
Most of the decline came from reductions in energy consumption,
increased fuel efficiency of cars and other types of transportation, and
a shift to natural gas from coal in fueling power plants, the EPA said in a statement..."
Graphic credit above: "U.S. greenhouse gas emissions per year since 1990, broken down by type of gas." Credit: EPA.
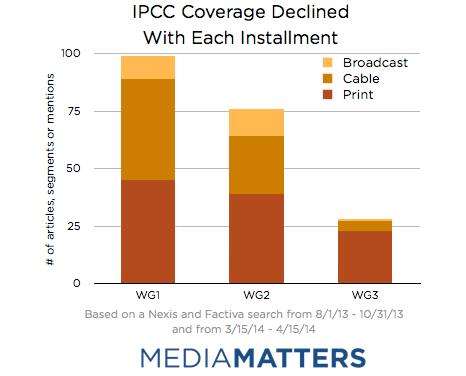
Analysis: How The Media Covered The U.N. Climate Reports In Three Charts. Are we losing interest or avoiding the subject altogether? Here's an excerpt from Media Matters: "...A
Media Matters analysis found that the major print and television
outlets devoted far less coverage to the most recent installment of the
IPCC report than the first two reports by Working Group 1 (WG1) and
Working Group 2 (WG2), which outlined the evidence that manmade climate
change is happening and having largely negative impacts, respectively.
The third report received only about a quarter (28 percent) of the
amount of coverage given to the first report..."

U.N. Climate Report Was Censored. Or at least very watered down for public consumption, it seems. This, according to an article at Grist; here's an excerpt: "...And
it turns out the summary was watered down — diluted from an acid
reflux–inducing stew of unpalatable science into a more appetizing
consommé of half-truth. The Sydney Morning Herald has the details:
A major climate report presented to the world was censored by the very
governments who requested it, frustrating and angering some of its lead
authors. … [E]ntire
paragraphs, plus graphs showing where carbon emissions have been
increasing the fastest, were deleted from the summary during a week’s
debate prior to its release. Other sections had their meaning and
purpose significantly diluted... (Image credit: Shutterstock).
