 November 4
: average date of the first coating (1/10th of an inch) of snow in the Twin Cities. Details below.
7th quietest Atlantic hurricane season, to date, in the last 70 years. Details from Climate Central below.
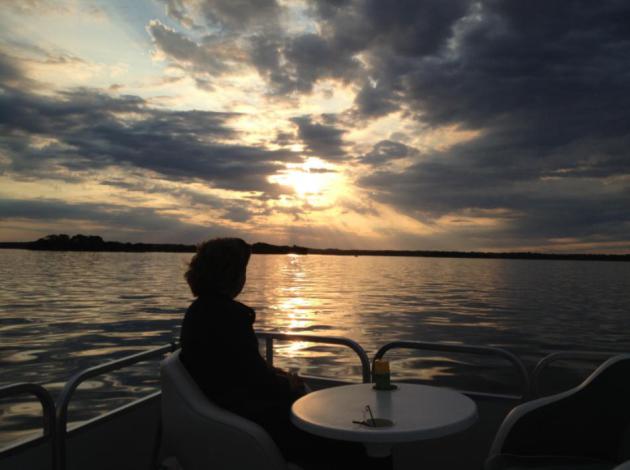
Weather-Sensitive
Staring
at the weather maps comes as a relief after the drama and trauma of
recent days. Debt ceilings, fiscal cliffs - staring into the abyss. "Now
let's go to Paul with the weather!"
I hope you can check out the WeatherNation TV blog, which I spend entirely too much time on every
day. You can get an updated forecast, but also see the raw model maps
that drive these predictions. That, and a stream of weather and
climate-related stories that catch my eye every day.
Today's post includes
scientific confirmation
that weather does impact our health. Lightning can spark headaches,
sharp drops in air pressure ahead of storms can increase depression
symptoms, and arthritis is more likely to flare up on cold days. All
that stuff your grandma taught you.
The forecast calls for bouts
of depression and arthritis as a series of Alberta Clippers yank
increasingly cold air southward. Next week will look & feel more
like mid-November than mid-October. A frost/freeze Sunday morning gives
way to an airmass cold enough for the first flakes of autumn.
Right
now I don't see any accumulation (it's too early to see that in print)
but I'm sensing a little payback for a glorious September.
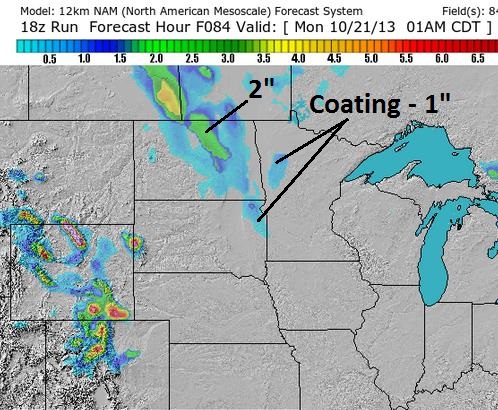 Nuisance Snow Potential.
12km NAM data shows a coating to a half inch of slush, mainly on lawns
& fields over far western Minnesota and the Red River Valley, as
much as 2" over North Dakota. Map: Ham Weather.
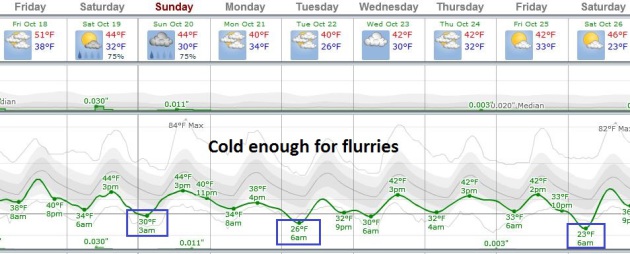 Fast-Forward Fall
.
We go from an August-like early October to a November-like late
October. Makes perfect sense to me. A few instability (rain) showers are
possible this afternoon, again Saturday afternoon, a better chance of a
cold rain Sunday night (possibly mixed with wet snow over central
Minnesota). The atmosphere will be cold enough for wet snow much of next
week - but a lack of deep moisture should mean little more than
flurries. Graph: Weatherspark.
 First Real Shot On Winter
.
4km NAM data shows a few showers and sprinkles later today and
Saturday, mixing with a little wet snow up north by Saturday night and
Sunday. Heavy wet snow falls over the Rockies, while the leading edge of
a November-like airmass pushes a pinwheel of rain into New England.
 An Early Taste of Winter.
12km NAM data shows an airmass more typical of mid-November draining
south out of Canada in the coming days, a hard freeze likely by early
next week from Minnesota into the Dakotas. Cold air will push as far
south as the Gulf Coast by Monday. Loop: NOAA and Ham Weather.
An Early Outbreak Of Heavy Jackets.
NOAA's CPC (Climate Prediction Center) shows a strong bias toward much
colder weather the last week of October, in fact chilly temperatures are
likely east of the Rockies. Map:
Ham Weather.
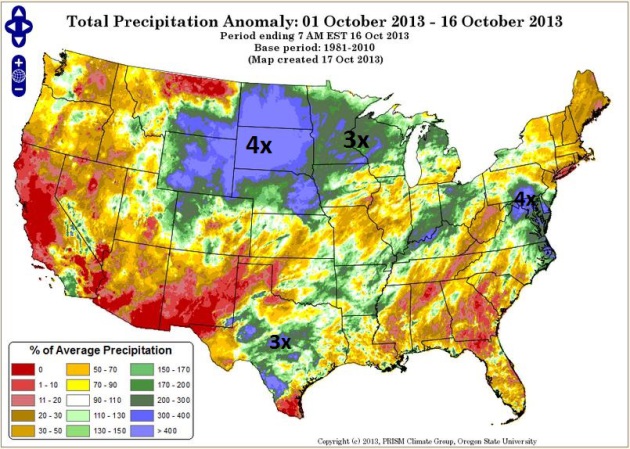 Trending Wetter.
Here are precipitation anomalies since October 1, showing 4 times more
rain (and snow) than average for the month, to date, over the Dakotas
and Wyoming, 2-3 times average rainfall amounts for much of Minnesota,
helping to put a serious dent in the drought. Map: Prism Climate Group,
Oregon State.
Next Week: Coldest Of The Season So Far. So says
Planalytics, and I happen to agree. Here's an excerpt of one of Planalytic's recent summaries: "...
While
the first two weeks of October have been warm in the East and cool in
the West, there are indications that the pattern will change.
Temperatures will drop in major markets in the Northeast, Midwest, and
Mid-Atlantic regions as we move through next week (October 20-26) with
the West Coast experiencing a warming trend. Although most of interior
North America is currently cooler than normal, the core of the cold
temperatures remains bottled up in Canada. Limited cold and snow
continues to be focused in the higher elevations of the Rockies and
central regions along the U.S. – Canadian border..."
It's True! The Weather Really Does Affect Your Health. Here's a clip from a story at PBS's
Next Avenue that caught my eye: "
If
your achy knee "tells" you when it's going to rain, you already know
weather can have an impact on your body. Here's an expert look at how
what's happening outside can affect how you feel inside — and it's not
always negative:
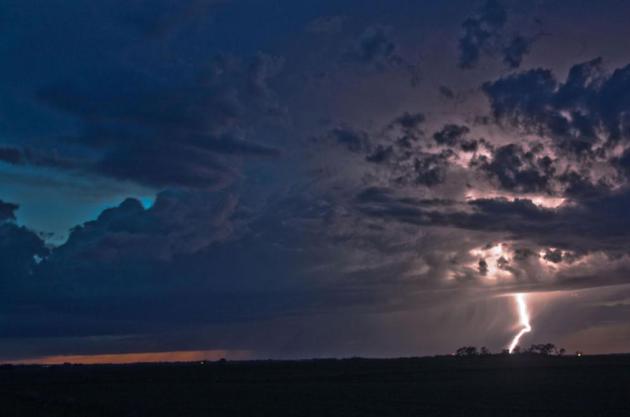
Lightning: Increased Headache Risk Lightning
storms may trigger headaches and migraines in chronic sufferers,
according to a study by University of Cincinnati researchers recently
published in the journal Cephalalgia. The study detected a 31 percent increase in the risk of headaches and
a 28 percent increase in the risk of migraines among chronic sufferers
on days when lighting struck within 25 miles of participants' homes..."
 First Coating Of Snow For Select Cities?
 Yes,
this is my way of cheering you up on a Thursday. Thanks to State
Climatologist Greg Spoden for providing me with this information. Bottom
line, the mean (average) date of the first coating (tenth of an inch or
more) in the Twin Cities is November 4. More details at
this site:
Minneapolis/St. Paul International Airport - Date of First Snowfall => 0.1"
(period of record: 1938 - 2012)
mean: November 4
earliest: September 24, 1985
latest: December 2, 1963
Duluth International Airport - Date of First Snowfall => 0.1"
(period of record: 1948 - 2012)
mean: October 23
earliest: September 18, 1991 (* note: very early snowfall last year - September 21, 2012 *)
latest: November 26, 2004
International Falls Airport - Date of First Snowfall => 0.1"
(period of record: 1948 - 2012)
mean: October 19
earliest: September 14, 1964
latest: December 8, 1999
Fargo International Airport - Date of First Snowfall => 0.1"
(period of record: 1942 - 2012)
mean: November 2
earliest: September 25, 1942
latest: December 14, 1999
Rochester International Airport - Date of First Snowfall => 0.1"
(period of record: 1933 - 2012)
mean: November 5
earliest: September 26, 1942
latest: December 19, 1939
Pacific Ocean Temperature Influences Tornado Activity In U.S., MU Study Finds. Here's a clip from a very interesting story about new research, courtesy of
The University of Missouri: "...
McCoy
and Lupo found that the tornados that occurred when surface sea
temperatures were above average were usually located to the west and
north of tornado alley, an area in the Midwestern part of the U.S. that
experiences more tornados than any other area. McCoy also found that
when sea surface temperatures were cooler, more tornadoes tracked from
southern states, like Alabama, into Tennessee, Illinois and Indiana.
“Differences in sea temperatures influence the route of the jet stream
as it passes over the Pacific and, eventually, to the United States,”
McCoy said. “Tornado-producing storms usually are triggered by, and will
follow, the jet stream. This helps explain why we found a rise in the
number of tornados and a change in their location when sea temperatures
fluctuated...”
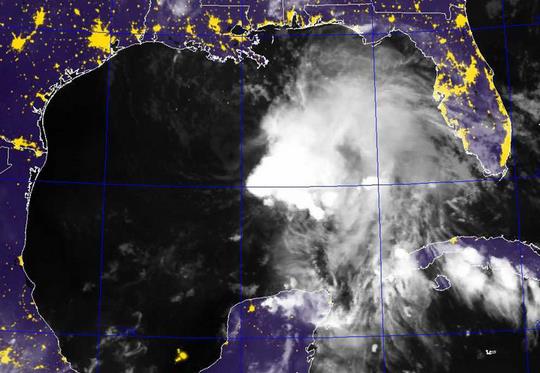
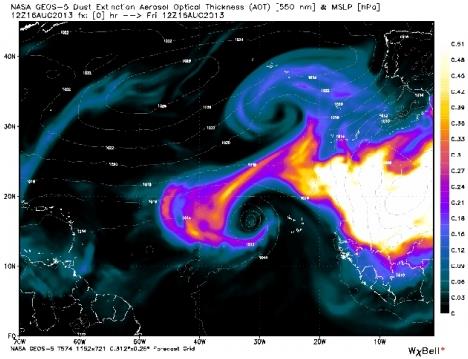
What Happened To The 2013 Atlantic Hurricane Season?
Good question, but once again I'm reminded of the utter futility of
issuing a reliable "outlook" for hurricanes, or the winter to come,
months in advance.
Climate Central has a good explanation; here's an excerpt: "...
Forecasters
say that three main features loom large for the inactivity: large areas
of sinking air, frequent plumes of dry, dusty air coming off the Sahara
Desert, and above-average wind shear. None of those features were part
of their initial calculations in making seasonal projections.
Researchers are now looking into whether they can be predicted in
advance like other variables, such as El Niño and La Niña events. Brian
McNoldy, a senior research associate at the University of Miami, said
that across the Atlantic this season “you had air sinking through a
pretty large depth of the atmosphere...”
Image credit above: "
A computer model image shows the extent of dry air flowing westward from Africa on August 16." Credit: WeatherBell Analytics.
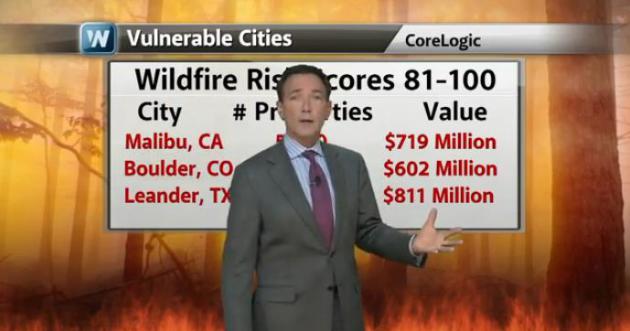
Growing Wildfire Risk.
The trends are clear: as the West continues to dry out and warm up
wildfires are becoming bigger, and more intense over time. CoreLogic
just released an update on the most vulnerable states and metropolitan
areas. Texas and Colorado top the list, but in terms of insured property
at risk California is also very much at risk. Details in today's
edition of
Climate Matters.
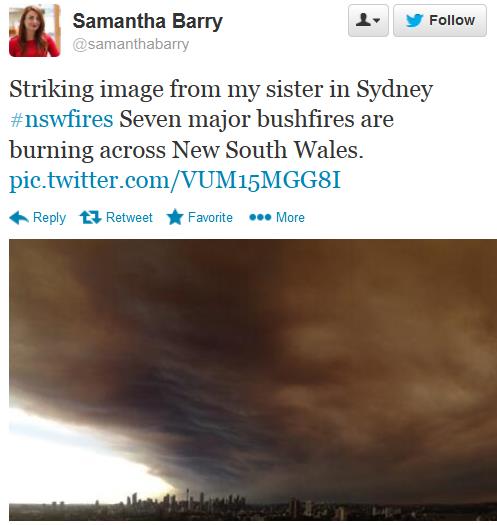
Wildfires Rage In Australia, Homes Destroyed. After a record warm winter Australia is experiencing a very early start to wildfire season, as reported by
The Wall Street Journal; here' sa clip: "
SYDNEY--Wildfires
burning across parts of eastern Australia have destroyed a number of
homes, blanketed Sydney in thick smoke and forced the closure of a major
regional airport. Authorities are warning that many more homes could be
at risk in New South Wales--the country's most populous state--as
strong winds and high temperatures continue to fan the flames. "If we
get through with less than 100 homes destroyed today, we have been
lucky," said state Rural Fire Service Commissioner Shane Fitzsimmons
from an official Twitter
account. Calls to the service weren't immediately returned. Emergency
warnings have been issued for eight different areas by the rural fire
service, according to its website..."
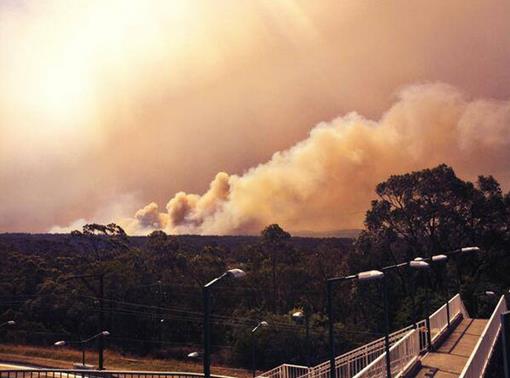
Photo credit above: "
In
this photo provided by the New South Wales Rural Fire Service, smoke
rises from a fire near Springwood, west of Sydney, Thursday, Oct. 17,
2013. Nearly a hundred wildfires are burning across Australia's New
South Wales state, more than a dozen of which are out of control, as
unseasonably hot temperatures and strong winds fanned flames across the
parched landscape." (AP Photo/New South Wales Rural Fire Service).
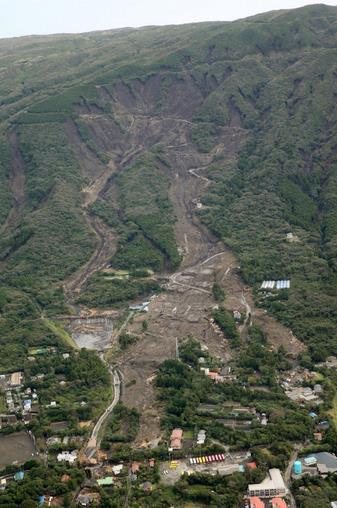
Japan's Shocking, Deadly Deluge From Typhoon Wipha: 33" Of Rain In 24 Hours. Meteorologist Jason Samenow at The Washington Post's
Capital Weather Gang has the story - here's the intro: "
Here’s
an astonishing statistic: Typhoon Wipha dumped 33 inches (850 mm) of
rain in 24 hours on Oshima Island, 75 miles south of Tokyo. It is the
greatest rainstorm to occur on Oshima, populated by 8,200 people, since
records began in 1991 reports the AP. It also twice the entire average rainfall for the month of October, notes the Wall Street Journal.
“People on this island are somewhat used to heavy rainstorms, but this
typhoon was beyond our imagination,” Yutaka Sagara, an island resident, told the AP. Incredibly, 17 inches (426 mm) fell in 4 hours and nearly 5 inches in one hour..."
Photo credit above: "
Houses
in a residential area in Oshima are buried by mudslides after a
powerful typhoon hit Izu Oshima island, about 120 kilometers (75 miles)
south of Tokyo Wednesday morning, Oct. 16, 2013. Typhoon Wipha has
lashed Japan, leaving at least seven people dead on a Pacific island
south of Tokyo as it cut across the capital region and headed north." (AP Photo/Kyodo News)
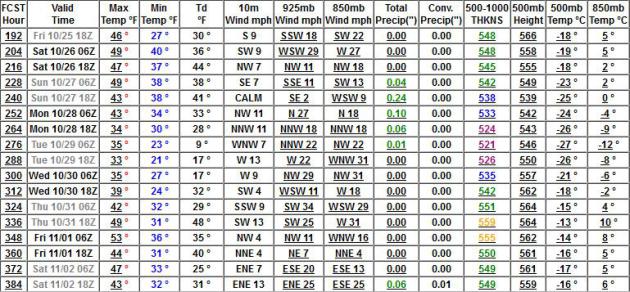
 Ask Paul
. Weather-related Q&A:
Paul,
Are
we passed the weather phenomenon that is known as Indian Summer yet? I
need to resurface my flat roof with asphalt base coating before winter.
No minimum temperature required but prefer it to be at least several
degrees above freezing for a few days and dry.
Joe, Eau Claire, WI
Joe
- technically we have to experience the first frost before we can call
any subsequent warmth "Indian Summer". We should see our first
sub-32-degree low by Sunday morning in the metro, but I don't see any
big warm-ups through the first few days of November. The GFS model
(below) shows highs near 50F next weekend, again around Halloween.
New Views Of Sandy. Here's a clip from a fascinating article at
UCAR
explaining some of the factors that contributed to Superstorm Sandy's
size, ferocity and outsized storm surge (for a Category 1 strength storm
at landfall on October 29, 2012): "...
Since the January AMS
meeting, Tom Galarneau, along with NCAR colleagues Chris Davis and Mel
Shapiro, have analyzed additional AHW simulations, which they describe
in the just-released paper. They explain that Sandy’s life cycle—unique
in Atlantic hurricane annals—was actually a blend of several
well-studied phenomena that hadn’t been previously shown to come
together in such a way near a major coastline. As Sandy moved
northeast, contrasting air masses created a pseudo-frontal system along
the edge of the Gulf Stream’s warm water. The vorticity, or circulation,
along this frontal zone (picture an atmospheric rolling pin oriented
along the Gulf Stream) was gradually ingested by Sandy and tilted into
vertical vorticity (now picture the rolling pin standing on one end).
This helped the storm’s core to intensify, tighten, and regain its
Category 2 status. It’s roughly similar to the smaller-scale process by
which a supercell thunderstorm can ingest, tilt, and concentrate
spinning air to produce storm-scale circulations (some of which can
generate tornadoes)..."
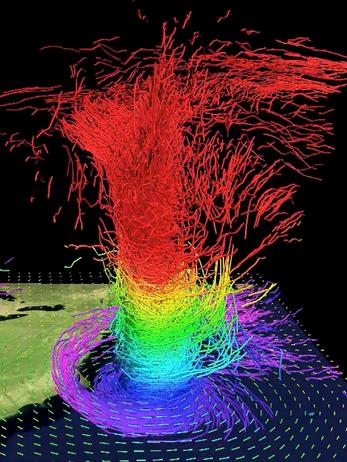
Image credit above: "
In
this 3-D map of potential temperature, relatively cool air wraps around
Sandy's core near the surface (purple and blue colors), while air
parcels gain heat from moisture condensing into clouds and precipitation
as they ascend through the storm’s core." For more details on this simulation, see the
YouTube videos below. (©UCAR. Image courtesy Mel Shapiro, NCAR).
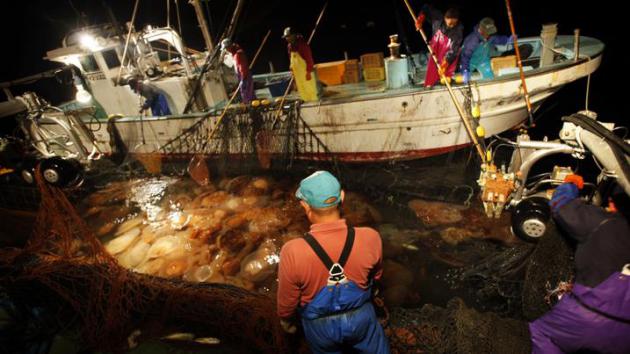
Jellyfish Are Taking Over The Seas, And It Might Be Too Late To Stop Them.
Bad sushi anyone? Is this a result of more acidic ocean water, or more
pollution? No idea, but this story makes me appreciate Minnesota's
(jellyfish-free) lakes even more. Here's an excerpt from
Quartz: "...
Coastal
areas around the world have struggled with similar jellyfish blooms, as
these population explosions are known. These blooms are increasing in
intensity, frequency, or duration, says Lucas Brotz, a jellyfish expert
at the University of British Columbia. Brotz’s research of 45 major marine ecosystems shows that 62% saw an uptick in blooms (pdf)
since 1950. In those areas, surging jellyfish numbers have caused power
plant outages, destroyed fisheries and cluttered the beaches of holiday
destinations. (Scientists can’t be certain that blooms are rising
because historical data are too few.)..."
Photo credit above: "
The Nomura jellyfish invasion has plagued Japanese fishermen—and probably stems from pollution in China’s Yangtze River." AP Photo/Junji Kurokawa.
Beware Of Faulty, Flaky Facebook Weather Forecasts. As always, consider the source - here's an excerpt from
The Capital Weather Gang: "
In
order to confront the spread of bad weather updates on Facebook, ask
these questions before buying into them or, worse, sharing them:
*
Do you know/trust the source? If you’ve never heard of the source
before, disregard it and/or check information sources you trust for a
second opinion.
* Is the source legitimate? Try to figure
out who is maintaining the page that information or update is coming
from. Is it a reputable news or weather organization like a TV station,
newspaper, established private sector weather company (like AccuWeather
or Weather Underground), or government agency (like the National
Weather Service)? Is there available information about the
meteorological credentials of the person/people managing the page?"
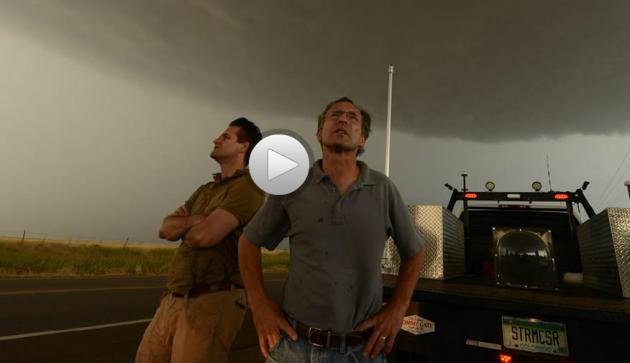
"The Last Chase". Robert Draper at
National Geographic
has a detailed, and haunting account of research meteorologist and
veteran tornado chaser Tim Samaras's deadly encounter with a massive
tornado in May; here's the introduction: "
It’s shortly after six in
the evening on May 31, 2013. Sitting in the passenger seat of the white
Chevrolet Cobalt, the 55-year-old, bookishly handsome storm chaser
momentarily gapes at the video camera that the driver of the car is
pointing at his face. Then he looks back through the window at the
outskirts of El Reno, Oklahoma. The wheat fields are eerily aglow and
shudder from a vicious wind. No more than two miles away from the car,
twin funnel clouds spiral downward from an immensity of blackness. What
we hear in the man’s voice on the videotape is not quite terror. Nor,
however, do his words sound clinically factual, in the manner of the
scientist he happens to be. “Oh, my God. This is gonna be a huge one,”
he says..."
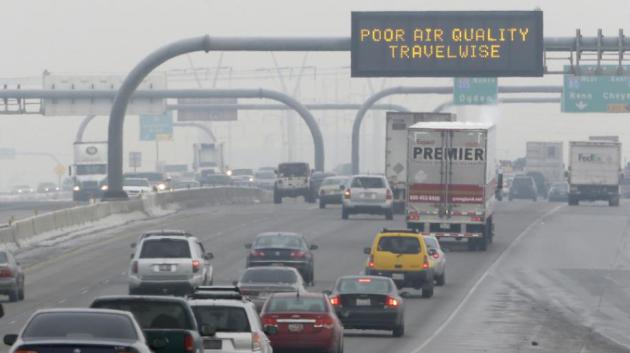
More Americans Die From Car Pollution Than Car Accidents. This headline made me do a double-take; here's a clip from
Quartz: "
Some day our descendants will marvel that we ever lived in cities filled with emissions direct from the tailpipes of cars. A new study from MIT
suggests that in the US, 53,000 people a year die prematurely because
of automobile pollution, compared to 34,000 people a year who die in
traffic accidents. These results more than double the number of people who die in the US every year as a result of automobiles, to nearly 100,000. One in five Americans is in danger from air pollution, and it appears that the hazard is primarily their proximity to roadways.."
Photo credit above: "
You might be able to avoid a pile-up, but you can't escape the smog." AP Photo/Rick Bowmer.
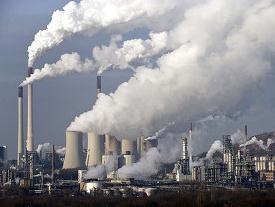
Outdoor Air Pollution Causes Lung Cancer, WHO Says. I don't take Minnesota's (relatively) clean air for granted, and neither should you, according to this excerpt of a
Bloomberg story: "
Outdoor
air pollution can cause lung cancer, a World Health Organization agency
said, ranking it as a carcinogen for the first time. Pollution was also
linked to an increased risk of bladder cancer, the International Agency
for Research on Cancer, based in Lyon, France,
said in a statement on its Web site today, citing a review of studies.
Air pollution, which has also been linked to heart disease, caused about
223,000 deaths from lung cancer
globally in 2010, according to the IARC. Particulate matter, which
comes from vehicles, power plants, other industrial sites and biomass
burning and is a major component of the pollution, was evaluated
separately and also found to cause cancer..."
Climate Stories...
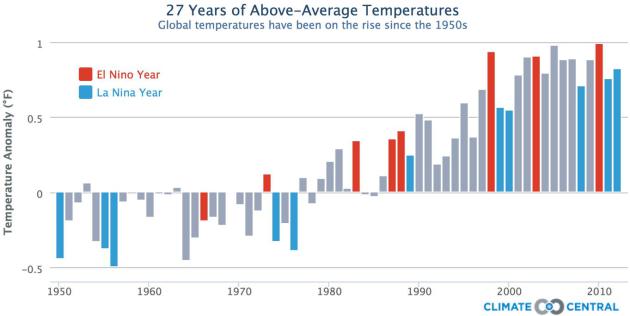
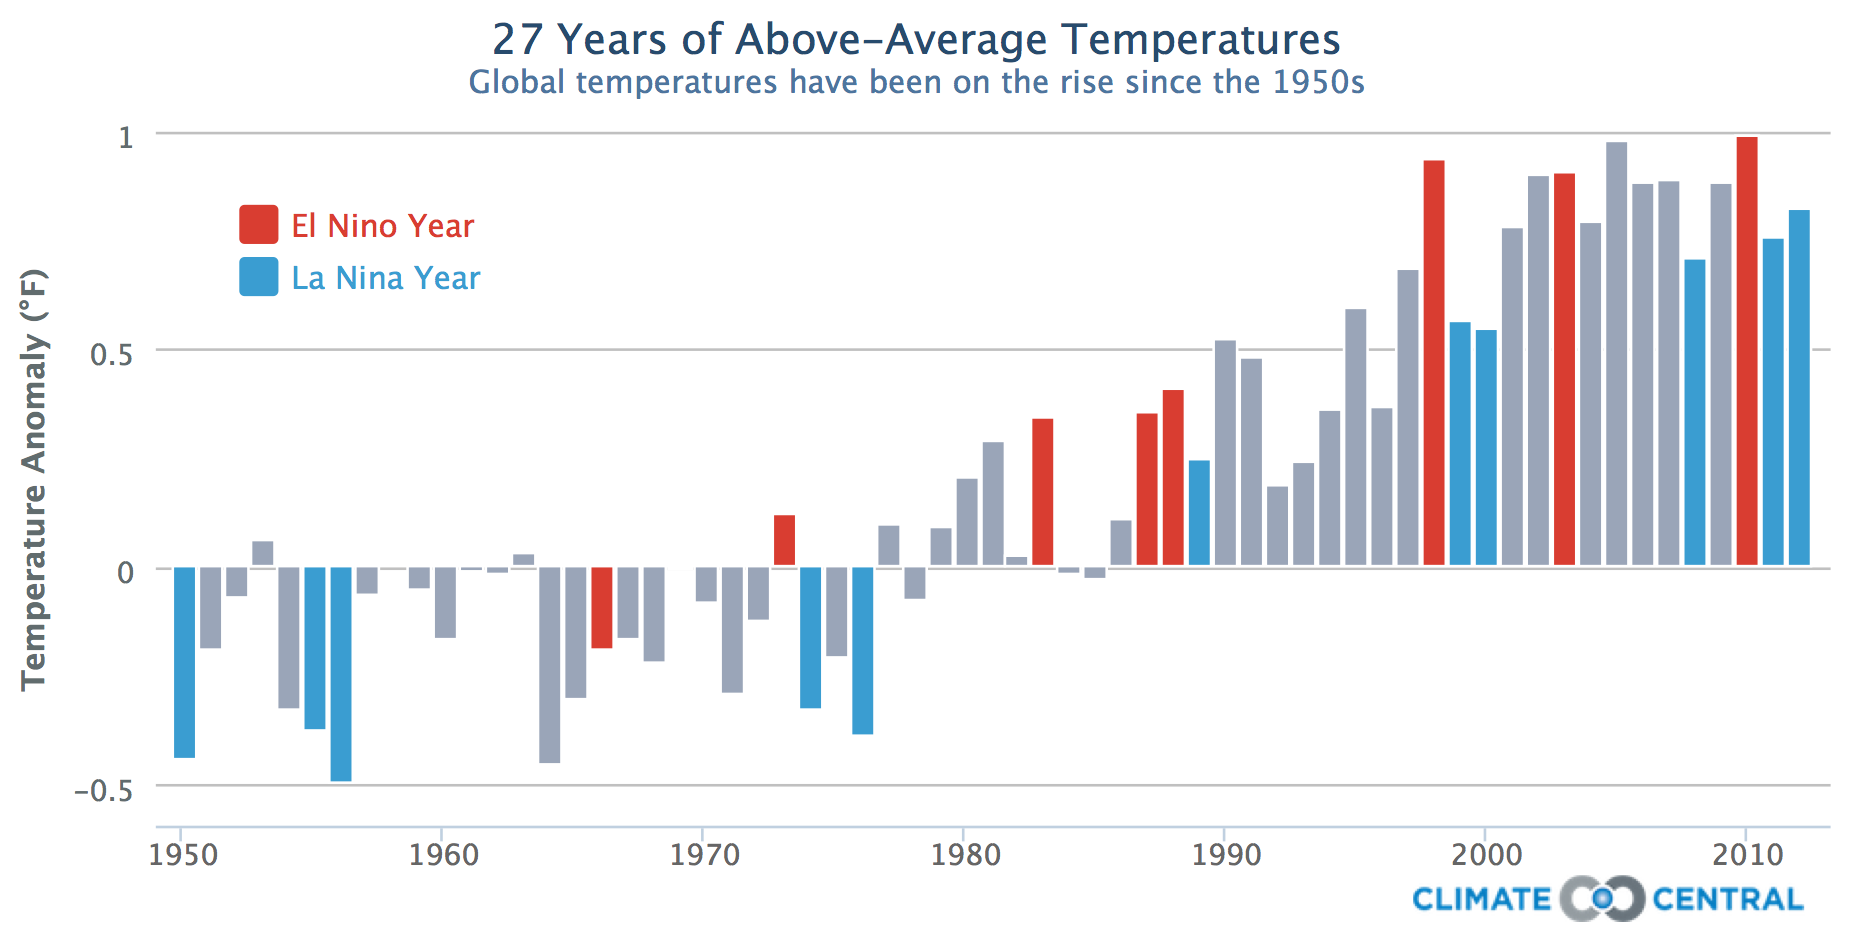
ENSO Trends Since 1950.
Yes, even La Nina cooling phases are trending milder than average in
recent years, which may not be much of a shock, considering 90% or more
of the observed warming is going into the world's oceans. Graph above
courtesy of NOAA,
Real Climate and Climate Central.
No, Climate Change Will Not Be Good For The World.
NewStatesman
has the story, a rebuttal to a recent article touting the positive
impacts of climate change at the Spectator; here's an excerpt: "...
He's
right that there are some short-term economic benefits to climate
change, but multiple analyses have shown that the long-term costs are
far in excess of the costs of preventing it, making his complaints about
the price of climate policies irrelevant. If we spend £100 on climate
policies and get £3 of benefit (an assertion that I can't find a source
for), that's a better situation than spending nothing on climate
policies and having to deal with hundreds of billions of pounds of costs
over the next century. He's right that warmer winters will mean fewer
deaths, but then lists stats on past heatwaves - temperatures that will
be considered around average by the middle of this century - without
considering the heatwaves of the future. He also doesn't mention the
vast increases in the spread of tropical diseases projected to occur
under higher temperatures..."
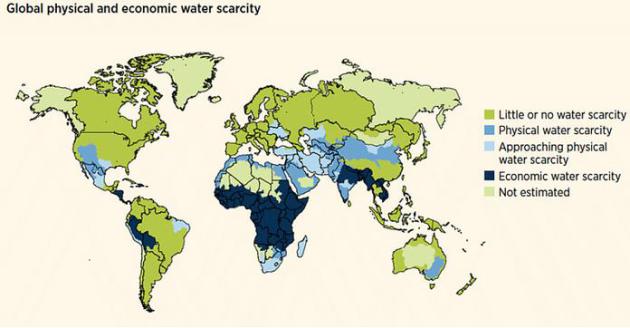
Five Gruesome Truths About The State Of The Global Food Industry.
Quartz has the story - here's an excerpt: "...
The world currently produces enough calories to overfeed every human—presently, about 2,700 calories per head—and
yet the world, as a whole, is underfed. The reality is in no small part
due to the overwhelming inefficiency of our global food production and
consumption. A third of the food we produce is used to feed animals;
another third is wasted; and roughly 5% is used to produce biofuels.
Roughly a fifth of the world
lives in areas suffering from physical water scarcity, and another 500
million are quickly approaching a similar state. But that only tells
half of the tale. Another 1.6 billion people live in countries with
insufficient water infrastructure, or in what’s referred to as economic
water scarcity..."
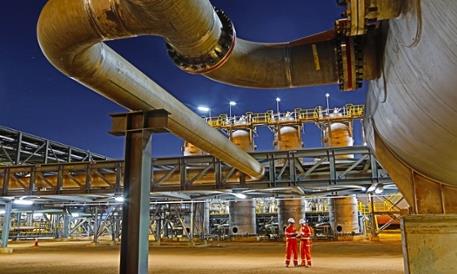
Coal Executive Turned Climate Change Activist Fights For Seat On BHP Board. The Guardian has the story - here's the intro: "
A
former chairman of the Australian Coal Association, who has accused the
fossil fuel industry of “stuffing up” effective action on climate
change, is fighting an insurgent battle to gain a seat on the board of
the mining giant BHP Billiton. Ian Dunlop, formerly a senior executive
in the oil, gas and coal industries, is attempting to gain shareholder
support for his bid to challenge what he claims is “utter (BS)” from a
resources industry that has stymied an urgent transition away from
carbon-intensive fuels..."
Photo credit above: "BHP Billiton's Macedon gas plant in Onslow, Western Australia." Photograph: AAP/supplied by BHP Billiton
Supreme Courty Agrees To Hear Greenhouse Gas Case. The Los Angeles Times has the story - here's the introduction: "
The
Supreme Court has agreed to hear a utility industry challenge to the
Obama administration’s environmental regulations that would limit
greenhouse gases coming from power plants and factories. The justices
agreed to rule on whether the Environmental Protection Agency’s
restrictions involving motor vehicles give the agency the power to
impose similar restrictions on “stationary sources that emit greenhouse
gases,” which would include everything from power plants and refineries
to apartment buildings and factories. The court, however, turned away
the most aggressive challenges to the EPA’s authority to regulate
heat-trapping greenhouse gas emissions..."
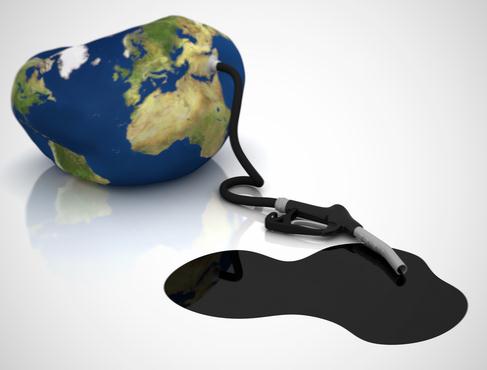
The U.S. Is Now The Biggest Oil Producer In The World. Fracking (shale oil extracted via hydraulic fracture) has pushed us over the top. Here's a clip from an eye-opening story at
Fast Company: "
So
long, Saudi Arabia. The U.S. is projected to be the biggest supplier of
oil in the world this year when biofuels and natural gas liquids are
taken into account, according to data released from PIRA Energy Group.
The growth in U.S. oil production has been rapid--it was just last year
that the U.S. overtook Russia to claim the second place spot. Now,
thanks to the shale oil boom, the U.S. has climbed above even the Middle
Eastern oil empire of Saudi Arabia. And while both Saudi Arabia and the
U.S. increased oil production in 2013, the U.S. ramped up production
faster than the Saudis. According to a press release from PIRA,
the U.S. oil "growth rate is greater than the sum of the growth of the
next nine fastest growing countries combined and has covered most of the
world's net demand growth over the past two years..." (Image: Clean Technica).
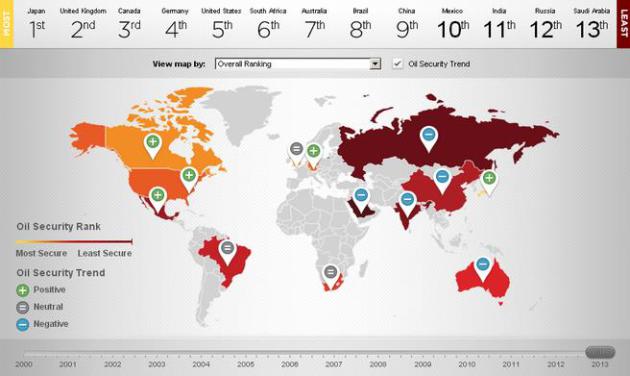
These Maps Show Where The U.S. Is Most Vulnerable To Oil Shocks.
The Washington Post provides perspective - here's an excerpt: "
How do America's vulnerabilities compare globally? For that we can turn to the "Oil Security Index,"
a new project from Securing America's Future Energy (SAFE) and Roubini
Global Economics. The United States, they find, is still more exposed
than most other advanced economies to disruptions in the global oil
supply.."
Response To Readers: Combating Climate Change With Nuclear Power And Fracking.
There's a link to the original article and a follow-up from the author.
Is nuclear power and fracking the lesser of the energy evils when
compared to coal? Here's an excerpt to an article at
Forbes: "
With
more than 7,500 views and 180-plus tweets, I want to thank everyone for
taking the time to read the original HBS Working Knowledge piece, The Case for Combating Climate Change with Nuclear Power and Fracking,
and, in particular, for sharing your thoughts with one another. I don’t
expect the article has changed minds, but I do hope it encourages
people to open their minds to consider new possibilities. Things that
were once seen as relatively safe are now understood as likely to be
quite dangerous, such as coal burning’s contribution to global warming
driven by worldwide cumulative CO2 emissions. Perhaps, the opposite is
also true. Are things that were once seen as quite dangerous now
potentially relatively safe as result of new understandings and
innovations?..."


