Melt Baby Melt
"I wish I could be right half the time and still
get paid!" No need to get defensive, Paul. Just smile, shake his hand -
tell him still you're right more often than politicians, stock brokers
and economists. It's a pretty good gig - just not this year.
A year ago lawns were green, flowers were in
bloom, boats were in the water, on our way to a 7 month boating season.
In Minnesota? How do you top that?
You don't.
Our Slow Motion Spring is aggravating; Mother
Nature toying with our mental health. Yesterday I stood by the window,
muttering "melt, baby melt.". That's just kind of sad, but I sense I'm
not alone.
There's still 15-20 inches of snow on the ground
up north. One benefit of our March-like April: slower snow melt, which
may help to reduce the flood risk in the Red River Valley a bit. That,
and it's too chilly for severe storms & tornadoes. Hey, that's
something.
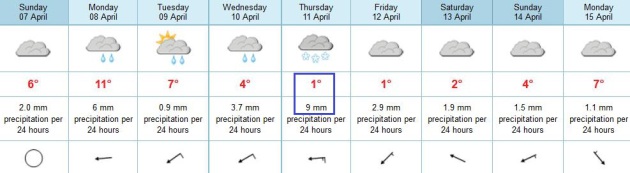
The sun makes a brief cameo appearance today
before more rain tonight & Monday. It doesn't look quite as wet this
week; a major Plains storm brushes us with a cold rain late Tuesday
& Wednesday; maybe mixing with wet snow by Thursday.
Yes, the drought is easing, but summer warm fronts are nowhere in sight.
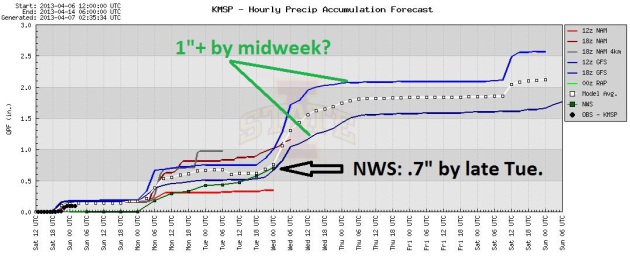
Lingering Uncertainty. Most of the models still
bring significant moisture northward across the Plains this week; a
potential for an inch or more of precipitation (mostly rain) in the Twin
Cities. The local NWS office is predicting about .7" of additional rain
by Tuesday evening. But the European (ECMWF) model still keeps the
brunt of the moisture to our south.
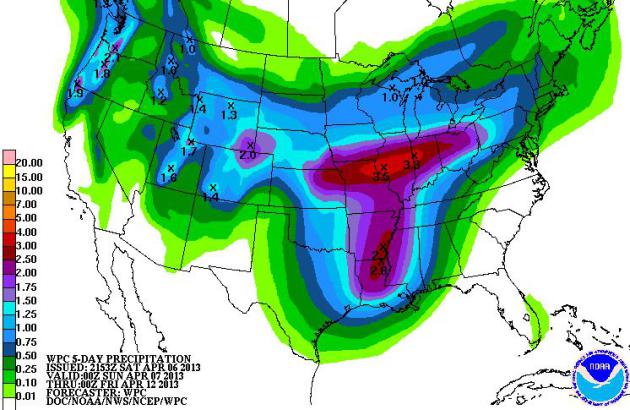
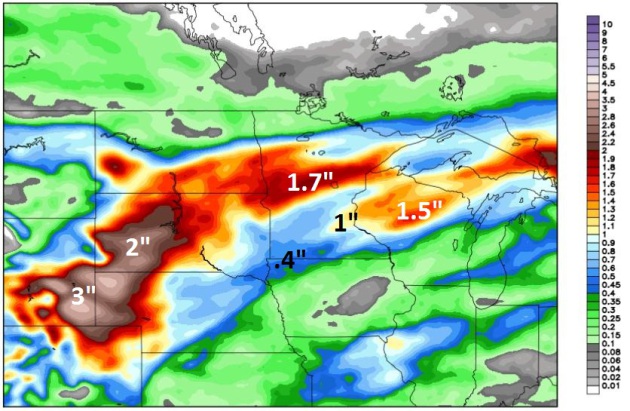
QPF. I think the latest Quantitative Precipitation
Forecast (talk about a mouthful) has the right idea, keeping the
heaviest rainfall plume south of Minnesota and Wisconsin; as much as
2-4" from northern Missouri to Illinois and Indiana, closer to 1" over
the southern half of Minnesota by Friday.
On The Other Hand. The latest NAM model prints out
about 1" of rain for the Twin Cities by Wednesday morning, with a smear
of heavier precipitation over northern Minnesota, some 2-3" liquid
amounts for the western Dakotas, falling as mostly snow. It's the March
That Wouldn't End.
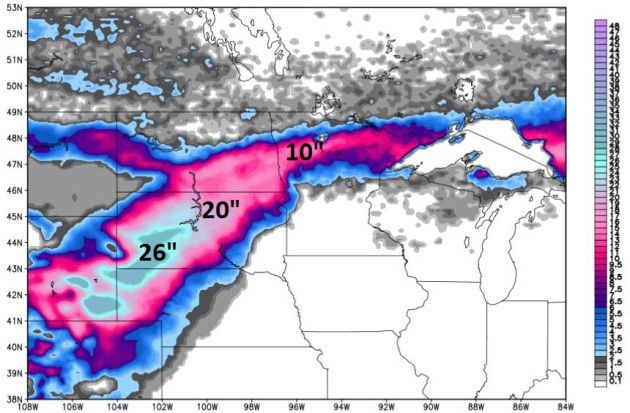
Good News For Therapists. Your billable hours just
went up, especially if you live in the Red River Valley or the Dakotas,
where some 10-20" snowfall amounts are predicted by Wednesday by the
latest NAM model. No snow for the Twin Cities into at least midweek.
A Real Storm? The GFS pulls an
intense storm northeastward across the Plains, spreading potentially
significant rain into Minnesota Tuesday and Wednesday; a clearing trend
by late week (with cooler than average temperatures). Again, a
significant north-south temperature gradient across the USA is setting
the stage for potentially significant rain in the weeks to come.
Mental Health Day on Thursday? It's too early to
panic, but the ECMWF (Euro) model is still suggesting enough cold air in
the lowest mile of the atmosphere for rain ending as wet snow (in the
Twin Cities) by Thursday. Highs reach the 50s Monday before cooling down
later in the week - no more spring-worthy warm fronts are brewing
looking out 10 days or so.
Impact Based Warnings. Minnesota is one of 14 states
that will see new, enhanced wording of tornado warnings, to try to
better reflect and communicate the risks to consumers in the potential
path. Details from
NOAA's Central Region: "
An
experimental National Weather Service warning enhancement will be used
across much of the central U.S. this thunderstorm season (beginning
April 1). This is an expansion of a smaller NWS experiment that began in
Kansas and Missour in 2012. The Impact Based Warning (IBW) experimental
product is an effort to better communicate severe weather threats
within National Weather Service warnings. While the basic function of
Severe Thunderstorm and Tornado warnings will remain the same,
additional enhanced information will be provided within the warning to
provide additional expected "impact" information. The goals are to
provide more information through the warnings in order to facilitate
improved public response and decision making, and to better meet
societal needs in the most life-threatening weather events. This effort
is in response to key findings from recent service assessments of
devastating tornadoes in 2011, particularly the EF-5 tornado in Joplin,
MO..."
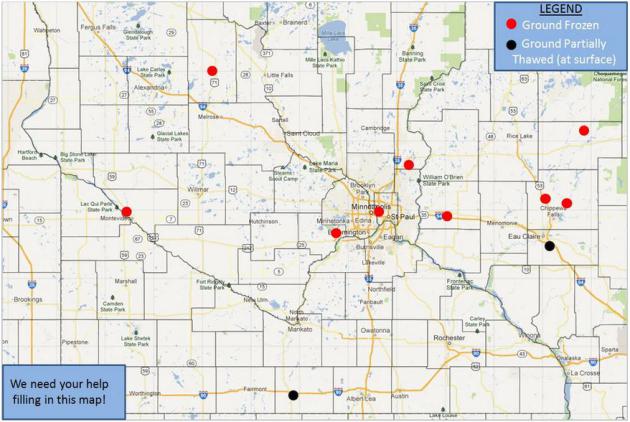
NOAA Needs Your Help. The local Twin
Cities National Weather Service is interested in knowing whether the
ground is still frozen in your neighborhood. Why does this matter? The
extent and depth of lingering frost in the ground will help to determine
rainfall run-off rates next week, when we may see a significant storm.
This will impact not only the potential for minor flash flooding in the
Twin Cities, but more significant river flooding, especially on the Red
River in the weeks to come.
Details: "
As
we head in to Spring, potential flooding is a primary concern across
Minnesota and Wisconsin. We could use your help in determining if the
ground is still frozen, or if there has been some partial thaw of the
ground. As you can see on the map below, we have quite a large area
with no data across southern MN and western WI. Visit our Facebook Page or send us a message via Twitter @NWSTwinCities and let us know what the ground condition is like at your location."
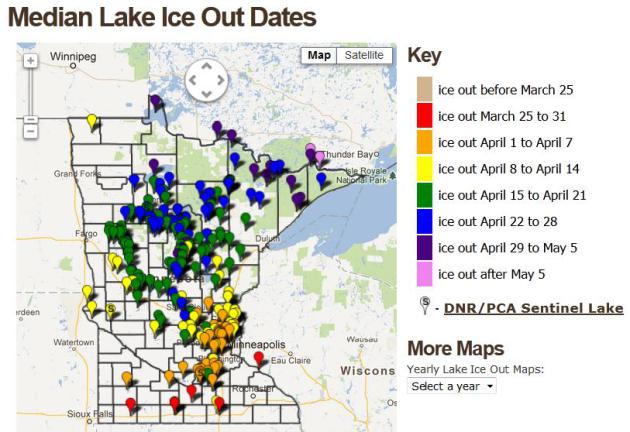
Median Lake Ice Out Dates. The
interactive map
above shows median dates when most of the ice is off Minnesota's lakes.
For Nokomis the date is April 5. Not this year. Map courtesy of the
Minnesota DNR.
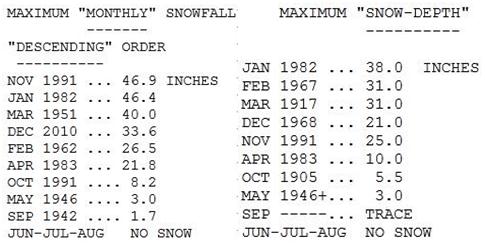
Scary Numbers. Data from the Minnesota Climate
Office reminds us just how harsh 1983 was in the Twin Cities. That
"spring" we picked up a whopping 21.8" of snow during April. I had just
arrived in Minnesota the previous month to work at WTCN-TV (now
KARE-11), and I remember wondering what I had gotten myself into. Yes,
it can always be worse.
HydroClim Update. Here are a few bullet points from the
latest update, courtesy of the Minnesota State Climate Office and the Minnesota office of the DNR:
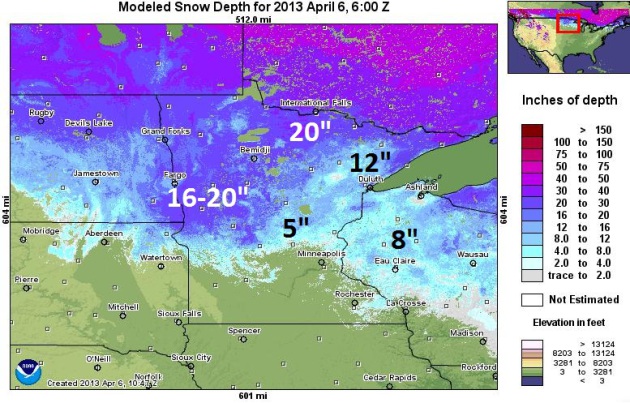
- Snow depths range from zero in the
southern one-third of Minnesota to over 20 inches west central
Minnesota, north central Minnesota, and in the Lake Superior highlands.
[see: NWS Snow Depth Estimation Map | Snow Depth Maps]
- The amount of water content in the snow pack
is estimated to be in excess of five inches in some west central and
north central Minnesota counties. The large amount of water on the
landscape, lying upon an impervious frozen surface, has led to a high risk for major flooding in the Red River basin.
[see: NWS Snow Water Equivalent Estimation Map]
- The U.S. Geological Survey and Minnesota DNR report that stream discharge values
vary widely across the state. After the initial flush of snow melt
runoff recedes, stream discharge values will quickly fall below
historical medians unless there is a very wet spring.
[see: USGS Stream Flow Conditions | MNDNR Weekly Stream Flow Maps and Tables]
- Water levels on most Minnesota lakes
are low due to the dry summer and autumn of 2012. Lake Superior's
water level is approximately one foot lower than its historical average
for this time of year.
* latest modeled snow depth from NOAA is
here.
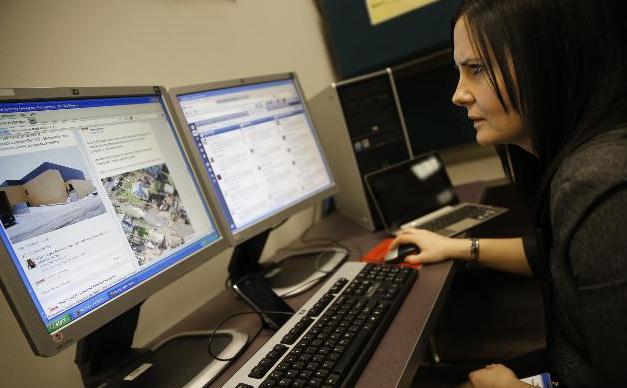
Weather, Disaster Agencies Turn To Twitter, Facebook, YouTube. Bill McAuliffe at
The Star Tribune
takea look at The Star Tribune takes a look at social media's impact on
weather coverage, specifically severe storm tracking and communication.
As I say in the article, I suspect it's a mixed blessing: nice to have
more information, but be sure you're following "trusted sources" to get
reliable, actionable information. Here's an excerpt: "
With the
season for quick-hitting storms about to barge into Minnesota, social
media are about to become a key news tool. Indeed, public agencies
concerned with natural disasters are glomming onto social media like so
many teenagers, attracted to its instant, two-way connectivity. “It’s
fast. It’s direct. It enhances our ability to deliver the message,” said
Bruce Gordon, director of communications for the Minnesota Department of Public Safety,
whose 12 public information officers post breaking news, safety tips
and even human interest stories on Facebook, Twitter and YouTube..."
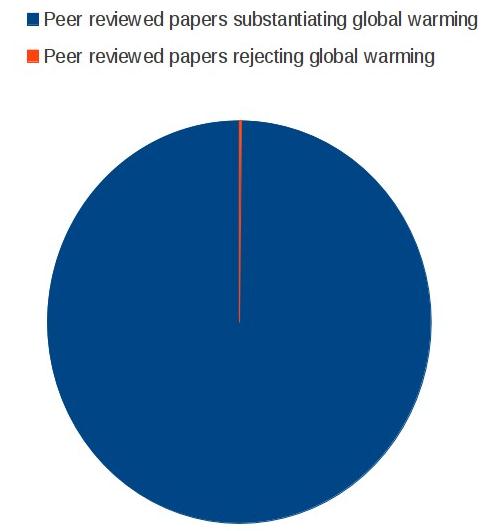
Climate Stories....
No Debate In The Scientific Community. Graph above courtesy of Greg Laden at
scienceblogs.com.
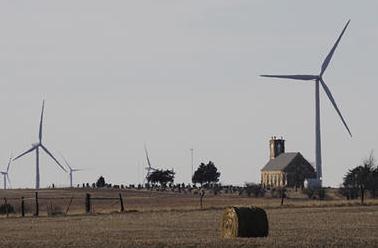
How U.S. Energy Policy Fails To Address Climate Change.
The Christian Science Monitor reports; here's an excerpt: "
What
never gets asked and answered definitively in the policy debate is
this: What should our ultimate goal be and when should we aim to
achieve it? The first part of the question has elicited so many answers
from so many constituencies that I may not be able to represent them
all here. But here is an attempt to categorize the main lines of
thinking concerning the country’s energy goals:
- Seek the cheapest price for energy with the implication that
environmental consequences should not be tallied as part of the cost.
- Complete a transition to renewable energy as quickly as possible while drastically reducing the burning of fossil fuels.
- Replace all fossil fuel energy with nuclear power..."
Photo credit above: "
Wind turbines of the Smoky Hill Wind
Farm dot the countryside near Ellsworth, Kan. Perhaps the simplest way
to manage the energy transition we must undergo would be to impose a
high and ever rising tax on carbon, Cobb writes." Orlin Wagner/AP/File
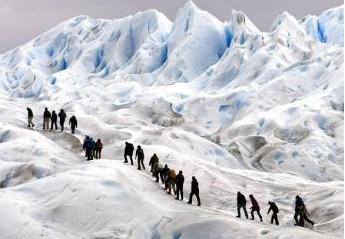
Global Warming: 1,600 Years Of Ice In Andes Melted In 25 Years. Here's an excerpt from
frenchtribune.com : "
Providing one of the signs of global warming,
glacial ice in the Peruvian Andes has started melting. A structure
that took 1,600 years to build has fallen into the grip of high
temperatures and melted within 25 years. The research has been conducted by Lonnie G. Thompson, the Ohio State University glaciologist. According to him, his team has worked
from time to time on the Quelccaya ice cap for decades. Findings have
been published in a paper that has been released online. Global warming
is one of the results of man-made activities. This recent report
has highlighted that the problem of global warming has reached its
peak. This time the proof has been provided by margins of the Quelccaya
ice cap in Peru..."
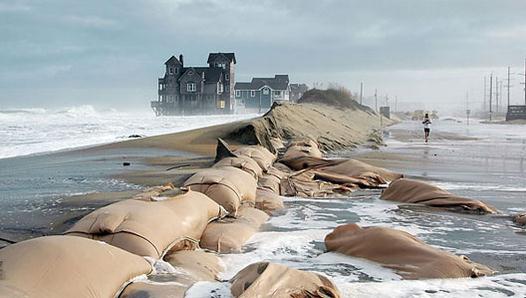
Even Doubter Wants To Prepare For Global Warming.
Mother Nature News has the article; here's the intro: "
Some
still insist that climate change is a hoax, but the vast majority of
Americans believe the globe is warming, a new survey finds — and they
want to prepare for the worst. In fact, even 60 percent of
climate-change doubters favored preparations, the survey found.
Researchers collected opinions between March 3 and March 18 via an
online questionnaire, using a nationally representative sample of 1,174
American adults, both English and Spanish speaking. The survey asked
about climate-change beliefs and support for adaptation strategies
to help coastal areas cope with the rising sea levels and frequent,
intense storms that a warmer world could bring. The results showed that
82 percent of Americans are in favor of preparation..."
Photo credit above: "
Sea level rise is swamping coasts. Rodanthe in the Outer Banks of North Carolina is pictured."(Photo: Andrew Kemp, Yale University)
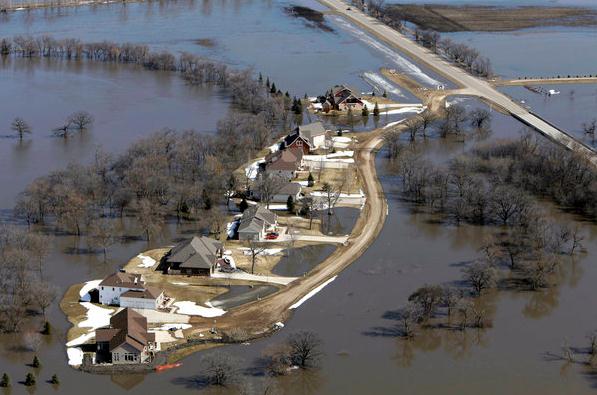
Federal Study: Global Warming Means More "Extreme" Rains.
Basic physics: warm up the atmosphere, even by a few degrees, and you
increase the capacity of the sky overhead to hold more water vapor
(which is itself another greenhouse gas). The result? More fuel for
extreme rains (and snows).
The Hill has the story; here's the intro: "
Global
warming will make cases of “extreme” rainfall even more intense and
worsen flood risks, federal researchers say in the latest warning that
climate change will likely worsen violent weather. A new federally led
study explores how growing amounts of atmospheric water vapor due to
global warming will affect what is called probable maximum
precipitation. The report, released by the National Oceanic and
Atmospheric Administration, forecasts an “accelerated water cycle with
heavier extreme rains.” The study shows “a 20-30 percent expected
increase in the maximum precipitation possible over large portions of
the Northern Hemisphere by the end of the 21st century if greenhouse
gases continue to rise at a high emissions rate,” NOAA said..."
Photo credit above: "
The flooded Red River surrounds
houses near Fargo, N.D., in 2010. Scientists say climate change will
produce more intense storms, increasing the risk of damaging floods."
(M. Spencer Green / Assoicated Press / March 21, 2010)
* The Los Angeles Times has another perspective on the potential for more extreme rains
here.
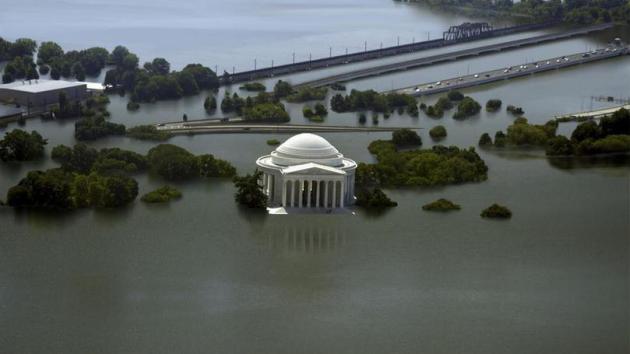
Rising Seas Swallow 8 Cities In These Climate Change GIFS.
Mashable has the story; here's an excerpt: "
Climate
change and global warming may cause sea levels to rise and flood
coastal cities across the world. Over the past century, the Global Mean
Sea Level has risen by 4 to 8 inches. And according to estimates by
the National Oceanic and Atmospheric Administration (PDF),
it will keep rising between 8 inches and 6.6 feet by 2100. How will the
world look if that happens? In November of 2012, The New York Times
published interactive maps displaying the effects of the sea level
rising, in a series titled "What Could Disappear?"
The maps show how much land the sea will claim in the future, if it
rises by 5, 12, and 25 feet. Nickolay Lamm, a 24-year-old researcher and
artist saw the interactive maps and wondered: "What would this
actually look like in real life?" Lamm told Mashable in an email
interview that "the only imagery I had of sea level rise came from
Hollywood." So he decided to put his skills to work..."
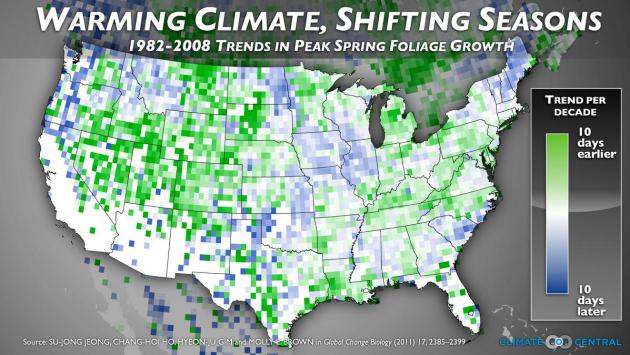
Spring Leaf-Out Comes 6 Days Earlier Than It Did In 1982. Here's an excerpt of some new research from Climate Central that caught my eye: "...
The
map shows that leaves are coming earlier in some parts of the country,
like the Rocky Mountains and Appalachians, but that spring leaf-out has
been delayed over time in parts of the Southeast, Northeast and Midwest.
This is consistent with climate research that shows that many types of
plants have not been blooming uniformly earlier over time. We looked at
the difference between when this time arrived during the first five
years and the last five years of the study. In the Minneapolis area,
this date is coming about six days earlier on average since 1982. Rising
temperatures may actually be behind the way this date shifts in both
directions. New research suggests that the response of spring leaves to
warming temperatures may not be linear, due to the effects of reduced
winter chilling, and increased vulnerability to late-winter freezes. A
continuing trend of warming winters may lead to further changes in the
familiar timing of the seasons..."
