Pushing The Envelope
I'm at a Severe Storms & Doppler Conference
in Des Moines, focused on best practices for tornado prediction. We've
made progress: advanced lead-time for tornadoes has gone from 6 minutes
in the 70s to 13 minutes today. Predicting polygon tracks means fewer
people have to be warned, cutting down on confusion. But the false alarm
rate is still 75 percent. In other words, 3 out of 4 warnings don't
produce an actual tornado.
NOAA will use more
emphatic wording
in 2013, especially when there is confirmation of a tornado on the
ground. Expect to hear words like "catastrophic", even "you could be
killed if you aren't in a basement or underground shelter" if there is a
large, violent tornado on the ground, moving into a populated area.
New, high-res models, capable of a 40-60 minute tornado probability, are
probably 4-8 years away. Hospitals and businesses may get advance
notice of a high probability of tornadoes before general consumers,
giving them more time to prepare, move patients and employees, etc. The
WSR-88D "NEXRAD" Doppler radars are almost 25 years old, and at some
point they will be replaced, possibly with "phased-array radars" that
can take a 3-D snapshot of the atmosphere within seconds vs. minutes,
speeding up the tracking and warning process.
One problem: many people still wait to get
confirmation from multiple sources (TV, radio, apps, a phone call)
before they do the right thing and head for shelter. Waiting for
confirmation can cost you your life; apathy and delay (along with a lack
of basements) resulted in 161 deaths from Joplin's EF5 tornado on May
22, 2011.
A major severe outbreak is shaping up for the
Southern Plains early next week. Closer to home the risk of Red River
flooding will rise in coming weeks.
Rain is likely today, but a major southern storm may drop over 1" rain Monday & Tuesday; possibly ending as midweek slush.
Something to look forward to.
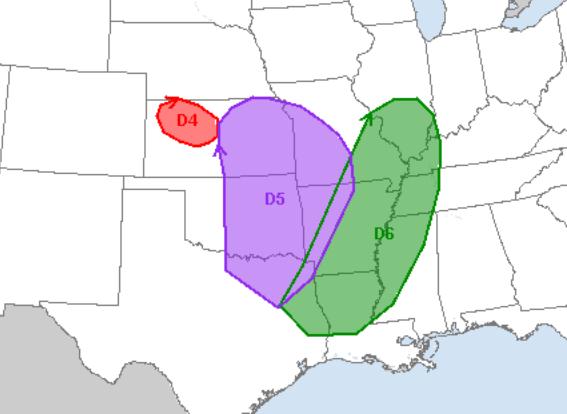
Major Severe Storm Outbreak Next Week?
All the dynamics are coming together for a potentially significant
outbreak of severe storms and tornadoes the first half of next week. D4
refers to Monday, D5 is Tuesday, the green area shaded D6 spills into
Wednesday of next week. Low-level moisture, severe instability and a
strong jet streak rotating around a deep trough of low pressure could
set the stage for a series of large, violent, long-track tornadoes. Map
above: SPC.

NOAA Needs Your Help. The local Twin
Cities National Weather Service is interested in knowing whether the
ground is still frozen in your neighborhood. Why does this matter? The
extent and depth of lingering frost in the ground will help to determine
rainfall run-off rates next week, when we may see a significant storm.
This will impact not only the potential for minor flash flooding in the
Twin Cities, but more significant river flooding, especially on the Red
River in the weeks to come.
Details: "
As
we head in to Spring, potential flooding is a primary concern across
Minnesota and Wisconsin. We could use your help in determining if the
ground is still frozen, or if there has been some partial thaw of the
ground. As you can see on the map below, we have quite a large area
with no data across southern MN and western WI. Visit our Facebook Page or send us a message via Twitter @NWSTwinCities and let us know what the ground condition is like at your location."
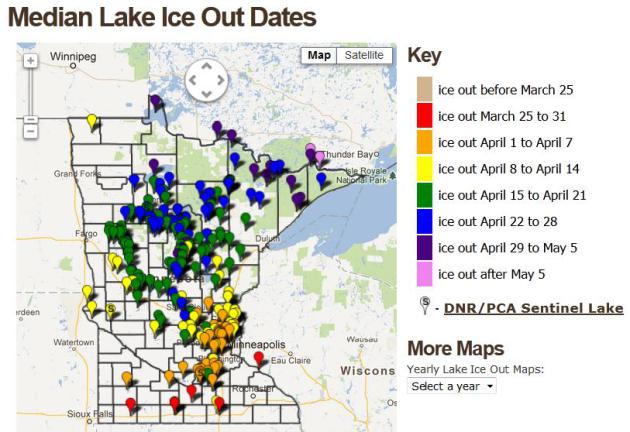
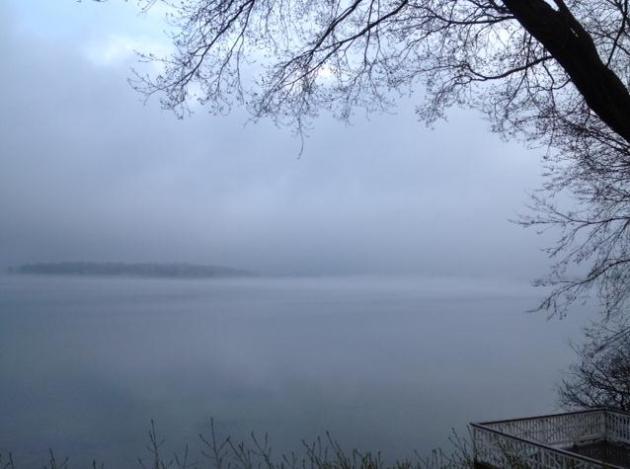
Median Lake Ice Out Dates. The
interactive map
above shows median dates when most of the ice is off Minnesota's lakes.
For Nokomis the date is April 5. Not this year. Map courtesy of the
Minnesota DNR.
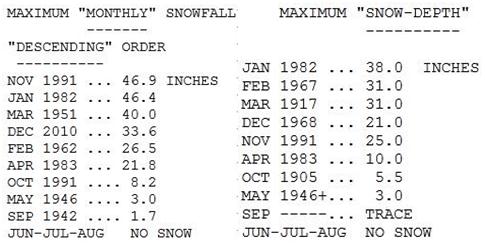
Scary Numbers. Data from the Minnesota Climate
Office reminds us just how harsh 1983 was in the Twin Cities. That
"spring" we picked up a whopping 21.8" of snow during April. I had just
arrived in Minnesota the previous month to work at WTCN-TV (now
KARE-11), and I remember wondering what I had gotten myself into. Yes,
it can always be worse.
Dueling Models. The uncertainty over next week's
forecast is even greater than usual. Most of the U.S. and Canadian
models bring very significant rain north as an intense area of low
pressure pushes across the Plains into the Upper Mississippi River
Valley, maybe a couple inches of rain nearby. But the (normally
reliable) ECMWF/European model keeps the heaviest rain just south of
Minnesota, bringing showery rains in Monday, maybe a rain-snow mix by
Thursday. It's too early for specifics, but here are some of the model
solutions. Graphic above: Iowa State.
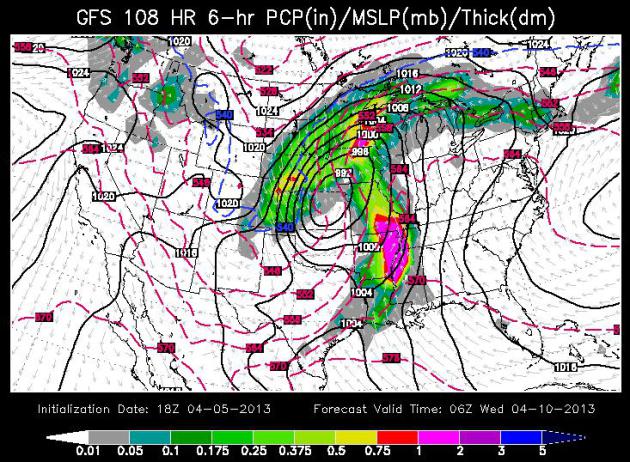
Full Latitude Storm. We haven't seen this for some
time. The GFS spins up a major storm over the Central Plains early next
week, pushing a shield of heavy rain (and possible T-storms) northward.
The availability of Gulf moisture coupled with the slow forward motion
of the storm could spell out significant amounts of rain, changing to
wet snow across the Dakotas. Map above valid midnight Tuesday night of
next week courtesy of WSI.
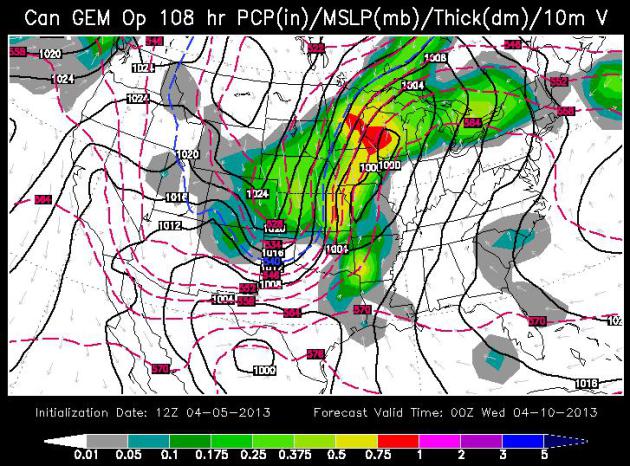
GEMS Model. The Canadian model has a similar
solution, not quite as intense, but showing a surge of southern moisture
pushing into Minnesota Monday - Wednesday of next week, possibly ending
as wet snow from the Dakotas into portions of western and central
Minnesota. WSI model data above valid next Tuesday evening.
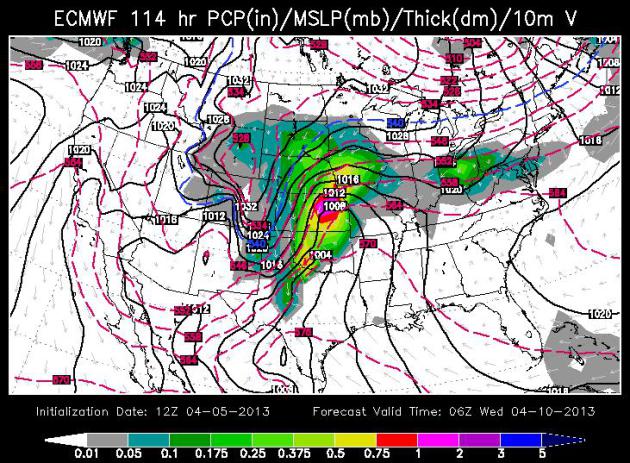
European Solution. The ECMWF keeps the brunt of the
moisture south of Minnesota, just brushing southern counties with a cold
rain next Tuesday, a second surge next Thursday bringing rain and even a
period of wet snow. I normally lean toward the "Euro", but all the U.S.
and Canadian models are suggesting a more northward track, so I suspect
we may wind up with more rain than the ECMWF is printing out. We'll
see.
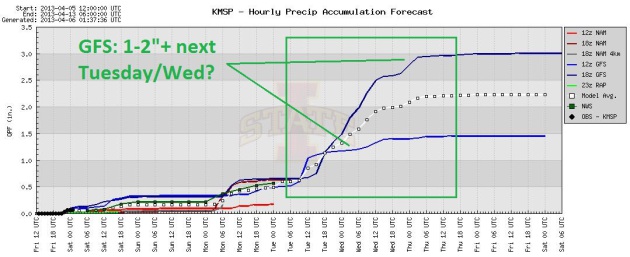
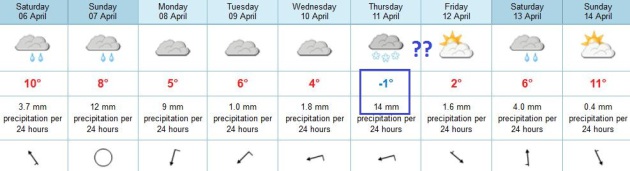
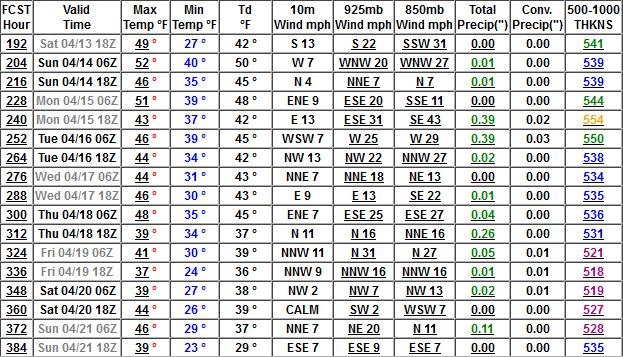
High Bust Potential. That's meteorological slang for
"there's much that can go wrong with this forecast". Confidence levels
are low for next week, but the ECMWF guidance (above) for MSP shows
mostly light showers today, heavier rain late Sunday into Monday
morning, with next week's storm tracking too far south for heavy rain
across most of Minnesota. A period of rain/snow is predicted for next
Thursday. Let's hope the Euro is wrong on this call.
Close To Throwing In The Towel On April. What
happened to the 60s Paul? Good question. That's what I want to know too.
After a few runs/row of 60s after April 18 the latest GFS run keeps us
chilly (40s, maybe some 50s) into at least April 21. Wet and cool. Maybe
May will be better.
Red River Flooding Likely To Peak After Mid-April In Fargo-Moorhead Area, USGS Says.
INFORUM has the story; here's an excerpt: "
Peak
flooding on the Red River in the Fargo-Moorhead metro area will likely
occur sometime after April 15, according to the U.S. Geological Survey
and National Weather Service. USGS stream gauges indicated that on
Wednesday the Red still had not begun its spring rise. That means this
year’s flood will be much later than the large floods of 2009 and 2011.
This year’s flood also likely will be later than the 1997 flood, which
was exacerbated by an early April blizzard, USGS predicts. “The large
floods at Fargo that have previously occurred in April – 1952, 1965,
1969, 1979, and 1997 – peaked from April 15 to April 19,” said Gregg
Wiche, director of the USGS North Dakota Water Science Center.
“Above-normal snowpack and cold March temperatures have contributed to
this year’s late melt...”
HydroClim Update. Here are a few bullet points from the
latest update, courtesy of the Minnesota State Climate Office and the Minnesota office of the DNR:
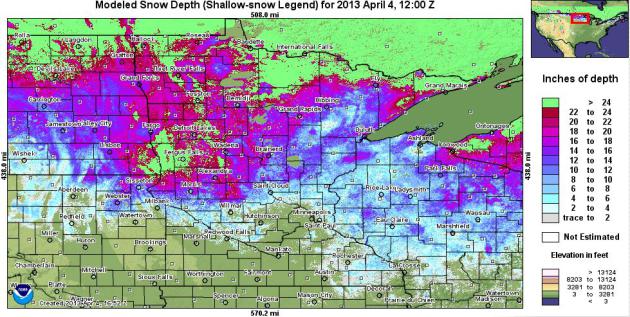
- Snow depths range from zero in the
southern one-third of Minnesota to over 20 inches west central
Minnesota, north central Minnesota, and in the Lake Superior highlands.
[see: NWS Snow Depth Estimation Map | Snow Depth Maps]
- The amount of water content in the snow pack
is estimated to be in excess of five inches in some west central and
north central Minnesota counties. The large amount of water on the
landscape, lying upon an impervious frozen surface, has led to a high risk for major flooding in the Red River basin.
[see: NWS Snow Water Equivalent Estimation Map]
- The U.S. Geological Survey and Minnesota DNR report that stream discharge values
vary widely across the state. After the initial flush of snow melt
runoff recedes, stream discharge values will quickly fall below
historical medians unless there is a very wet spring.
[see: USGS Stream Flow Conditions | MNDNR Weekly Stream Flow Maps and Tables]
- Water levels on most Minnesota lakes
are low due to the dry summer and autumn of 2012. Lake Superior's
water level is approximately one foot lower than its historical average
for this time of year.
* latest modeled snow depth from NOAA is
here.
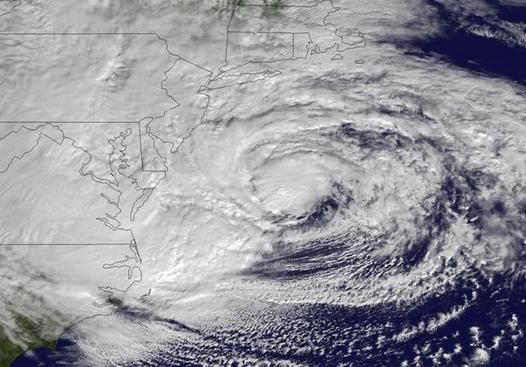
Criticism After Sandy Leads To Changes In The Way Hurricane Warnings, Watches Are Issued.
Technically, Sandy wasn't a hurricane (warm core storm) when it hit New
Jersey and metro New York. NOAA discontinued Hurricane Warnings, which
caused many coastal residents to lower their guard a little. Big
mistake. Changes are coming, as documented in this
Washington Post story; here's an excerpt: "...
Under
the new policy, the hurricane center in Miami will continue to put out
warnings and advisories if a storm threatens people and land, even if a
hurricane or tropical storm loses its name and becomes something
different. “Our forecasters now have more flexibility to effectively
communicate the threat posed by transitioning tropical systems,” said
Louis Uccellini, the director of the National Weather Service, which is
part of the National Hurricane Center. “Sandy’s forecast was
remarkably accurate and under a similar situation in the future,
forecasters will be able to choose the best option to underscore the
urgency involved...”
Climate Stories....
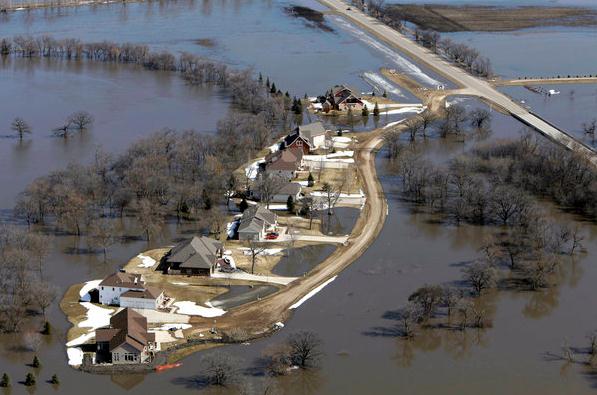
Federal Study: Global Warming Means More "Extreme" Rains.
Basic physics: warm up the atmosphere, even by a few degrees, and you
increase the capacity of the sky overhead to hold more water vapor
(which is itself another greenhouse gas). The result? More fuel for
extreme rains (and snows).
The Hill has the story; here's the intro: "
Global
warming will make cases of “extreme” rainfall even more intense and
worsen flood risks, federal researchers say in the latest warning that
climate change will likely worsen violent weather. A new federally led
study explores how growing amounts of atmospheric water vapor due to
global warming will affect what is called probable maximum
precipitation. The report, released by the National Oceanic and
Atmospheric Administration, forecasts an “accelerated water cycle with
heavier extreme rains.” The study shows “a 20-30 percent expected
increase in the maximum precipitation possible over large portions of
the Northern Hemisphere by the end of the 21st century if greenhouse
gases continue to rise at a high emissions rate,” NOAA said..."
Photo credit above: "
The flooded Red River surrounds
houses near Fargo, N.D., in 2010. Scientists say climate change will
produce more intense storms, increasing the risk of damaging floods."
(M. Spencer Green / Assoicated Press / March 21, 2010)
* The Los Angeles Times has another perspective on the potential for more extreme rains
here.
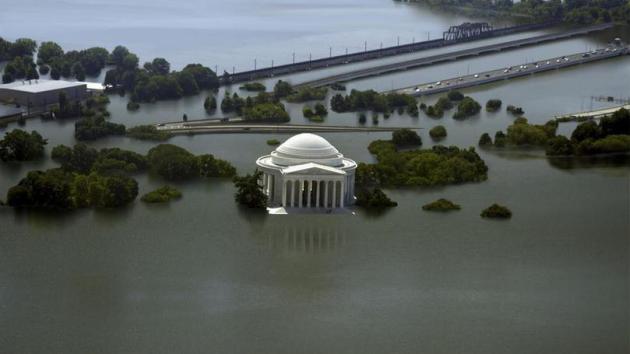
Rising Seas Swallow 8 Cities In These Climate Change GIFS.
Mashable has the story; here's an excerpt: "
Climate
change and global warming may cause sea levels to rise and flood
coastal cities across the world. Over the past century, the Global Mean
Sea Level has risen by 4 to 8 inches. And according to estimates by
the National Oceanic and Atmospheric Administration (PDF),
it will keep rising between 8 inches and 6.6 feet by 2100. How will the
world look if that happens? In November of 2012, The New York Times
published interactive maps displaying the effects of the sea level
rising, in a series titled "What Could Disappear?"
The maps show how much land the sea will claim in the future, if it
rises by 5, 12, and 25 feet. Nickolay Lamm, a 24-year-old researcher and
artist saw the interactive maps and wondered: "What would this
actually look like in real life?" Lamm told Mashable in an email
interview that "the only imagery I had of sea level rise came from
Hollywood." So he decided to put his skills to work..."
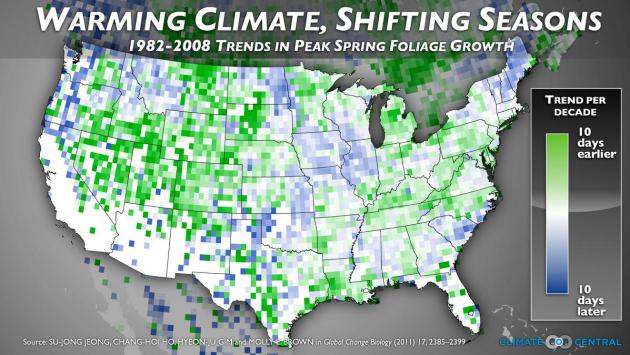
Spring Leaf-Out Comes 6 Days Earlier Than It Did In 1982. Here's an excerpt of some new research from Climate Central that caught my eye: "...
The
map shows that leaves are coming earlier in some parts of the country,
like the Rocky Mountains and Appalachians, but that spring leaf-out has
been delayed over time in parts of the Southeast, Northeast and Midwest.
This is consistent with climate research that shows that many types of
plants have not been blooming uniformly earlier over time. We looked at
the difference between when this time arrived during the first five
years and the last five years of the study. In the Minneapolis area,
this date is coming about six days earlier on average since 1982. Rising
temperatures may actually be behind the way this date shifts in both
directions. New research suggests that the response of spring leaves to
warming temperatures may not be linear, due to the effects of reduced
winter chilling, and increased vulnerability to late-winter freezes. A
continuing trend of warming winters may lead to further changes in the
familiar timing of the seasons..."
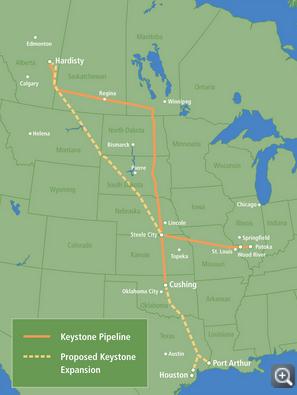
Keystone XL Stirs Montana Farmer's Climate And Crop Concerns.
Huffington Post reports; here's an excerpt: ".."
In
terms of carbon emissions, Alberta tar sands are among the worst of
the worst," said John Abraham, an engineering profesor at the University
of St. Thomas. The other problem, he added, is the massive quantity of
that crude oil. A study published last year in Nature Climate Change
found that if all the oil in Alberta was harvested -- now only a
theoretical possibility unless new technology emerges as fracking did for tapping previously hard-to-reach reserves of natural gas -- global temperatures would rise
nearly 0.4 degrees Celsius (about 0.7 F), without taking into account
emissions from energy used during the extraction, upgrading and refining of the heavy crude.
That figure is arguably significant in the context of keeping any
increase in global temperatures below the 2-degrees Celsius benchmark
world leaders have agreed is critical for avoiding the most dangerous
effects on the climate system. The planet has already warmed by 0.8
degrees Celsius..." (graphic: U.S. State Department).