Son of Polar Vortex
"As
the days lengthen, the cold doth strengthen" the proverb goes. Yes it
doth. Tired of the cold? Well, it's not tired of you. Not yet. Although I
do see a faint glimmer of hope at the end of our polar tunnel.
Long-range guidance shows some moderation late next week into early
February, as the core of the coldest air lifts into Canada, however
temporarily.
But through the middle of next week the Polar Vortex
will do a painful pirouette - spokes of numbing air rotating fresh
bursts of subzero air into the northern USA, one after another.
Temperatures
struggle to hit 0F today, and highs next Monday may range from -3 to
-8F; nearly as gasp-inducing as January 6-7. Some schools may close.
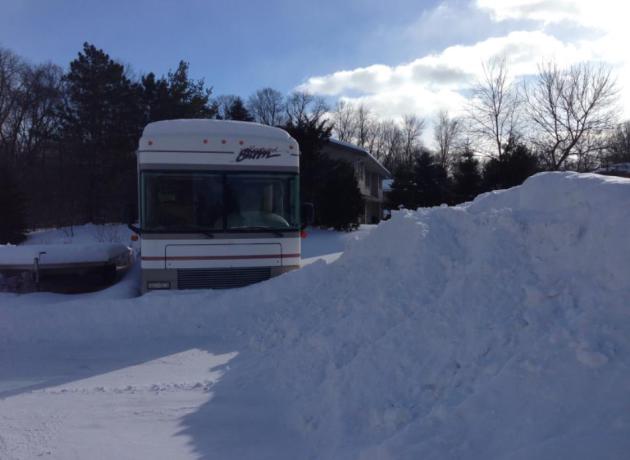
A
clipper drops an inch or two of snow on your yard late Friday, again
late Saturday, a brief uptick in temperature before the next inevitable
temperature tumble on Sunday. Yes, a real winter.
Staring out your
ice-encrusted window you may be wondering, "what happened to global
warming?"
NOAA reports that, globally, 2013 was the 4th warmest since
1880. Check out the blog; the entire planet was warmer in 2013 except
for central Canada and parts of the US.
Perception becomes reality, right?
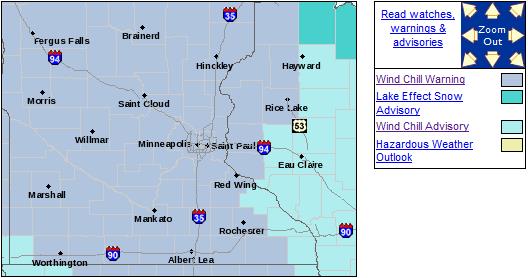 No Garden-Variety Cold Front
.
Wind Chill Warnings are posted this morning for most of Minnesota and
western Wisconsin, including the Twin Cities metro area. Details from
NOAA:
...WIND CHILL WARNING REMAINS IN EFFECT UNTIL NOON CST THURSDAY...

A WIND CHILL WARNING REMAINS IN EFFECT UNTIL NOON CST THURSDAY.

* TIMING: SUBZERO TEMPERATURES WILL CONTINUE THROUGH THURSDAY.

* WIND CHILL VALUES: AVERAGING BETWEEN 35 TO 45 BELOW ZERO.

* WIND CHILL IMPACTS: EXPOSED SKIN MAY FREEZE IN AS LITTLE AS 5
  TO 10 MINUTES.

PRECAUTIONARY/PREPAREDNESS ACTIONS...

A WIND CHILL WARNING MEANS THE COMBINATION OF VERY COLD AIR AND
STRONG WINDS WILL CREATE DANGEROUSLY LOW WIND CHILL VALUES. THIS
WILL RESULT IN FROST BITE AND LEAD TO HYPOTHERMIA OR DEATH IF
PRECAUTIONS ARE NOT TAKEN.
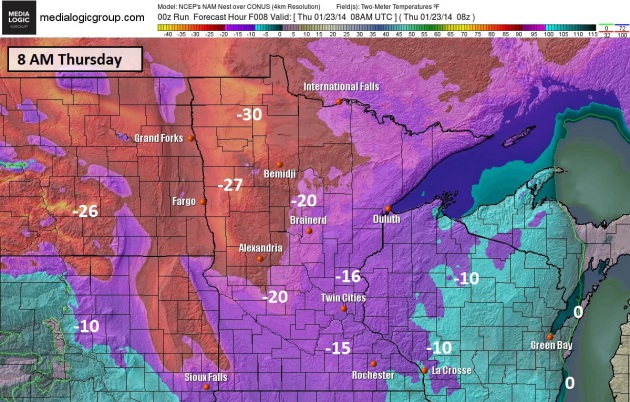
A Return Of Character-Building Cold.
We wake up to -15 or -16F this morning, a few degrees warmer in the
downtown core (urban heat island). Air temperatures may be as cold as
-20 from Alexandria and Brainerd to -30 over the Red River Valley.
Bordering on school-closing cold. Then again, do they close schools in
Canada? Not sure on that one, but I seriously doubt it.
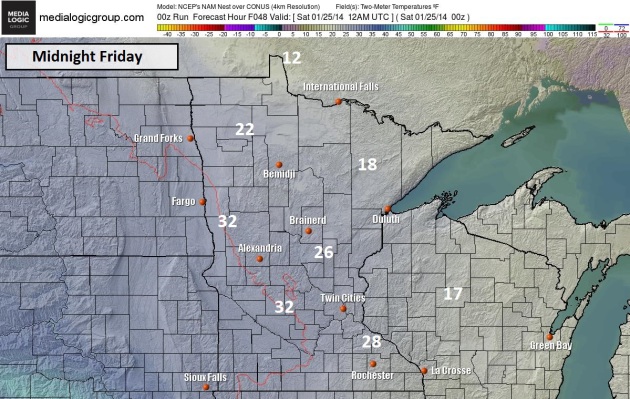
As Warm As It's Going To Get The Next Week.
2-meter NAM guidance (NOAA) shows temperatures moderating into the
upper 20s to near 30F Friday night as a clipper temporarily pulls milder
air north. Grilling weather. Map: Ham Weather.
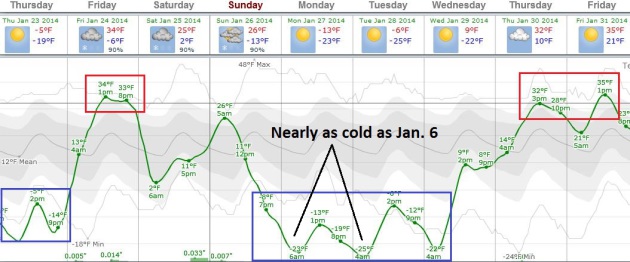
Deja Vu All Over Again.
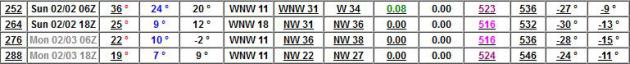
Although not quite as cold as January 6-7 the distinction may be lost
on most mere mortals, this latest chunk of the polar vortex arriving
early next week as temperatures bottom out. Daytime "highs" Monday may
hold in the -3 to -8F range, with wake-up temperatures as cold as -17 to
-21F in the metro area Monday and Tuesday morning. 30s will feel like
sweet relief by the end of next week. ECMWF guidance: Weatherspark.
Tracking The Polar Pain.
Here are 2-meter temperatures out to 84 hours, courtesy of NOAA's NAM
model. The 32F isotherm pushes into Texas, the Gulf Coast and central
Florida (frost at Disneyworld?) Subzero weather pushes from the Upper
Mississippi Valley across the Great Lakes into much of New England.
Animation: Ham Weather.
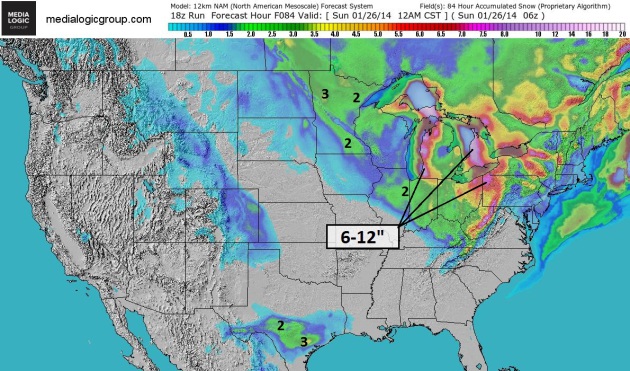
More Lake Effect.
Subzero air passing over the relatively warm waters of the Great Lakes
will whip up more snow squalls capable of significant accumulation,
especially Lower Michigan, Cleveland, Erie and Buffalo. NAM guidance:
NOAA and Ham Weather.
First Week Of February: Cold, But Not Polar.
Some slight moderation is likely into early February with highs in the
teens - no sign of any Gulf moisture capable of whipping up a major
snowstorm. Not yet.
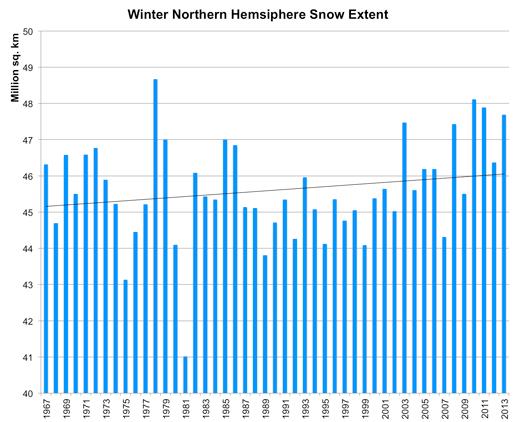
Big Picture Snowfall Trends.
It's easy to confuse weather with climate - we're hard-wired to react
to what's outside our window at any given point in time. Data from
Rutgers University Global Snow Lab suggests that winters over the
Northern Hemisphere are, in fact, getting snowier, possibly the result
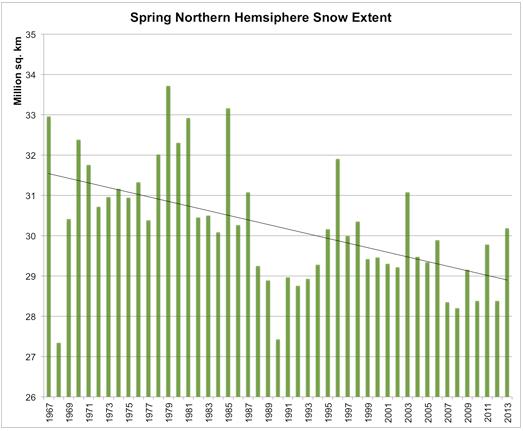
of more water vapor in the air. But spring snowfall trends are just the
opposite - it's warming up faster, meaning less snow spilling over into
March and April. Rapid melting of arctic ice during the summer months
means less snow cover over the entire Northern Hemisphere from year to
year, especially since 2000. That, and the recent snow in the Northeast,
is the subject of today's edition of
Climate Matters.
Grrrr. I know Doug MacKenzie, from
VisitPhoenix.com,
meant well when he passed this along yesterday. He wasn't trying to rub
in the fact that it was 81F at Phoenix, right? I'm assuming honorable
intentions here - he was just informing all of us that it's warmer in
Arizona than it is in Minnesota. Let me write that down.
January 22, 2014, Phoenix, AZ….
Visitors
arriving in the Southwest today from the Midwest are enjoying a wintry
escape from polar vortex temps up north. The temps today in Phoenix will
rise to 81 degrees. The biggest decisions are not which mittens to don,
but rather to play golf or relax by a resort pool. “Our northern
latitude friends are invited to leave their winter gear at home and thaw
out in Greater Phoenix, “ explained Doug MacKenzie, Director of Media
Relations for VisitPhoenix.com. “We offer more than 60,000 hotel rooms
to fit everyone’s budget. The Waste Management Open, one of the largest
golf tourneys commences next week and baseball’s spring training
pitchers arrive the following week.”Visitors planning a getaway can see
the various attractions, things to do, where to eat, and explore hotel
options at VisitPhoenix.com. Phoenix is the 6th largest city in the USA and offers numerous daily flights."
grrrrrrrrrrrrrrrrrrrrrrrrrrrrrrrrrrrrrrrrrrrrrrrrrrrrrrrrrrrrrrrrrrrrrrrrrrrrrrrrrrrrrrrrrrr...................................
Super Bowl Weather Preview.
The latest solutions are colder than they were for the Meadowlands in
New Jersey just a few days ago, suggesting temperatures in the upper 20s
and low 30s, a cold wind, but probably dry. A blizzard for Super Bowl
XLVIII? Right now I don't see it.
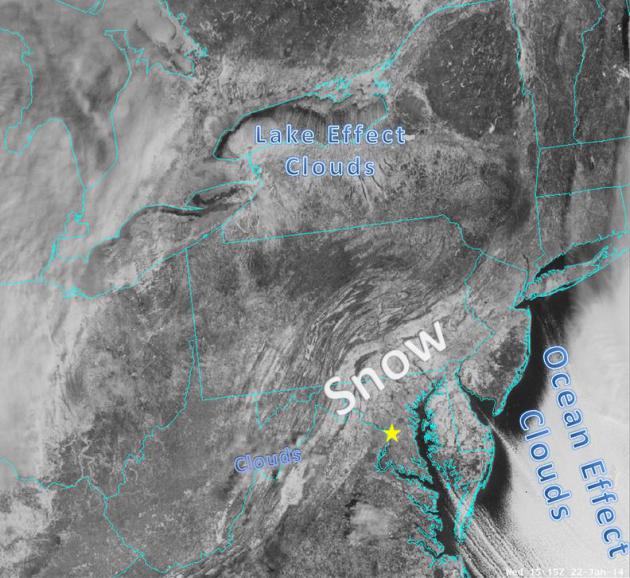
Snowcover From Space.
Here's a visible satellite image taken Wednesday, showing fresh snow on
the ground from the Virginias into coastal New England, courtesy of the
Baltimore-Washington National Weather Service.
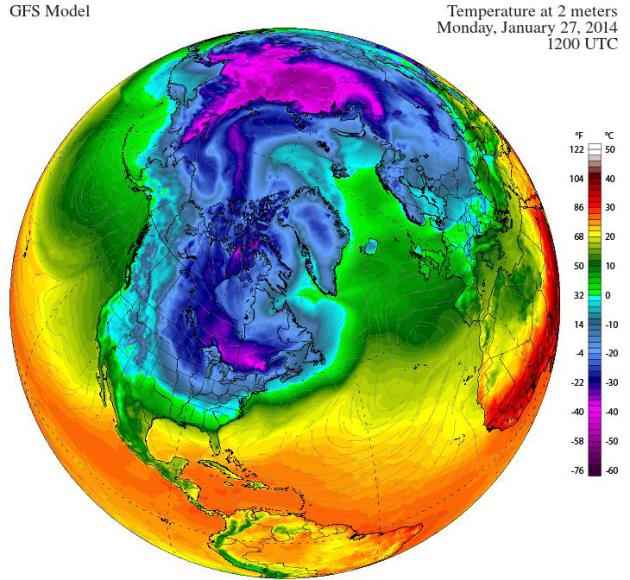
Another Hunk Of The Polar Vortex.
Although not quite as extreme as early January, the next week will get
your attention, with subzero readings commonplace into at least Thursday
of next week, as chunks of brittle, truly polar air break off and dive
southward. The GFS guidance above is valid Monday morning, courtesy of
Climate Reanalyzer.
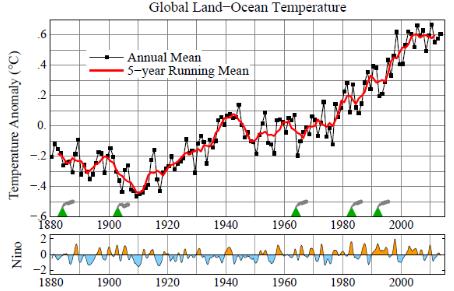
Global Temperature Update Through 2013. According to Dr. James Hansen (et all) at
Columbia University 2013 was the 7th warmest year, globally, on record: "
Global
surface temperature in 2013 was +.6C (1.1F) warmer than the 1951-1980
base period average, thus the seventh warmest year in the GISS (NASA)
analysis. The rate of global warming is slower in the past decade than
in the prior three decades. Slower growth of net climate forcings and
cooling in the tropical Pacific Ocean both contribute to the slower
warming rate, with the latter probably the more important effect..."
* the raw data from NASA GISS is
here.
NOAA Says World In 2013 Was 4th Hottest On Record. There is some disagreement between NASA (GISS) and NOAA; here's an excerpt from
phys.org: "
Last
year tied for the fourth hottest year on record around the globe. The
average world temperature was 58.12 degrees (14.52 C) tying with 2003
for the fourth warmest since 1880, the National Oceanic and Atmospheric
Administration said Tuesday. At the same time, NASA, which calculates
records in a different manner, ranked last year as the seventh warmest
on record, with an average temperature of 58.3 degrees (14.6 C). The
difference is related to how the two agencies calculate air temperatures
in the Arctic and other remote places and is based on differences that
are in the hundredths of a degree, scientists said..."
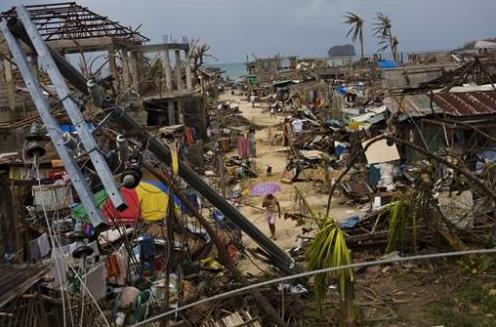
Photo credit above: "
In
this Nov. 14, 2013 file photo, Typhoon Haiyan survivors walk through
ruins in the village of Maraboth, in the Philippines. Last year was tied
for the fourth warmest year on record around the world. The National
Oceanic and Atmospheric Administration on Tuesday released its global
temperature figures for 2013. The average world temperature was 58.12
degrees (15.52 C) tying with 2003 for the fourth warmest since 1880." (AP Photo/David Guttenfelder).
* The Guardian's coverage of 2013 global temperature summaries is
here.
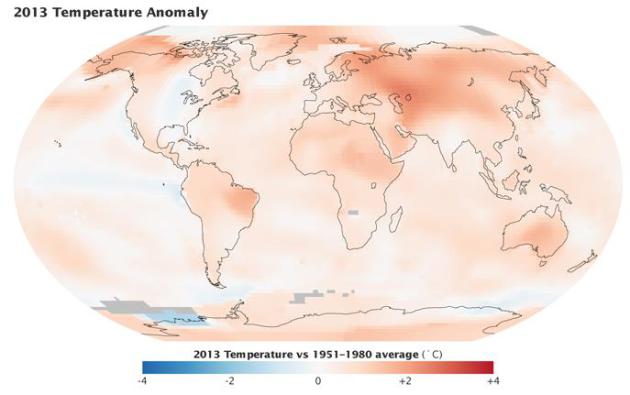
2013 Global Temperature Anomalies. I did a triple-take after seeing this image from
NASA's Earth Observatory;
a little pocket of cooler than average weather from central Canada into
the central USA; otherwise just about the entire planet was warmer than
the long-term, 1951-1980 averages. But perception becomes reality; if
you look out your window and it's cold outside, how can the atmosphere
possibly be warming up? NASA explains: "
The top map above depicts
global temperature anomalies in 2013. It does not show absolute
temperatures, but instead shows how much warmer or cooler the Earth was
compared to an averaged base period from 1951 to 1980. The GISS team
assembles its analysis with publicly available data from roughly 6,300
meteorological stations around the world; ship-based and satellite
observations of sea surface temperature; and Antarctic research station
measurements. For more explanation of how the analysis works, read World of Change: Global Temperatures"
Snowpocalypse Or Not, 2013 Was One Of The Warmest Years On Record. Time Magazine has an excellent overview of 2013, from a global perspective - here's an excerpt: "...
But
don’t worry—on a global climatic scale, the heat is still on. That’s
the takeaway from the National Oceanic and Atmospheric Administration’s
(NOAA) annual analysis of global climate data, which was released Tuesday. The red-hot numbers:
- 2013 ties with 2003 as the fourth-warmest year globally since records began in 1880.
- The
annual global combined land and ocean surface temperatures was 58.12
degrees Fahrenheit (14.52 degrees Celsius), 1.12 degrees Fahrenheit
above the 20th century average (the warmest year on record is 2010,
which was 1.19 degrees Fahrenheit (0.66 Celsius) above the average.
- 2013
was the 37th consecutive year that the annual global temperature was
above the average, which means that if you were born any year after
1976, you’ve never experienced a year when the global climate was
average, let along cooler.
- Including 2013, 9 of the 10
warmest years on record have occurred in the 21st century, and just one
year in the 20th century—1998—was warmer than 2013..."
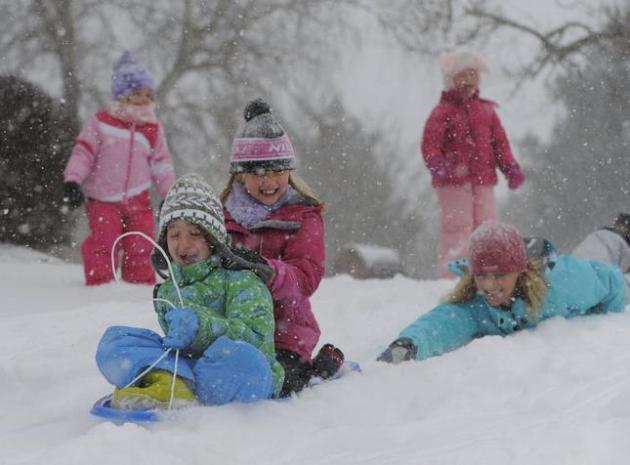
Photo credit above: "
Ella
Tamilio, 7, and Victoria Meeker, 8, get a push from Aimee Sharpe while
the kids were enjoying the snow in Jacksonville, Md., on Tuesday, Jan.
21, 2014." (Lloyd Fox/Baltimore Sun/MCT).
In
this Nov. 14, 2013 file photo, Typhoon Haiyan survivors walk through
ruins in the village of Maraboth, in the Philippines. Last year was tied
for the fourth warmest year on record around the world. The National
Oceanic and Atmospheric Administration on Tuesday released its global
temperature figures for 2013. The average world temperature was 58.12
degrees (14.52 Celsius) tying with 2003 for the fourth warmest since
1880.(AP Photo/David Guttenfelder)
Read more at:
http://phys.org/news/2014-01-noaa-world-4th-hottest.html#jCp
The
average world temperature was 58.12 degrees (14.52 Celsius) tying with
2003 for the fourth warmest since 1880, the National Oceanic and
Atmospheric Administration said Tuesday.
At the same time, NASA,
which calculates records in a different manner, ranked last year as the
seventh warmest on record, with an average temperature of 58.3 degrees
(14.6 Celsius). The difference is related to how the two agencies
calculate temperatures in the Arctic and other remote places and is
based on differences that are in the hundredths of a degree, scientists
said.
Read more at:
http://phys.org/news/2014-01-noaa-world-4th-hottest.html#jCp.
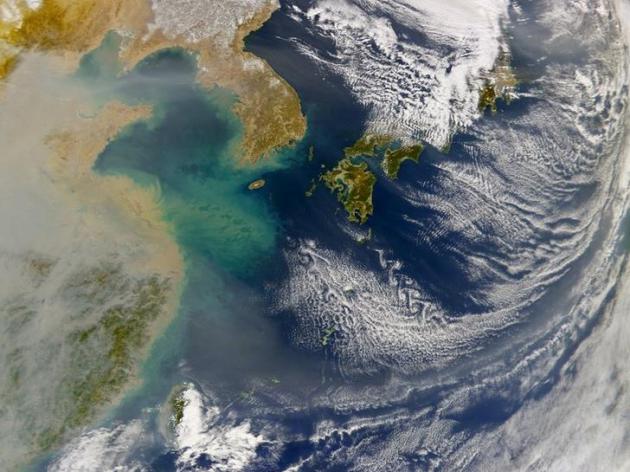
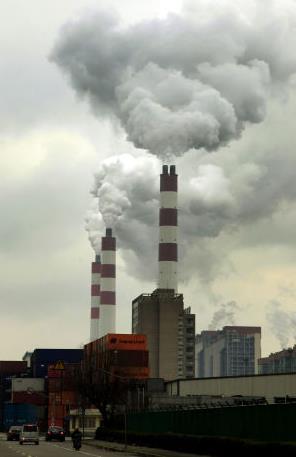
Turns out all the money we pay to China to produce cheap (crap) is
coming back to bite us, in the form of smog, which doesn't seem to want
to respect international borders.
Smithsonian.com has the report - here's a clip: "...
The
dynamics of cloud formation are quite complex, but the study's
conclusions were surprisingly straightforward. This air pollution, the
model showed, has powerful consequences for cyclone formation,
increasing overall precipitation over the Northwest Pacific by 7 percent
over what it would be otherwise. The particulate matter, the
researchers found, is also producing a regional greenhouse gas effect,
siginificantly contributing to climate change. These findings are,
naturally, pretty worrisome. But for U.S. readers, the results of the
study on the global spread of Chinese air pollution, published yesterday in the Proceedings of the National Academy of Sciences,
might be even more troubling, both because they show the effects of
Chinese pollution here in the U.S. and because they trace much of the
responsibility back to American consumers, who buy a large proportion of
the goods manufactured in China..."
Image credit above: "
Clouds of haze rise above China, largely the result of the country's massive manufacturing industry."
(Image via US NASA SeaWiFT project).
Researchers Find Connection Between Asia Pollution, Changes In Weather. The Eagle, serving Bryan- College Station, Texas, has the story - here's the introduction: "A
team of researchers has been using a supercomputer at Texas A&M
University for the past two years to find out if Asia's unchecked
pollution problems are affecting your weekend weather forecast.
While the details remain hazy, initial findings published this month in
Nature Communications show that three decades of industrial exhaust
billowing into the atmosphere is changing the way clouds and storms form
over the northwest Pacific Ocean. "Asian pollution affects cloud
formations, precipitation, and storm intensity over the north Pacific
and eventually impacts regional and global climate," Caltech
post-doctoral scholar Yuan Wang wrote in an email..."
Photo credit above: "In
this March 3, 2009 file photo, factory chimneys pour out smoke in
Shanghai, China. Despite a global economic slump, worldwide carbon
dioxide pollution jumped 2 percent last year, most of it from China, new
figures show." AP Photo.
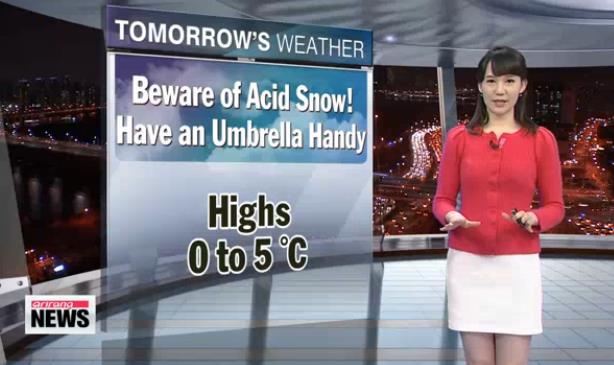
Feeling Better About Our Snow.
Skiers heading out in South Korea should be on the look-out for "acid
snow", the result of otherwordly amounts of pollution/smog swirling in
from China. So with acid snow there's no need to wax your skis - they
just slowly melt before your eyes? Good grief. Here's a video clip and
excerpt from
Arirang News: "
Let's
go over to our Kim Bo-gyung at the weather center for a checkup.
Bo-gyung, it has been a dark day here in Seoul, with snow falling from
time to time. That's right, Ji-hae. Please be sure to have an umbrella
with you, as the snow that's falling in the central regions right now is
acid snow, which is a mixture of snow and yellow dust..."
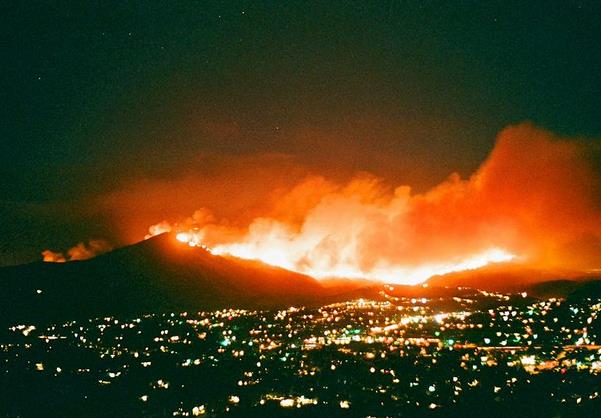
Wildfires: San Diego's Ecological Elephant In The Room. This story caught my eye, at
The San Diego Free Press. I hadn't realized how close San Diego came to a potentially devastating conflagration in 2007. Here's an excerpt: "...
But
I’m not sure most San Diegans realize the extent to which we dodged a
bullet in 2007. If the wind direction at a key moment in that firestorm
had not suddenly switched from the westerly course it was locked on, to
a southerly path (and then later to its more normal easterly flow), San
Diego might today be the west coast icon for “greatest urban disasters
in U.S. history.” A huge swath of our urban region could have burned to
the ground. Hundreds of thousands of buildings might have been
destroyed, and tens of thousands left homeless. Untold numbers might
have lost their lives. We’ve forgotten those details from October 2007:
two raging mega-fires, poised like pincers heading from two directions
toward the very heart of our city..." (Image: Wikipedia).
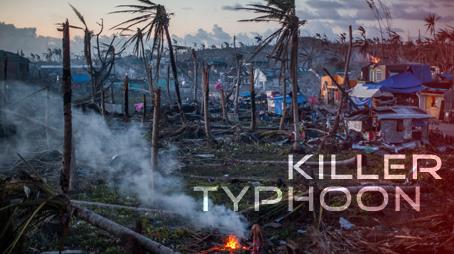
Typhoon Haiyan Documentary.
PBS ran an amazing special on Super Typhoon Haiyan last night, what may
have been the strongest typhoon/hurricane ever observed, leaving behind
at least 8,000 deaths, and an estimated 4 million homeless survivors in
the Philippines. TPT2 may run it again, or make this available at some
point online. More details from
PBS.
The Cult Of Overwork.
It turns out working too much may not only be bad for your health, it
may also be bad for your employer; here's an excerpt of a fascinating
story at
The New Yorker: "...“
Today,
technology means that we’re all available 24/7. And, because everyone
demands instant gratification and instant connectivity, there are no
boundaries, no breaks.”Cry me a river, you might say. But what happened
on Wall Street is just an extreme version of what’s happened to
so-called knowledge workers in general. Thirty years ago, the best-paid
workers in the U.S. were much less likely to work long days than
low-paid workers were. By 2006, the best paid were twice as likely to
work long hours as the poorly paid, and the trend seems to be
accelerating..."
For The Love Of Money. Just in case you missed this eye-opening story at
The New York Times; here's a clip: "
IN
my last year on Wall Street my bonus was $3.6 million — and I was angry
because it wasn’t big enough. I was 30 years old, had no children to
raise, no debts to pay, no philanthropic goal in mind. I wanted more
money for exactly the same reason an alcoholic needs another drink: I
was addicted. Eight years earlier, I’d walked onto the trading floor at
Credit Suisse First Boston to begin my summer internship. I already knew
I wanted to be rich, but when I started out I had a different idea
about what wealth meant..."
Graphic credit: Owen Freeman.
Richest 85 Boast Same Wealth As Half The World. Income inequality? What income inequality? It's just a rounding error. Here's an excerpt from
The Sydney Morning Herald: "
Eighty-five
people control the same amount of wealth as half the world's
population. That is 85 people compared with 3.5 billion. A new report from Oxfam
has been published in time for the World Economic Forum in Davos this
week. It shows the world's ultra-wealthy have not only recovered from
the global financial crisis, they have positively blossomed..."
Super Bowl Ad Insanity Explained In 6 Charts.
Bloomberg Businessweek sets us all straight and provides some unique perspective on advertising-insanity; here's the introduction: "
Are you ready for the $5 million Super Bowl ad? Or the $10 million one? Multiple sources are estimating a
$4 million price tag for the average 30-second commercial at this
year’s Super Bowl. That’s a pretty mind-bending number, but it probably
won’t be in 2040, given the exponential growth in ad rates for the big
game. Back in the 1980s, marketing mavens found it shocking when the $500,000 mark for Super Bowl spots was crossed. Today, that would get you only three seconds of airtime..."
Image credit above: "A 2013 Super Bowl advertisement for PepsiCo's Frito-Lay's Doritos." Photograph by PepsiCo via AP Photo.
Sugar Batteries Could Be Greener, Cheaper, And Store More Energy Than Lithium-Ions.
Gizmag
has the curious story - here's an excerpt: "Even today's best
rechargeable lithium batteries do lose their ability to hold a charge
after a while, and are considered toxic waste once discarded. In just a
few years, however, they may be replaced by batteries that are
refillable and biodegradable, and that will also have a higher energy
density yet a lower price ... and they'll run on sugar. "Sugar is a
perfect energy storage compound in nature," says Virginia Tech's Prof.
Y.H. Percival Zhang, who is leading the research. "So it's only logical
that we try to harness this natural power in an environmentally friendly
way to produce a battery..."
Photo credit: Shutterstock.
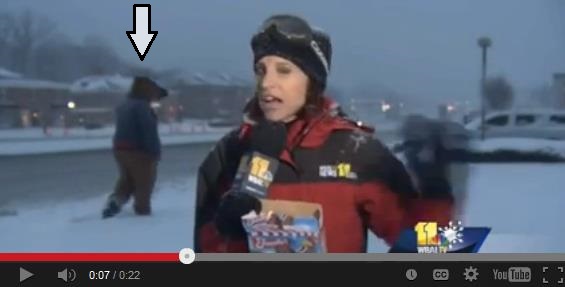
Baltimore Reporter's Live Shot Sees Possible Reappearance Of "Horsehead" Video Bomber. Just when you thought you've seen everything, along comes this laugh-worthy nugget from
TV Spy: "Last year during the coverage of Hurricane Sandy, a reporter for NBC owned station
WRC featured a live shot with
a shirtless man wearing a horse head
jogging down a street in Washington, D.C. Today, the conspiracy
theorist interwebs are abuzz with the second sighting of a horse head
wearing person spotted during another weather event. This time it
happened on Baltimore NBC affiliate
WBAL in Ellicott City, MD, behind reporter
Kate Amara. Coincidence?..."
60 above: Floridians turn on the heat. Minnesotans plant gardens.
50 above: Californians shiver uncontrollably. People are sunbathing in Duluth.
40 above: Imported cars won't start. Minnesotans drive with the sunroof open.
32 above: Distilled water freezes. The water in Bemidji gets thicker.
20 above: New Mexicans don long johns, parkas, wool hats & mittens. Minnesotans throw on a flannel shirt.
15 above: New York landlords finally turn on the heat. People in MInnesota have one last cookout before it gets cold.
Zero: People in Miami evacuate the city - National Guard called out. Minnesotans close the windows.
10 below: Californians fly away to Mexico. Minnesotans dig their winter coats out of storage.
25 below: Hollywood implodes. Girl Scouts in Minnesota still selling cookies door to door.
40 below: Washington D.C. finally runs out of hot air. People in Minnesota let their dogs sleep inside.
100 below: Santa Claus abandons the North Pole. Minnesotans get upset because their minivans won't start.
460 below: All molecular motion stops (Absolute Zero on the Kelvin scale). People in Minnesota shout "cold 'nuff fer ya?"
500 below: Hell freezes over. Minnesota Public Schools open 2 hours late.
"
To
see things thousands of miles away, things hidden behind walls and
within rooms, things dangerous to come to, that is the purpose of life." - The Secret Life of Walter Mitty.
First Sign of Spring?
On KARE-11 yesterday I couldn't help but notice the first commercial
focused on spring planting season. Herbicides, pesticides, seed ads on
the tube? This is a good sign eh?
"
Humanity is going to require a substantially new way of thinking if it is to survive." - Albert Einstein
Climate Stories...
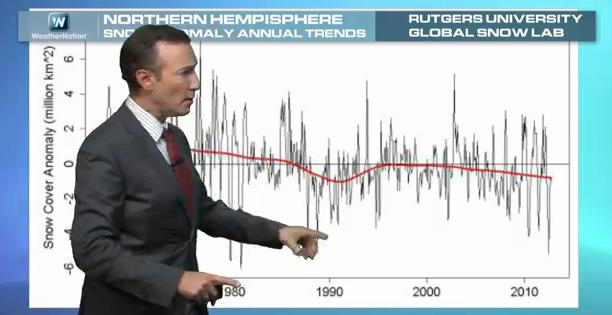
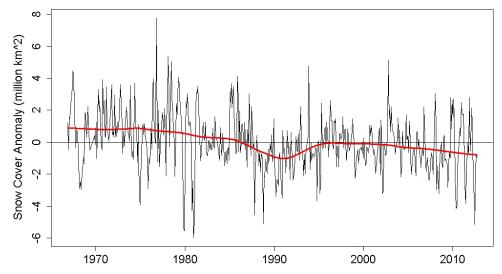
Snow Trends In The Northern Hemisphere.
With the Son of Snowpocalypse story in the news, SNOW! blanketing many
large northeastern cities, I thought this was a timely jolt of
perspective. Although we're seeing more intense snowfalls from time to
time (a function of more water vapor in the air?) the overall trend for
snowcover on the ground is downward over the entire Northern Hemisphere,
looking at
year-round data, mainly because of the rapid warming of the Arctic is melting more snow during the summer months: Here's a clip from
Tamino: "...
The Rutgers Univ. Global Snow Lab
has data on snow cover during the satellite era. Like most
climate-related variables, snow cover shows a strong seasonal cycle,
with more snow in winter and less in summer. When looking for trends,
it’s useful to compute anomaly, the difference between a given month’s
value and the average for the same month throughout the data record.
Here’s the anomaly data for northern hemisphere snow cover. There is a
clear, and statistically significant, overall decline in snow cover. In
spite of what we often hear from the fake skeptics — who love to bellow
about any big snowfall (even when it hasn’t happened yet) as though it were disproof of global warming — the actual trend in snow cover is one of decline..."
Winter Snowfall Trends For North America.
With a few notable (polar) exceptions, winters are trending milder,
meaning more water vapor to support snowfall. Rutger's Global Snow Lab
shows an increase in snowfall amounts for North America during the
winter months since 1967.
Decreasing Spring Snowfall Amounts.
Although winters are becoming snowier with time across North America,
snow is melting faster during the spring months, based on data from the
Rutgers Global Snow Lab.
The Australian Open, ESPN, And Selective Climate Change Coverage. Media Matters has the story; here's a clip: "
ESPN
announcers recently used a cold spell to mock global warming in their
live commentary, mainstreaming the conservative myth that cold weather
disproves global warming. But during coverage of the Australian Open,
which saw dangerous, record-breaking heat, commentators remained silent
on the issue -- a trend more akin to
Fox News. During an Arctic chill on January 7, ESPN commentators Jimmy
Dykes and Brad Nessler interjected their sports coverage with climate denial.
Dykes mentioned that he had watched a national television debate over
"whether or not global warming was still taking place," saying he
"listened to about 30 seconds of it, but the guy saying no it has not, I
think he won the debate..."
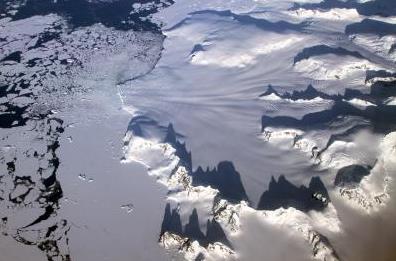
A Resolution Of The Antarctic Sea Ice Paradox. Arctic ice is shrinking during the summer, what what's happening in Antarctica? Here's an excerpt from an article at
reportingclimatescience.com: "
The
gradual warming of the North and tropical Atlantic Ocean is
contributing to climate change in Antarctica, a team of New York
University scientists has concluded. The findings, which rely on more
than three decades of atmospheric data and appear in the journal Nature,
show new ways in which distant regional conditions are contributing to
Antarctic climate change. "Our findings reveal a previously unknown—and
surprising—force behind climate change that is occurring deep in our
southern hemisphere: the Atlantic Ocean," says Xichen Li, a doctoral
student in NYU's Courant Institute of Mathematical Sciences and the
study's lead author. "Moreover, the study offers further confirmation
that warming in one region can have far-reaching effects in another..."
Photo credit above: "
The
gradual warming of the North and Tropical Atlantic Ocean is
contributing to climate change in Antarctica, a team of NYU scientists
has concluded. The findings, which rely on more than three decades of
atmospheric data, show new ways in which distant regional conditions are
contributing to Antarctic climate change. Below, several glaciers in
the Antarctic Peninsula pass between sharp mountain peaks and converge
in a single calving front, as seen by Operation IceBridge while
returning from a survey of the Ronne Ice Shelf on Nov. 1, 2012. NASA's
Operation IceBridge is an airborne science mission to study Earth's
polar ice. For more information about IceBridge, visit:
www.nasa.gov/icebridge." Courtesy: Jefferson Beck/NASA IceBridge, National Science Foundation.