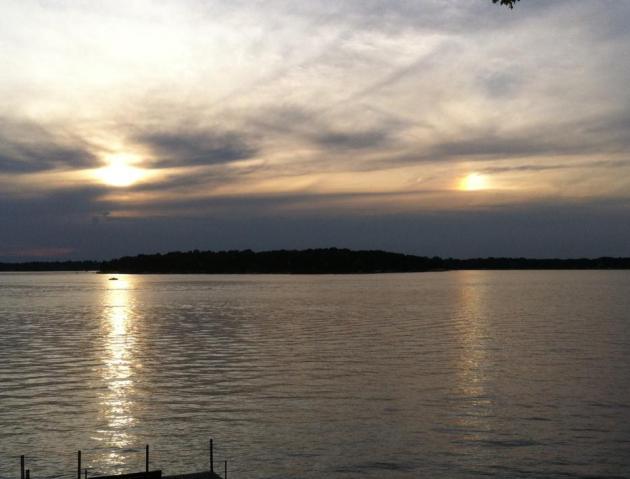
Sensible Seasons
"The world of sensible seasons had come undone" wrote Barbara Kingsolver in "
Flight Behavior", a fictional account of climate change's impact on one family in Tennessee. It's an excellent read, by the way.
No, not every weather quirk is a symptom of
warming, but if you listen carefully Minnesota's weather tune is playing
vaguely off-key.
Near 60F on Monday with a thundershower - on
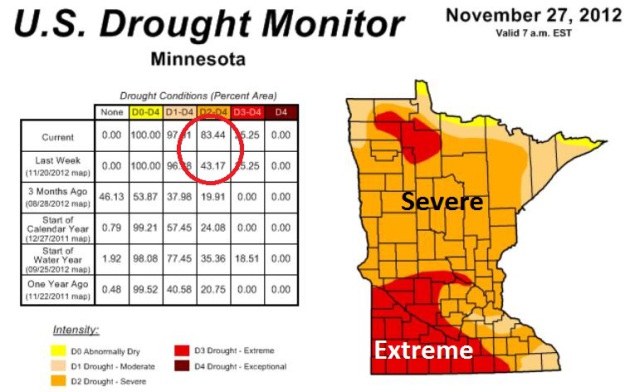
December 3? 83 percent of Minnesota is in severe drought, up from 43
percent a week ago.
Not a farmer? If you like water in your lakes and affordable food on your table you'll want to stay up on the drought.
Meanwhile northern California may pick up 15
inch rains, with 100 inch snows in the mountains.
While we see just
enough rain to settle the dust on Monday. 40s feel like a relief this
weekend; hints of April Monday before cooling off by midweek. Jackets
and coats return next weekend, but another thaw may be brewing for
mid-December. I fear we'll go right down to the wire with a white
Christmas again this year.
Dry bias and El Nino?
El Schmeeno!
At some point the law of averages will catch up
with us and it will "snow". Minnesotans will slip and slide to work.
Snowmobiles will roar to life. Skiers will smile, kids will celebrate.
Any day now.
* image above from
funcram.com. Here's a snippet from Dr. Mark Seeley's always-informative
WeatherTalk Newsletter: "
Most
observers reported average monthly temperatures for November that
ranged from 2 to 4 degrees F warmer than normal, with the larger
positive departures in temperatures coming in southern counties.
Extremes for the month ranged from -11 degrees F at Fosston (Polk
County) on the 26th to 75 degrees F on the 10th at Rochester, Amboy, and
Winnebago. The warm day on the 10th also brought extremely rare
November tornadoes to the state. These storms were reported from
Burnsville, Eagan, Mendota Heights and Mahtomedi, and were the 2nd
latest autumn tornadoes in Minnesota history (there was a tornado near
Maple Plain back on November 16, 1931)."
Severe Drought Expands.
I can't remember the last time I saw this: the aerial extent of severe
drought jumping from 43% to 83% of Minnesota in one week. The worst
conditions: St. Cloud and Willmar to Mankato and all of southwest
Minnesota, more pockets of extreme drought near Bemidji. The entire
metro area is now in severe drought. Map courtesy of the
U.S. Drought Monitor.
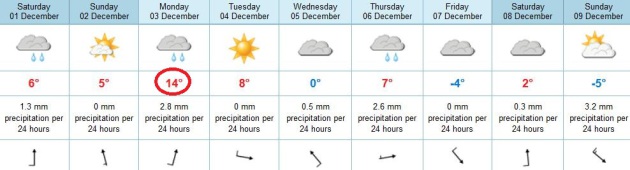
Temperature Roller Coaster.
I expect 40s today and Sunday; a slight chance of a shower (or drizzle)
today, a better chance of a few light showers Monday. If the cold front
holds off until after 2 pm Monday a high of 60 F. isn't out of the
question Monday, but mid to upper 50s are likely, about 20 degrees above
average. We cool off by Wednesday - temperatures blip upward again
Thursday before chilling back down to near average next Saturday.
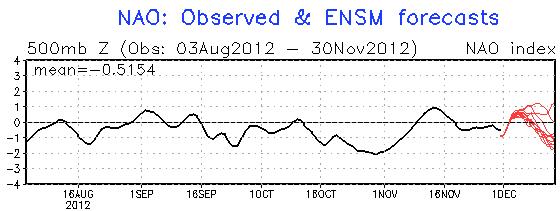
Negative Trend For NAO?
The NAO (North Atlantic Oscillation) Index is a tip-off of weather to
come, 1-2 weeks out. Strongly positive NAO's often correlate with quiet
weather, strongly negative phases of NAO correspond to more dips and
bulges in the jet stream, a greater potential for storms. We're in a
drought, but maybe we'll be brushed by a few storms come mid-December.
We're due. Graph above: NOAA.
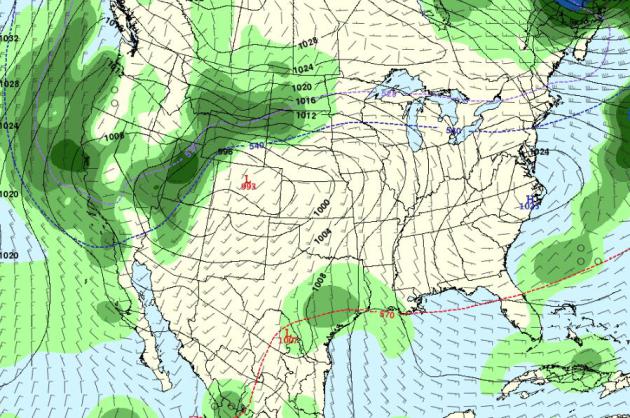
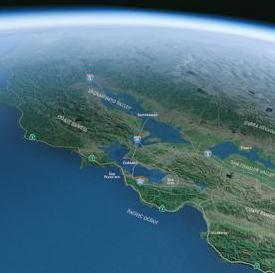
2 Week Extended Outlook.
The GFS forecast map above is valid December 16, showing the "540
line", the approximate location of the rain-snow line, pushing into
southern Minnesota, another major storm thrashing the west coast. Highs
reach the 20s and 30s from December 9 into December 16, fairly close to
average for December. No frigid air is in sight - no major storms are
brewing either, looking out 2 weeks or so. I keep waiting for a break in
the pattern - don't see it yet.
Friday Night Satellite. The first
frontal boundary is clearly visible from Las Vegas to Boise, with
partial clearing over the west coast. Mainly dry conditions should hold
much of the day Saturday, but already the next (severe) frontal boundary
is showing up in the Pacific, scheduled to arrive on Sunday.
Meteorologists call this “The Pineapple Express”, a treadmill of
unusually wet systems lined up all the way from Hawaii to the West Coast
of the USA. Satellite: Naval Research Lab.
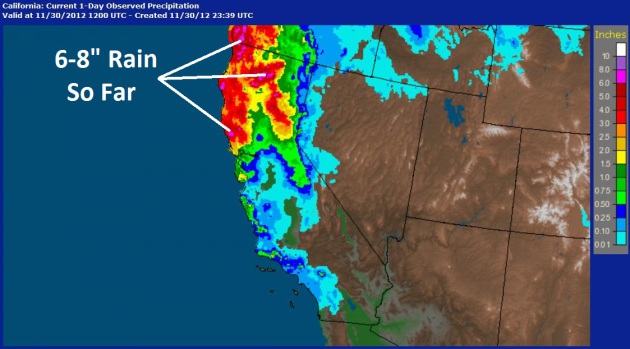
1-2 Months’ Worth of Rain Has Already Fallen.
The map above shows Doppler-estimated rainfall amounts from Thursday
and Friday; a huge area has already picked up more than 2” of rain, with
pockets of 6-10” of rain from Mendocino north to Medford, Oregon.
Widespread flooding and mudslides have been reported over northern
California. The ground is saturated – Sunday’s rain will trigger more
extreme flooding and additional road closures and overflowing rivers. El Nino may be priming the pump, increasing the potential for excessive rainfall and snowfall amounts.
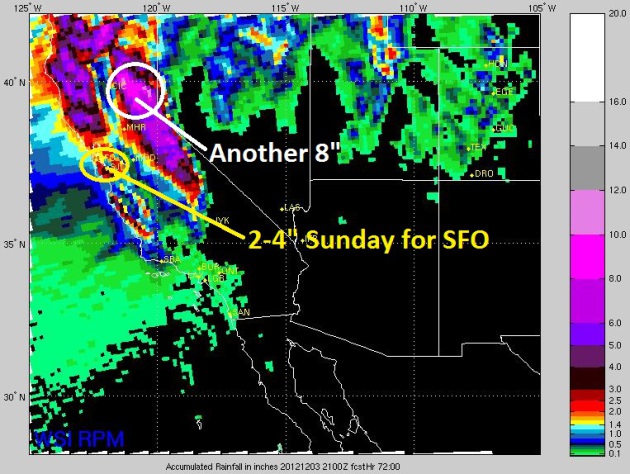
Additional Predicted Rain. The
high-resolution model above shows additional rain expected by Monday
evening – most of it falling Sunday and Sunday night as the next front
sweeps from northwest to southeast across the region. Another 6-8” of
rain (and heavy mountain snow) is likely over higher terrain east of
Redding and Chico, with some 2-4” rainfall amounts for the coastal range
near San Francisco and Oakland. Los Angeles will see minimal amounts,
under .5” of rain expected. Then again, it doesn’t take much rain to
turn L.A. freeways into one vast parking lot. Map: WSI.
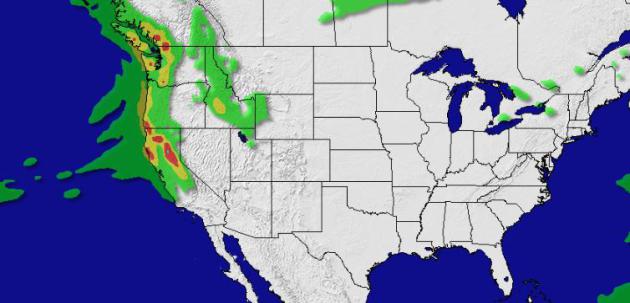
Alerts Broadcaster Models. Our
weather simulations show a broad area receiving at least 3” of
additional rain Sunday, with upwards of 10” amounts for the Coastal
Range and as much as 10-15” for the northern Sierra Nevada range of
northern California. This may translate into an additional 50-100” of
snow with a significant avalanche risk north of Lake Tahoe.
Megastorms Could Drown Massive Portions Of California.
"Atmospheric Rivers"? We're seeing new phenomena on our weather maps,
things that can't be explained away as "normal weather". Here's an
excerpt of a timely article at
Scientific American: "
Geologic
evidence shows that truly massive floods, caused by rainfall alone,
have occurred in California about every 200 years. The most recent was
in 1861, and it bankrupted the state. Such floods were most likely
caused by atmospheric rivers: narrow bands of water vapor about a mile
above the ocean that extend for thousands of miles. Much smaller forms
of these rivers regularly hit California, as well as the western coasts
of other countries. Scientists who created a simulated megastorm,
called ARkStorm, that was patterned after the 1861 flood but was less
severe, found that such a torrent could force more than a million
people to evacuate and cause $400 billion in losses if it happened in
California today...."
Graphic credit above: "
A 43-day
atmospheric-river storm in 1861 turned California’s Central Valley
region into an inland sea, simulated here on a current-day map." Image: Don Foley
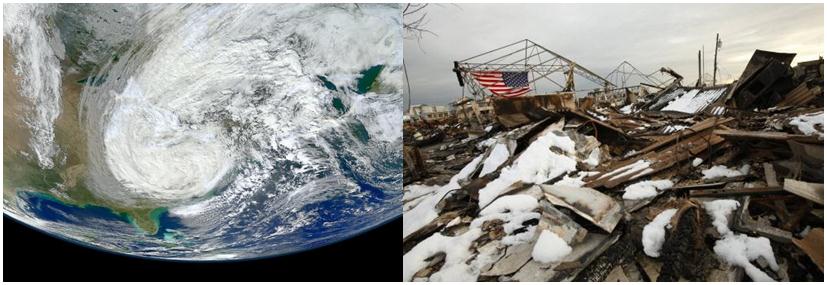
19 named tropical storms and hurricanes in 2012 in the Atlantic basin, 3rd most since 1851. Details from AP and The Washington Post.
Rebuilding Cities After Sandy: Three Keys To Climate Resilience. Here's an excerpt of a story from
Huffington Post:
1) Build Green as Well as Gray
"As we saw from Hurricane Sandy and other destructive, recent
storms, cities from New York to Miami to Houston need to develop
infrastructure that reduces the vulnerability of homes, commerce, and
services.
This does not mean walling-in every coastal community with huge barriers or dikes. Where cities meet shorelines, "green infrastructure" can often meet the same need. For example, Maryland's state government is buying up wetlands and marshes to provide buffers against future storm surge. And in New Jersey, the restoration of South Cape May Meadows provided a natural seafront barrier that helped the area fare much better than others when Sandy hit..."
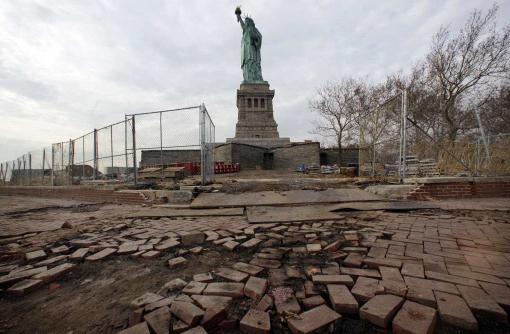
Photo credit: "
Parts of the brick walkway of Liberty
Island that were damaged in Superstorm Sandy were shown during a tour,
in New York, Friday, Nov. 30, 2012. Tourists in New York will miss out
for a while on one of the hallmarks of a visit to New York, seeing the
Statue of Liberty up close. Though the statue itself survived
Superstorm Sandy intact, damage to buildings and Liberty Island's power
and heating systems means the island will remain closed for now, and
authorities don't have an estimate on when it will reopen." (AP Photo/Richard Drew)
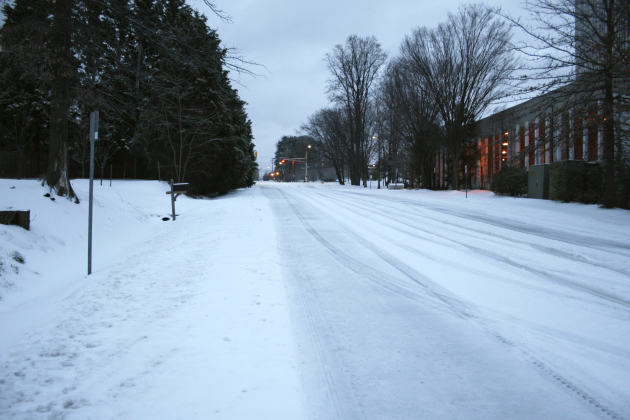
Minnesota Weather History for November 30. Information courtesy of the Twin Cities NWS:
1998: The warmest December day ever in the Twin Cities with 68 degrees. St. Cloud rose to 61.
1985: Parts of central Minnesota
received up to a foot of snow. Snowfall totals included 12 inches at
Waseca and Milaca, 11.3 at Alexandria, and 11 inches at Fairmont and
Long Prairie. Photo above: NOAA.
Climate Stories...
2012: 9th Warmest Year On Record, Worldwide. Here in the USA this year will probably wind up being the warmest year ever recorded. Details from
The New York Times.
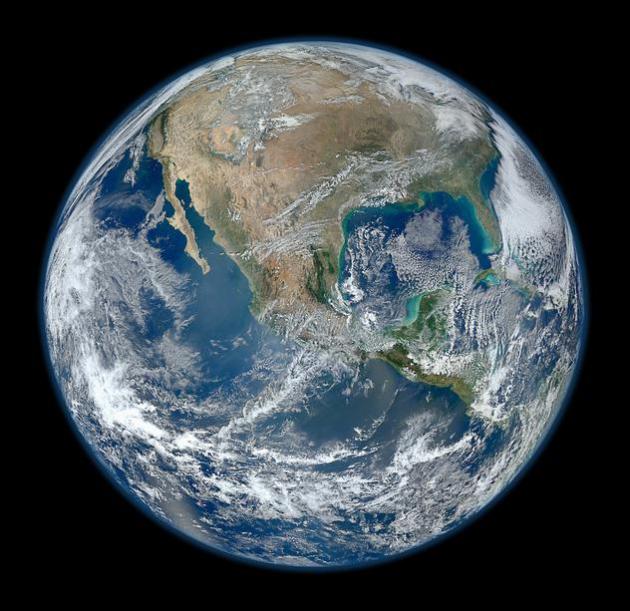
16 Irrefutable Signs That Climate Change Is Real. Here's an excerpt from
Business Insider: "
A new study published Thursday in the journal Science provides the most definitive — and accurate — evidence yet that polar ice caps on Greenland and Antarctica are melting. Shrinking ice is not the only telltale sign that climate change is real. From rising air and ocean temperatures to stronger storms to record droughts, evidence of a changing global climate is all around us..."
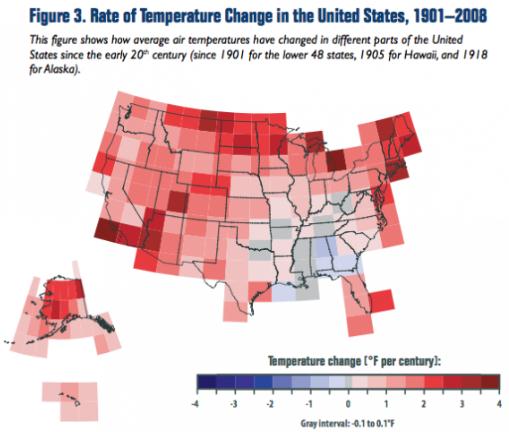
Graphic credit above: NOAA (2009). "Since
1901, global average surface temperatures have risen at an average rate
of .13 degrees Fahrenheit per decade. The United States has warmed at
nearly twice the global rate since the 1970s."
Climate Change Science Gets More Compelling As Politicians Fiddle. What's happening in the Arctic and Greenland is truly alarming. Here's a clip from a must-read Op-Ed at
The Washington Post: "...
In
the early online edition of the Proceedings of the National Academy of
Sciences on Thursday, scientists from the Lawrence Livermore National
Laboratory and elsewhere further solidified the link between human activity and rising global temperatures.
The researchers compared the findings of complex climate models
against three decades of direct satellite observations. In response to
human-related emissions, the models show a particular pattern of
temperature change — cooling in the upper atmosphere, warming in the
lower atmosphere. That pattern, the scientists found, is also present in
the satellite record. Using similar methods, they also found that
natural climate variability is extremely unlikely to explain the modeled
and observed results. What about the effects of this warming? In the
journal Science on Thursday, an international group of 47 glaciologists
concluded that the world's massive ice sheets are currently losing 344 billion tons of ice a year, three times the rate of two decades ago. Greenland's ice sheet is worst off — shrinking at five times the 1990s rate, it accounts for most of the ice loss.
Together, melting ice sheets account for about 20 percent of current
sea-level rise, the glaciologists found. "Some ice sheets," a summary of
the study warns, "are disconcertingly sensitive to warming."...
Graphic credit above: "
These undated handout images
provided by NASA shows the extent of surface melt over Greenland's ice
sheet on July 8, left, and July 12, right. Measurements from three
satellites showed that on July 8, about 40 percent of the ice sheet had
undergone thawing at or near the surface. In just a few days, the
melting had dramatically accelerated and an estimated 97 percent of the
ice sheet surface had thawed by July 12." (AP Photo/Nicolo E. DiGirolamo, SSAI/NASA GSFC, and Jesse Allen, NASA Earth Observatory).
Faith In Values: Are We Finally Nearing The Tipping Point On Climate Change? Here's an excerpt of a thought-provoking article at
The Center for American Progress: "...
In
terms of moral leadership, faith communities have long seen global
warming as one of the most urgent spiritual issues of our time. From
Catholics and Jews to Muslims, evangelicals, and others, faith
communities have been working to change individual behavior and to
advocate for sensible policies to address climate change. The Evangelical Environmental Network,
for instance, ran television ads in swing states during the election
campaign defending the Environmental Protection Agency’s ability to
reduce carbon pollution. Interfaith Moral Action on Climate graded elected officials on their stewardship record and is urging responsible climate leadership. And the Young Evangelicals for Climate Action worked to make the environment a key voting issue among its followers through social media and direct organizing...."
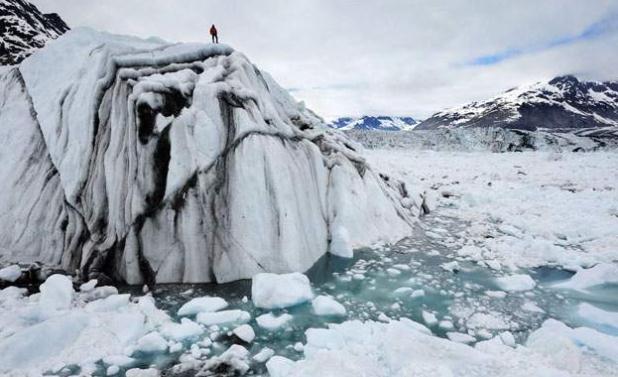
Photo credit above: AP/James Balog. "
A hiker surveys the
damage from climate change atop an iceberg in Alaska. Correcting
climate change used to be a bipartisan effort, but recently has become
more partisan, causing faith groups to get involved."