"
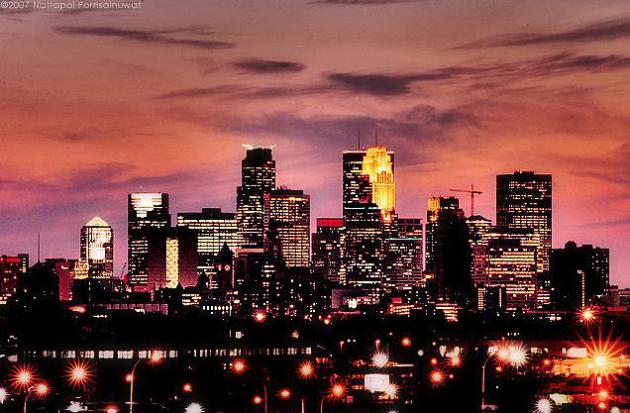
The Twin Cities went from having an average of 13 cool summer
days to 9, from 7 dangerously hot days to more than 11, and from 2 heat
waves to 3 each summer." - excerpt of a new, UCS (Union of
Concerned Scientists) paper focused on the frequency and intensit of
heat waves across the Midwest. Details below.
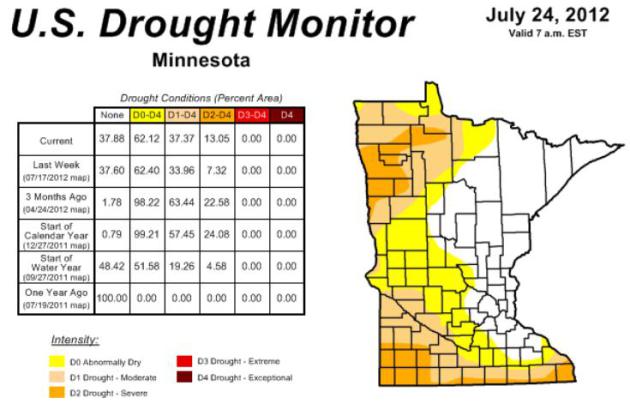
37.37% of Minnesota is in a moderate drought, up from 33.96% of the state on July 17.
13.05% of the state is in a severe drought, up from 7.32% of Minnesota a week ago.
 Dual Polarization
.
The local Twin Cities NWS is upgrading to "dual pol" on August 20; the
radar may be down for as long as 2 weeks during the upgrade. Details
below.
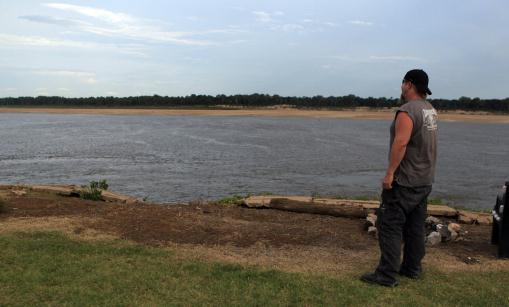
13 feet. The Mississippi River at Memphis is 13 feet
below normal, expected to drop another 2 1/2 feet by late August. Water
levels are down 55 feet from last spring's high water mark during the
spring floods of 2011. Details from theleafchronicle.com below. (AP
Photo/Nikki Boertman)
"
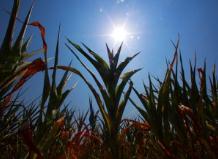
The price of corn has risen by 50 percent, to $8 a bushel, from where it was last month. And a U.S. Department of Agriculture report released today
suggests that consumers can expect to see the price of meat and dairy
products rise as feed for livestock becomes more expensive." - from a Live Science report below. Photo: madison.com.
“
We’ve got the ‘storm of the century’ every year now,” said Bill
Gausman, a senior vice president and a 38-year veteran at the Potomac
Electric Power Company, which took eight days to recover from the June
29 “derecho” storm
that raced from the Midwest to the Eastern Seaboard and knocked out
power for 4.3 million people in 10 states and the District of Columbia."
- from a New York Times story on the impact of extreme weather on
America's energy & transportation grid; details below. Photo: NASA.
"
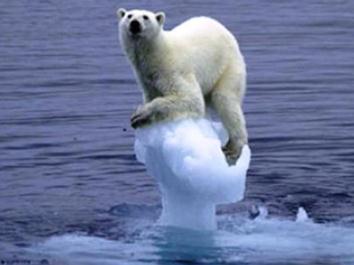
We could only attribute as much as 30% [of the Arctic ice loss]
to the AMO," he said. "Which implies that the rest is due to something
else, and this is most likely going to be man-made global change." - from a story at The Guardian below.
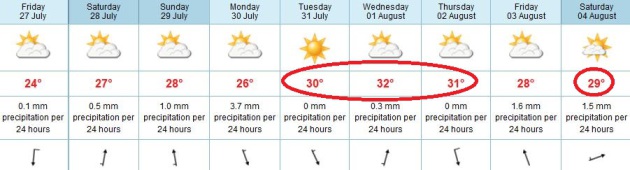 One More Wave Of Heat.
The last spell of 90s? At the rate we're going I wouldn't be on that,
but I suspect 3-4 more days at or above 90 F. next week. Highs should
top 90 as early as Sunday; 90s likely the middle of next week. Model
data: ECMWF.
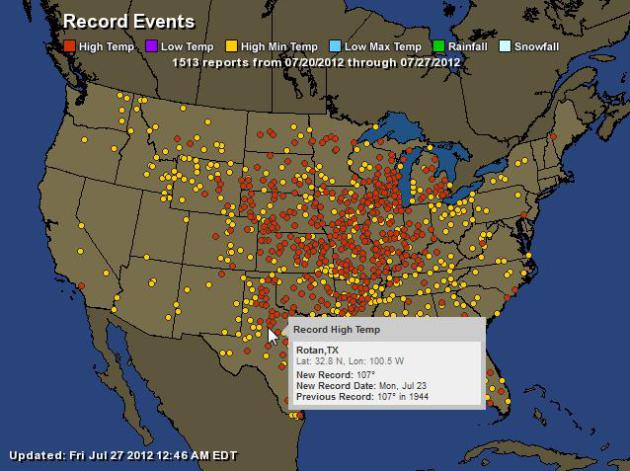 Anatomy Of A Heatwave
. 1,513 hot weather records (daytime highs and warm nighttime lows) in just the last week. Interactive map courtesy of
Ham Weather.
Drought Worsens Over Minnesota. The rough rule of
thumb during the summer months is 1" of water every week - anything less
and topsoil begins to dry out rapidly, especially when the pattern is
sunny and hot. Although the immediate Twin Cities metro area (and much
of central and northeastern Minnesota) is in pretty good shape from a
soil moisture standpoint, drought conditions are worsening over far
southern and northwestern counties. Last week 33.96% of Minnesota was in
a moderate drought - that has risen to 37.37%. 13% of the state is in a
severe drought, up from 7% last week. Details from the Drought Monitor
here.
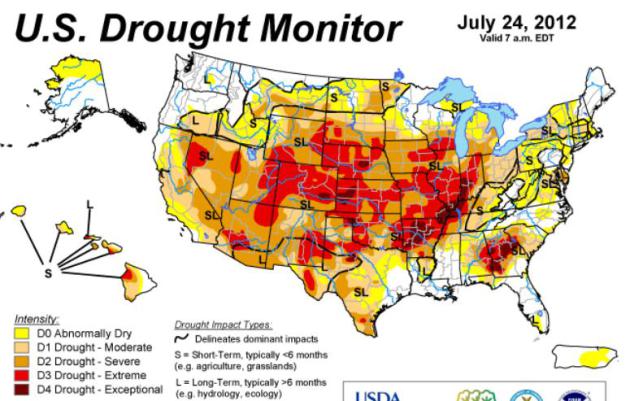
Drought Map Shows Widespread Intensification Over Central United States. Here's an update on the the growing drought from the
U.S. Drought Monitor: "
The
July 24 U.S. Drought Monitor showed widespread intensification of
drought through the middle of the country, according to the National
Drought Mitigation Center at the University of Nebraska-Lincoln. The map
also set a record for the fourth straight week for the area in
moderate drought or worse in the 12-year history of the U.S. Drought
Monitor. The July 24 map put 53.44 percent of the United States and
Puerto Rico in moderate drought or worse, up from 53.17 percent the
week before; 38.11 percent in severe drought or worse, compared with
35.32 a week earlier; 17.2 percent in extreme drought or worse,
compared with 11.32 percent the week before; and 1.99 percent in
exceptional drought, up from .83 percent the preceding week. “We’ve
seen tremendous intensification of drought through Illinois, Iowa,
Missouri, Indiana, Arkansas, Kansa and Nebraska, and into part of
Wyoming and South Dakota in the last week,” said Brian Fuchs, a
climatologist and U.S. Drought Monitor author. “The amount of D3
developing in the country has increased quite a bit for each of the
last several weeks.” Fuchs also noted that as of the July 24 U.S.
Drought Monitor, every state in the country had at least a small area
shown as abnormally dry or worse. “It’s such a broad footprint,” he
said."
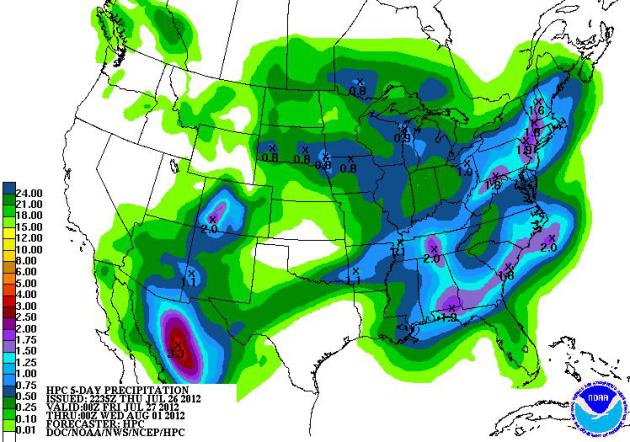 Drought Deepens Over Plains
.
Showers and T-storms will drop welcome rain; some 1-2" amounts from
Boston and New York southward to Mobile. But little rain is forecast for
the next 5 days over the Central Plains, where the drought will worsen.
Map: NOAA HPC.
Food Prices Could Rise 5 Percent In Next 5 Months. Details from
ABC News; here's an excerpt: "
The
cost of filling grocery carts in America is going up. The U.S.
Department of Agriculture announced today that it is projecting as much
as a 5 percent price hike for some food items over the next nine
months. “Of course I’m concerned,” said shopper Barbara Webb. “I’m
concerned for the people who can’t afford it.” Behind the expensive jump
is the drought, now covering 60 percent of the United States, pushing
up prices for feed that translate into higher prices for beef, pork and
chicken products."
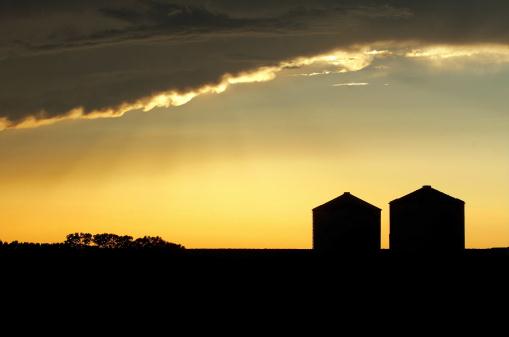
Ongoing Drought Hits Crops Hard.
Live Science has the story - here's the introduction: "
The
drought affecting much of the continental United States — not to
mention the heat and dryness around the globe — has sent corn and wheat
prices skyrocketing, scientists said today (July 25). And the current
weather could be a taste of what to expect in future decades. "Global
warming helps make droughts hotter and drier
than they would be without human influence," said Heidi Cullen, the
chief climatologist for Climate Central, a non-profit organization
dedicated to communicating the science of climate change."
Photo credit above: "
Grain bins are silhouetted against
approaching storm clouds that unfortunately contain very little water
Thursday, July 26, 2012 in Pleasant Plains, Ill. The widest drought to
grip the United States in decades is getting worse with no signs of
abating. This week's U.S. Drought Monitor report highlights that the
drought's severity is rapidly expanding across the nation." (AP Photo/Seth Perlman)
Mississippi River Level Dropping. What a difference a
year makes, a 55 FOOT drop on the Mississippi River at Memphis from the
high-water marks of last spring's flood? Unbelievable. Details from
theleafchronicle.com; here's an excerpt: "
The
Mississippi River’s water level keeps dropping, and the U.S. Army
Corps of Engineers in Memphis said Wednesday it is using survey boats
and dredges to maintain safe navigation. Meanwhile, river barge and tow
boat operators are continuing to lose money as they reduce the amount
of material they can safely carry on the river.The National Weather
Service said Wednesday that drought has dropped the river’s summer
level in Memphis to about 13 feet below normal, and it is forecast to
fall about 2 1/2 feet more by Aug. 22. That would be more than 55 feet
lower than the highest reading taken during last year's near-historic
flood."
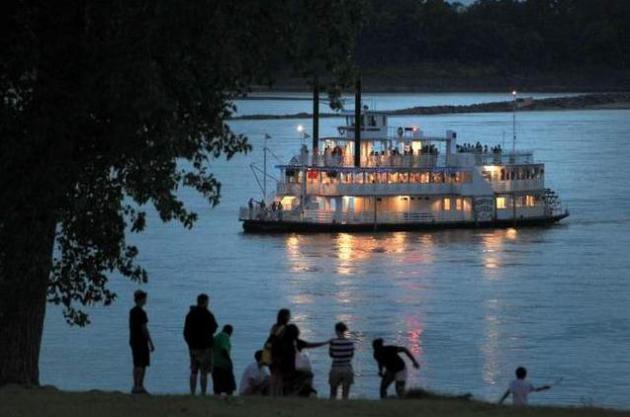
Photo credit above: "
In this July 13, 2012 photo, the
Memphis Queen riverboat moves down the Mississippi River in Memphis,
Tenn. A year after nearly record floods, the Mississippi River level has
dropped so low that it's beginning to affect commercial operations.
Port managers worry that their passages to the river could fill up with
silt, and barge operators may have to lighten their loads." AP Photo: Nikki Boertman.
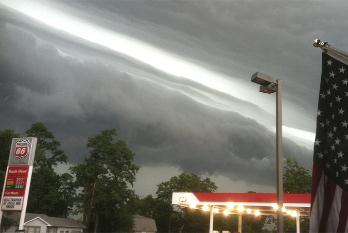
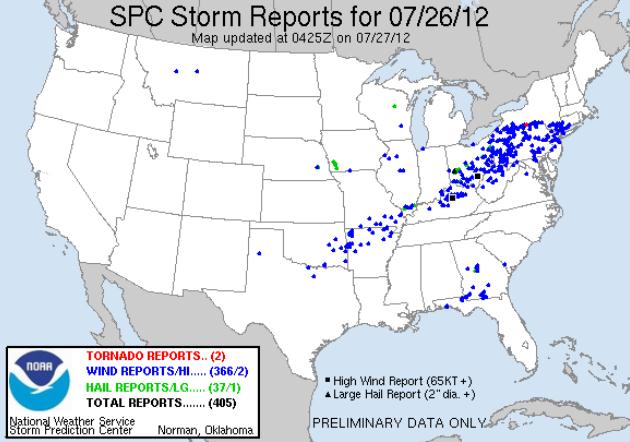 Wild Thursday
.
The squall line that roared across the Ohio Valley into Pennsylvania,
New Jersey and New York State. There was at least one tornado touchdown
(near Elmira, New York) with considerable tree damage; 366 separate
reports of severe wind damage along the leading edge of Canadian relief.
Details from
SPC.
* for the first time in 16 years, SPC issued a Day 2 "Moderate Severe
Threat" east of the Rockies. A few photos of the resulting squall line:
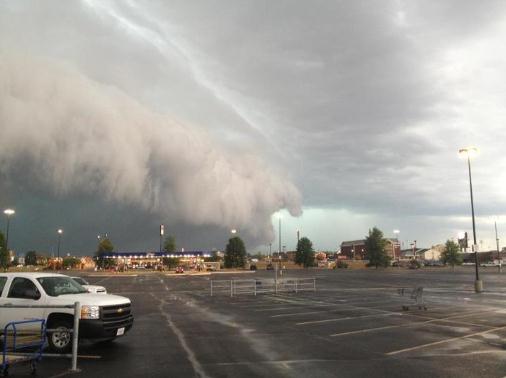
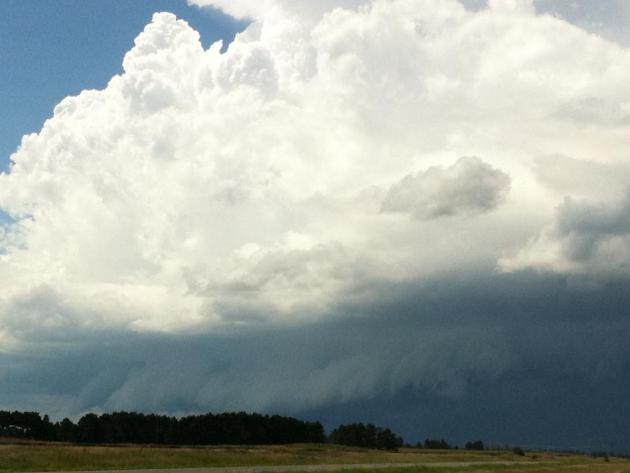
Shelf Cloud. Evidence of potentially violent straight-line winds near Marion, Illinois, courtesy of Mike Leuchtenberg.
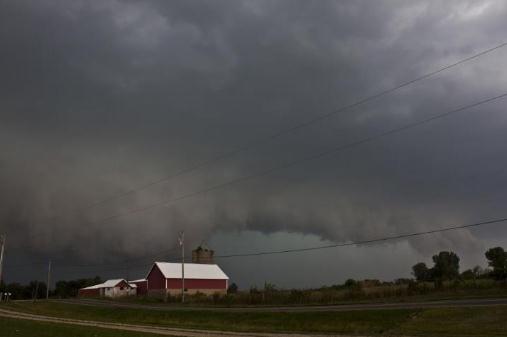
Threatening Sky. Michelle White-Eyman snapped this photo near Mechanicsburg, Ohio. Yep, I'd be heading for the nearest basement right about now.
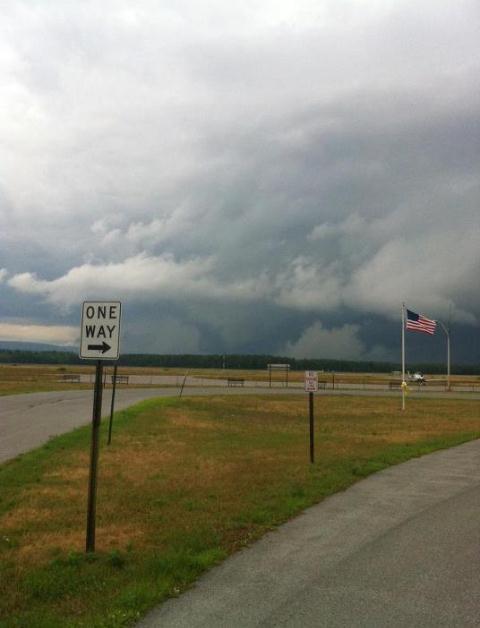
Thursday Funnel - In New York State? Details via The Albany Examiner and
Facebook: "
Photo
of a wall cloud/possible funnel cloud in Saratoga county, just
northwest of Saratoga Springs around 7 PM this evening…confirmed by NWS
Albany with some weak rotation noted on radar at the time…(Photo by
Sean Organ)"
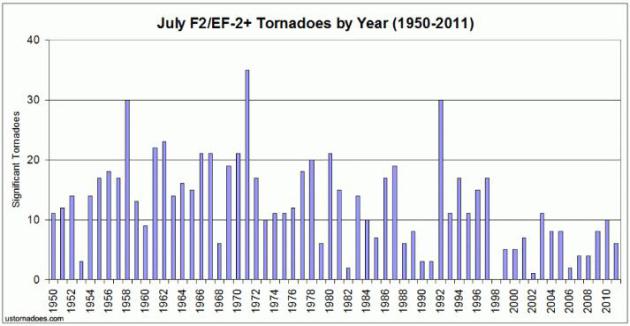
Significant July Tornadoes In The United States. Here are some interesting statistics from
ustornadoes.com: "
July continues the trend in recent months of a smaller ratio of significant tornadoes, or those F2/EF-2 and stronger, to overall tornadoes.
Only 13 percent of the months tornadoes from 1950-2011 reached this
strength. But, as throughout the year, these tornadoes make up in death
and destruction what they lack in numbers."
Farming Changes Can Limit Risk. Here's an timely excerpt of a
New York Times Op-Ed
from Jon Foley, director of the Institute on the Environment at the
University of the Minnesota, where he holds a McKnight Presidential
Chair in global environmental sustainability: "
Droughts happen.
They have happened in the past, and they will happen in the future.
Whether the odds of extreme droughts are changing is still an open
question, but signs point to shifting patterns of climate. No matter
the cause, droughts have a heavy impact on agriculture. This year,
American corn and soybean crops are being crippled by high temperatures
and low rainfall. Only a lucky few farmers will have a decent
harvest. Sadly, much of America’s commodity agriculture is especially
vulnerable to climatic extremes – whether droughts, floods, heat waves
or cold snaps. In particular, it is hard to imagine a system more
susceptible to bad weather than the American corn and soybean belt."
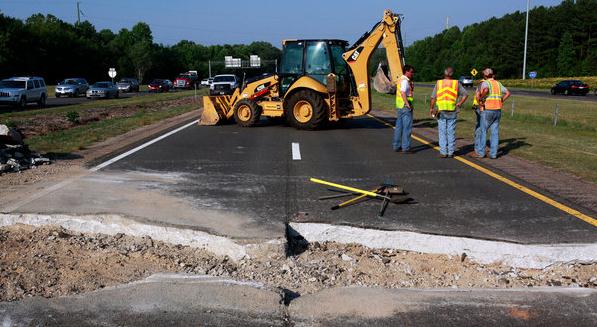
Weather Extremes Leave Parts Of U.S. Grid Buckling. Here's a snippet of a
New York Times article: "
From
highways in Texas to nuclear power plants in Illinois, the concrete,
steel and sophisticated engineering that undergird the nation’s
infrastructure are being taxed to worrisome degrees by heat, drought
and vicious storms....The frequency of extreme weather is up over the
past few years, and people who deal with infrastructure expect that to
continue. Leading climate models suggest that weather-sensitive parts
of the infrastructure will be seeing many more extreme episodes, along
with shifts in weather patterns and rising maximum (and minimum) temperatures."
Photo credit above: Travis Long/The News & Observer, via Associated Press. "
Emergency repairs on a highway that buckled in triple-digit temperatures last month near Cary, N.C."
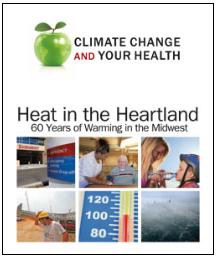
Heat In The Heartland: 60 Years Of Warming In The Midwest. Here's a
new study
released by UCS, the Union of Concerned Scientists, focused on
temperature trends in recent decades. A few highlights of the report: "
Deadly
heat waves have become more common in the Twin Cities because the
city's weather has changed; more hot, dry air masses from the American
Southwest and hot, humid air masses from the Gulf of Mexico and
Caribbean Sea are intruding and settling over the city," said Dr. Larry
Kalkstein, lead report author and University of Miami professor. "During
the past 60 years, these oppressive hot air masses have not only become
more frequent, they have warmed significantly, which can threaten human
health."
"
The Twin Cities went from having an average of 13 cool summer
days to 9, from 7 dangerously hot days to more than 11, and from 2 heat
waves to 3 each summer."
- Heat waves lasting three days or more have become more common
over the last six decades. St. Louis has approximately four more
three-day heat waves each year than it did in the 1940s.
- On average, hot humid days have increased more rapidly in
frequency, while hot dry days have increased in temperature more
rapidly across the Midwest since the 1940s and 1950s.
- The meteorological characteristics of these weather types are
also changing. In general, hot air masses have become hotter and more
humid during nighttime hours.
- In some cities, average nighttime temperatures within some air
mass types have increased as much as 4 to 5 degrees Fahrenheit (˚F)
over the six decades.
- Relief from heat is harder to find—all of the cities studied now have fewer cool, dry days in the summer.
- The results aren’t due solely to an urban heat island effect on
major cities. Less urban neighboring locations showed similar increases
in hot summer air masses.
* an Executive Summary of the UCS report (pdf) is
here.
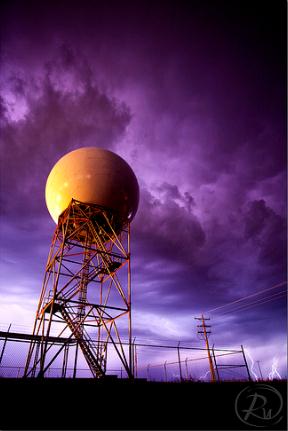 KMPX Upgrading To "Dual Polarization"
.
As of August 20 the Twin Cities Doppler radar (based in Chanhassen)
will be out of commission for 2 weeks while the NWS upgrades to the
latest generation of Doppler: "dual pol".
Details:
"Beginning August 20, 2012, the Doppler radar at your National Weather
Service Forecast Office will undergo an upgrade to incorporate new
technology. While the work is being done, radar data will be unavailable
from NWS Minneapolis! The radar is scheduled to be unavailable for two
weeks during this upgrade. Recently, though, technicians have been
completing the upgrade in 5 to 6 days, and radar data will become
available as soon as the upgrade is complete.

 The advantages of "dual pol"?
* Better estimation of total precipitation amounts.
* Better estimation of the size distribution of hydrometeors (raindrops, snowflakes, hailstones, drizzle).
* Much improved ability to identify areas of extremely heavy rainfall that are closely linked with flash floods.
* Improved detection and mitigation of non-weather related radar echoes (chaff, smoke plumes, ground clutter).
* Easier identification of the melting layer (helpful for identifying snow levels in higher terrain).
* Improved ability to classify precipitation type.
Photo above courtesy of Reid Wolcott.
Olympic Weather Update. I love the British accent. Then again, we Yanks may be the ones with accents, come to think of it. Here's a great
YouTube update on expected weather in London, courtesy of the UK Met Office: "
Chief
Forecaster Nick Grahame explains the forecast for the London Olympic
opening ceremony. Keep up to date with the forecast during the Olympics
on our event pages http://www.metoffice.gov.uk/events/olympics."
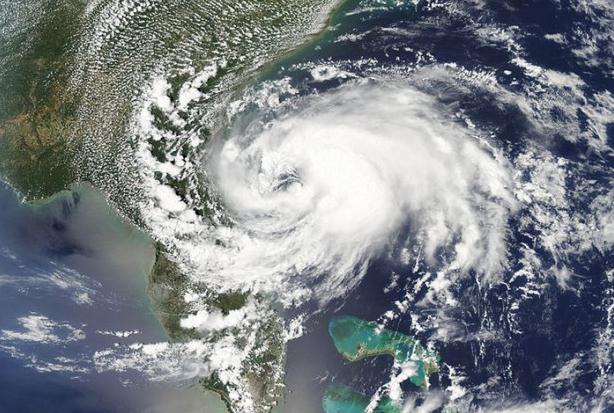
2012 Hurricane Predictions: Tranquil Or Tumultuous? Here's a clip from a story at
redorbit.com: "
The
2012 Atlantic Hurricane Season is now in full swing. However, it has
been fairly light after a vigorous start in May and then a very tranquil
time since then. The biggest reason for the quiet period we are seeing
now has to do with both the placement of the Bermuda High and also the
upper level winds across the Atlantic, which are still a tad
unfavorable for development in the region. The best and most favorable
spots right now are portions of the Gulf of Mexico. When it comes to
making forecasts for hurricanes it can be a very hard task at hand.
Here are a few things that make it hard to forecast for the hurricane
season."
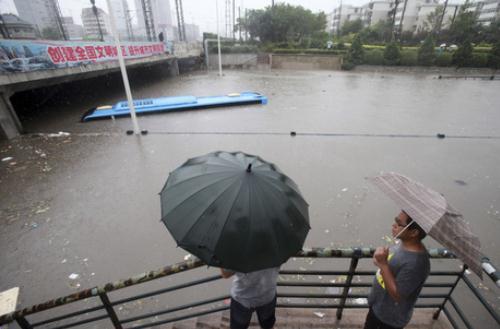
"China's Katrina": Second City Flooded; Corruption, Incompetence Blamed.
NPR
has a very good overview of how a flash flood in Beijing has escalated
into a political crisis for China's leadership; here's an excerpt: "
Outrage
in China about the dozens of deaths last weekend when Beijing's
drainage system couldn't cope with heavy rains and much of the city was
flooded has been followed by more frustration and anger today. There
was flooding Thursday in Tianjin, a city of 6 million, during a
downpour there. Even the state-controlled Xinhua news agency couldn't
ignore what was happening. "The downpour has paralyzed traffic in
downtown Tianjin, drowning many roads. Dozens of vehicles were stranded
on Baidi road in Nankai district after their engines died in the
flood," it reports.
"Many pedestrians complained they had to trek in knee-deep water. In
some sections of Xianyang Street, flood water was waist deep."
Photo credit above: "
Residents look at a submerged bus on a
flooded street in the Chinese city of Tianjin on Thursday. Beijing and
neighboring areas have experienced the worst rainstorms in six
decades. At least 77 people were killed, Chinese authorities said
Thursday."
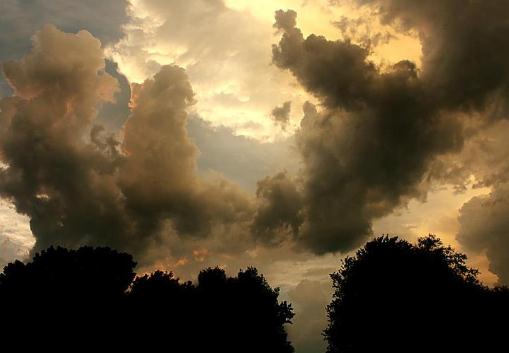
A few fine photos....
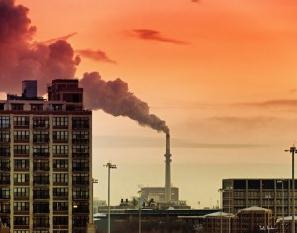
An Ominous Sky. Thanks to Brad Birkholz, who snapped this eerie-looking photo near Neenah, Wisconsin late Wednesday.
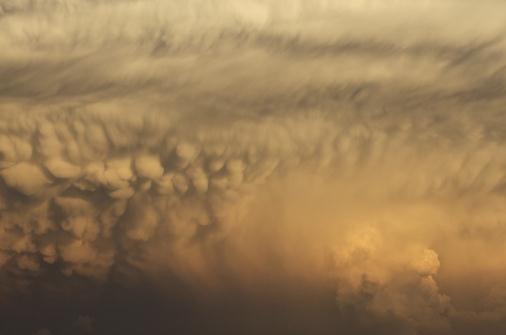
I Want My Mamma. Who writes this crap? Oh, I do.
Sorry. I've run out of photo headline ideas, but thanks go out to Mike
Lachendro, who took this photo of cumulonimbus mammatus on the underside
of a towering thunderhead anvil near Omaha, Nebraska.
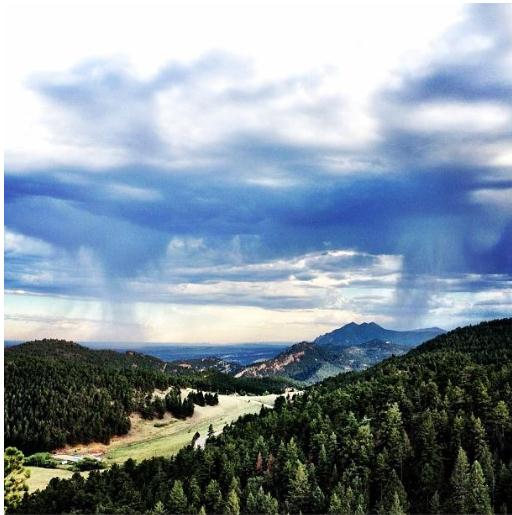
"Isolated Showers". Here's another terrific photo, taken in the Boulder, Colorado area by Jonathan Fields. Very nice.
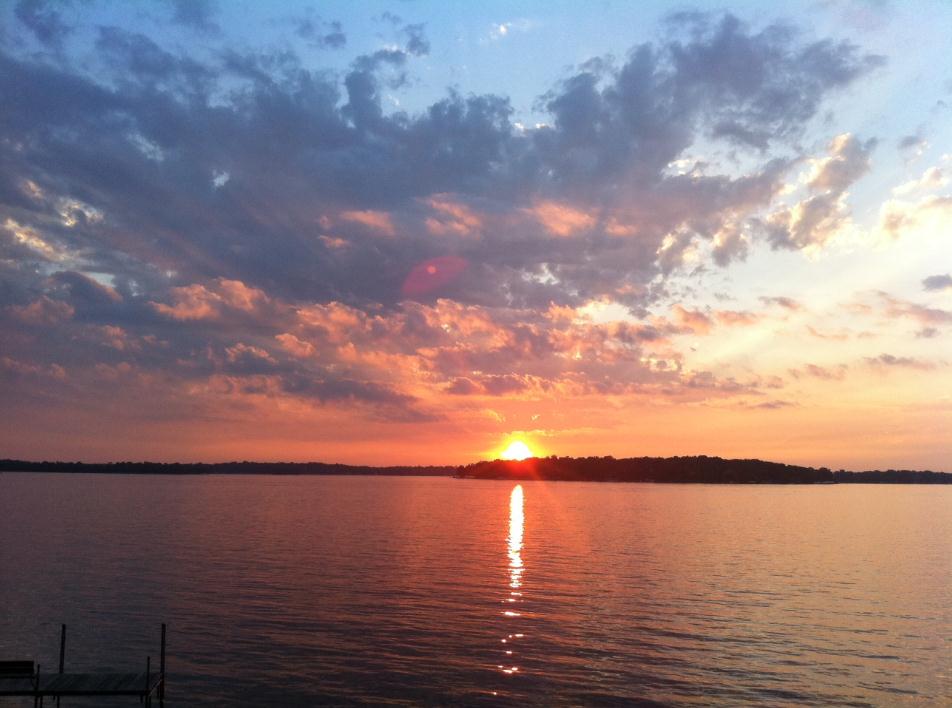
Severe Clear
The bloom is off the rose. I love Minnesota summers, but this year? I should be serving towels with my forecasts.
Wednesday evening was a slow-motion nightmare.
My wife had some friends over. Our (busted) A/C unit created a
sauna-like 90 F. inside, but they couldn't go outside because of the
showers (and bugs). "Check the Doppler. What TIME will this end? You
said the showers would stay south!
" Please take me now, Lord.
A new study by the Union of Concerned Scientists
confirms the heat is on; it's not a fluke, but a trend. Nights are
significantly warmer, and it can't all be blamed on the urban heat
island (asphalt releasing heat at night). "The Twin Cities went from
having an average of 13 cool summer days to 9, from 7 dangerously hot
days to more than 11, and from 2 heat waves to 3 each summer" the report
concluded. Details on the blog.
We catch a break today; dew points in the 50s
(!) T-storms brush southwest Minnesota Saturday PM as temperatures
slowly warm; a few more 90s next week. But no more beastly heat.
Severe drought has returned to far southern & northwest Minnesota, so remind me not to whine about pop-up summer T-showers.
PS: it's safe to go outside honey!
Climate Stories...
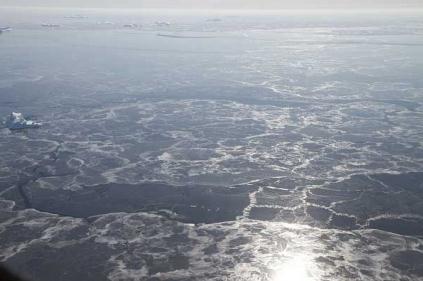
Loss Of Arctic Sea Ice "70% Man-Made". The Guardian has more details: "
The radical decline in sea ice around the Arctic is at least 70% due to human-induced climate change,
according to a new study, and may even be up to 95% down to humans –
rather higher than scientists had previously thought. The loss of ice
around the Arctic has adverse effects on wildlife and also opens up new
northern sea routes and opportunities to drill for oil and gas under
the newly accessible sea bed. The reduction has been accelerating since the 1990s
and many scientists believe the Arctic may become ice-free in the
summers later this century, possibly as early as the late 2020s." (photo: Jefferson Beck, NASA).
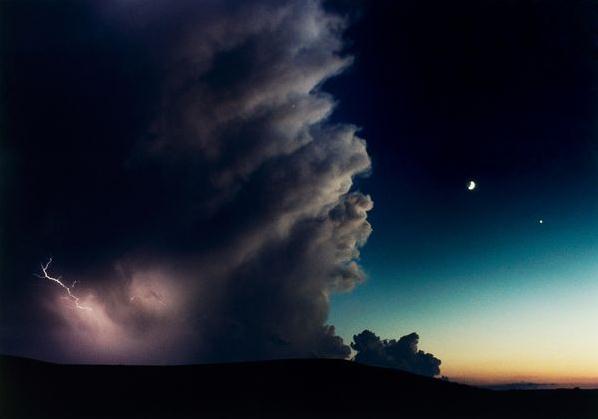
Summer Storms To Create New Ozone Holes As Earth Warms? This was a bit of a head-scratcher, but check out the
National Geographic article and try to connect the dots; here's an excerpt: "
Summer storms may create new holes in our protective ozone layer
as Earth heats up—bringing increased solar ultraviolet radiation to
densely populated areas, a new study says. What's more, if more sunlight
reaches Earth, skin cancer could become the new marquee risk of global warming. As the planet warms, some studies have suggested summer storms may become more frequent and intense. This would send more water vapor—a potent greenhouse gas—into
the stratosphere, the middle layer of Earth's atmosphere, which sits
between 9 and 22 miles (14 and 35 kilometers) above Earth's surface."
Photo credit above: "
A thunderstorm rumbles through Kansas (file picture)." Photograph by Joel Sartore, National Geographic
The Story Behind Record Ice Loss In Greenland. Here's a snippet of a
Climate Central story from meteorologist Andrew Freedman: "...
William Colgan, a research associate at the Cooperative Institute for Research in Environmental Sciences
at the University of Colorado, said the July melt event is extremely
rare, but not completely unheard of. He said an analysis of ice core
records from Greenland Summit station, which at 2 miles above sea level
is near the highest point on the ice sheet, shows that the high
elevation areas of Greenland have experienced melt about once every 150
years during the past 10,000 years. However, such a widespread melt
event is unprecedented in the observational record, which dates back to
about 1930."
Map credit above: "
In this chart you can see that a very
strong area of high pressure (in red shading surrounding Greenland) set
up shop over Greenland during July, providing warmer than average air
temperatures and clear skies to enhance surface melting." Credit: NOAA via Joe Witte.
A Carbon Tax Is More Viable Than Cap And Trade. Here's an excerpt from
theenergycollective.com: "
Pricing carbon
is the cornerstone of a blueprint to contain climate change as it
would provide both incentives and disincentives to reduce emissions. It
would also drive investment and research dollars into renewable energy
and efficiency. The best thing that governments can do to reduce
emissions is to implement a cap and trade scheme or failing that, a
carbon tax. Creating carbon markets is among the most expedient ways to
address climate change. Cap and trade rewards efficiency and punishes
polluters. It would also increase green jobs, lower electricity bills,
enhance competitiveness, and forestall a climate catastrophe."