

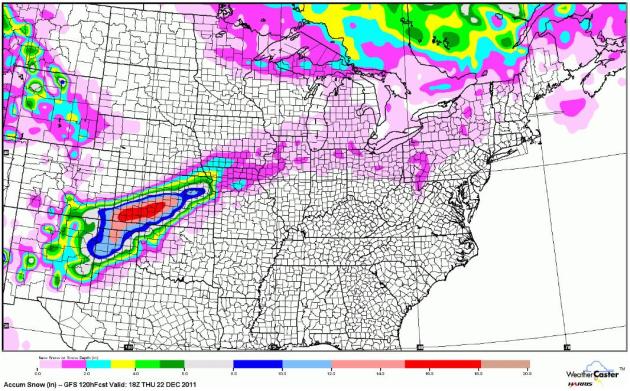
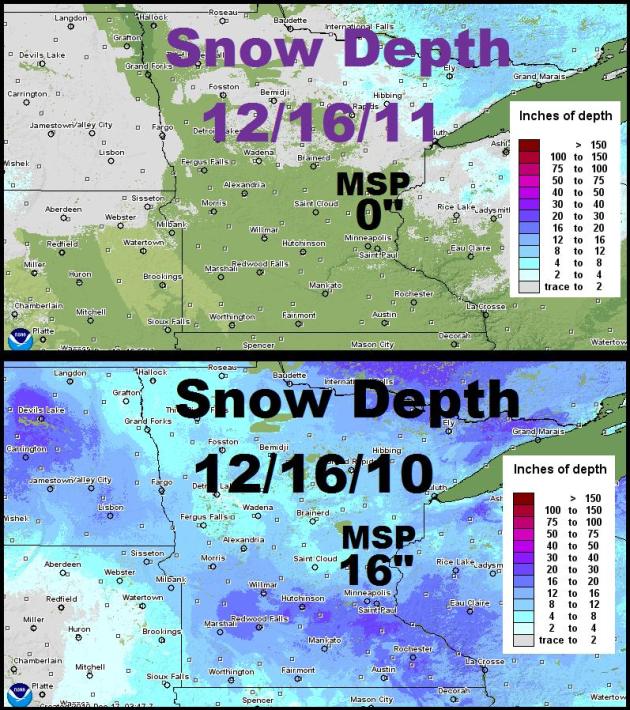
In Search Of Snow. The latest NOAA snowcover map looks like something out of late October, not mid December. It's remarkable how little snow is on the ground, especially from northern New England to the Great Lakes and Upper Midwest, including central and northern Minnesota.
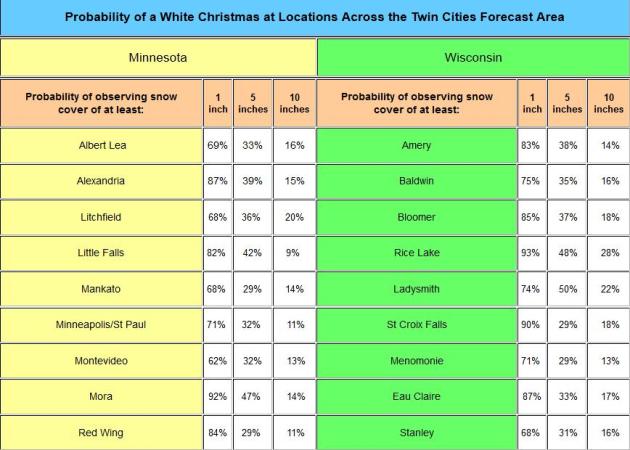
Fun With Statistics. Did you know (or care) that the odds of 5" of snow on the ground in the Twin Cities on Christmas Day is 32%? Or that roughly 1 in 10 Christmases have 10" or more of snow on the ground? Or that 71 out of 100 December 25s have an inch or more of snow on the ground in the metro? Fascinating. More fun facts from the NWS here.
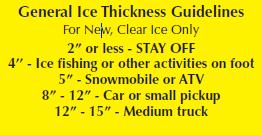
ICE TIPS:
Think in terms of the thermometer rather than the calendar when deciding to go out on the ice. Just because it was okay on December 1st to go out on the ice last year, doesn’t mean it’s going to be safe on the same date this year!
Check with a local resort or bait shop about any known danger spots such as aeration systems or traditionally unsafe areas before heading out on the ice.
Have a plan of what to do if you do break through. Carry rope, ice picks and a flotation device to help save your life or that of a companion.
During the winter of 2000, an ATV operator who broke through thin ice used a pair of ice picks to save his own life. vest‑style life jacket can provide extra warmth and flotation in case you fall through.
* source: Minnesota DNR.
Peak Wind Gusts From Saturday's Santa Ana Wind Event:
LOS ANGELES COUNTY PEAK WIND GUST
MALIBU HILLS...........................NORTHEAST 38 MPH.
NEWHALL PASS...........................NORTH 51 MPH.
SAUGUS.................................NORTH 39 MPH.
CAMP NINE..............................NORTH 59 MPH.
CHILAO.................................NORTHEAST 44 MPH.
CLEAR CREEK............................SOUTHEAST 36 MPH.
WARM SPRINGS...........................EAST 48 MPH.
WHITAKER PEAK..........................NORTH 38 MPH.
VENTURA COUNTY PEAK WIND GUST
CHEESEBORO.............................NORTHEAST 45 MPH.
WILEY RIDGE............................NORTHEAST 48 MPH.
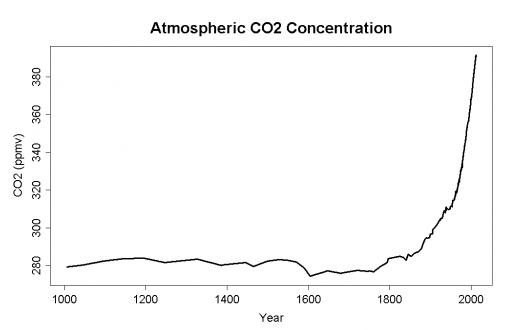
"A recent estimate suggests that the perennially frozen ground known as permafrost, which underlies nearly a quarter of the Northern Hemisphere, contains twice as much carbon as the entire atmosphere....The best estimate so far was published in 2009 by a Canadian scientist, Charles Tarnocai, and some colleagues. They calculated that there was about 1.7 trillion tons of carbon in soils of the northern regions, about 88 percent of it locked in permafrost. That is about two and a half times the amount of carbon in the atmosphere." - from a New York Times article on thawing permafrost below.
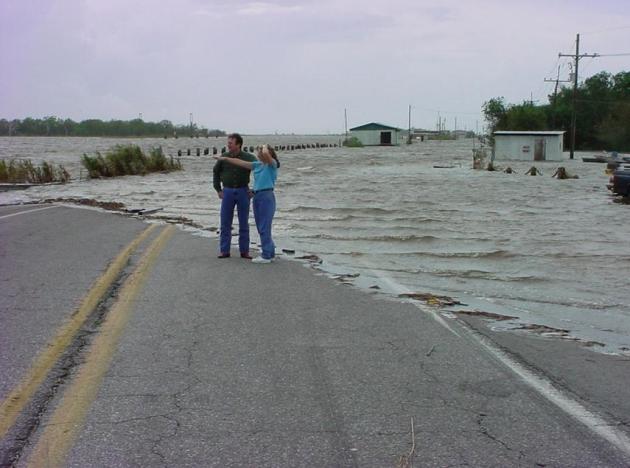
North Dakota Flood Victims Still Await Aid. The L.A. Times has an update: "Nearly six months after a record-breaking flood wiped out a fourth of the city's housing and left 11,000 people scrambling for shelter, the grim future that many feared has come to pass: The frigid winter has descended, and hardly anyone is securely back home. City officials say that only about 10% of flooded families have been able to return to fully repaired homes. An additional 20% have been able to get enough windows, doors and heat to live in the ruined shells of their houses through the winter."
RANKING OF 2011’S MOST COSTLY INSURED DISASTERS
1) Japan’s earthquake, tsunami, $36 BN insured losses
2) New Zealand earthquake, $12 BN
3) Thailand floods, up to $11 BN
4) US tornadoes, Alabama et al, $7.3 BN
5) US tornadoes, Missouri et al, $6.7 BN
6) Hurricane Irene, $4.9 BN
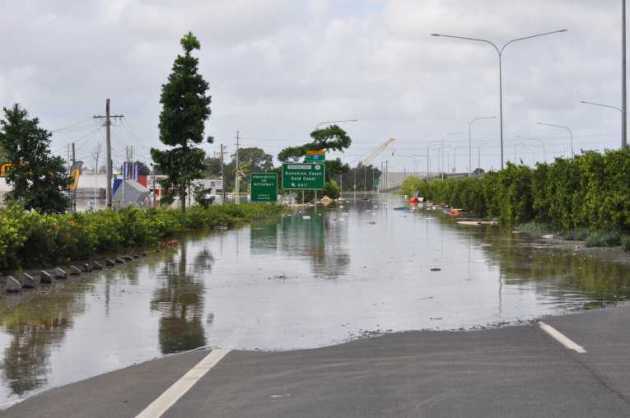
7) Australia floods, $2.3 BN
8) US storms, $2 BN
9) US storms, $1.5BN
10) US storms, $1.4BN
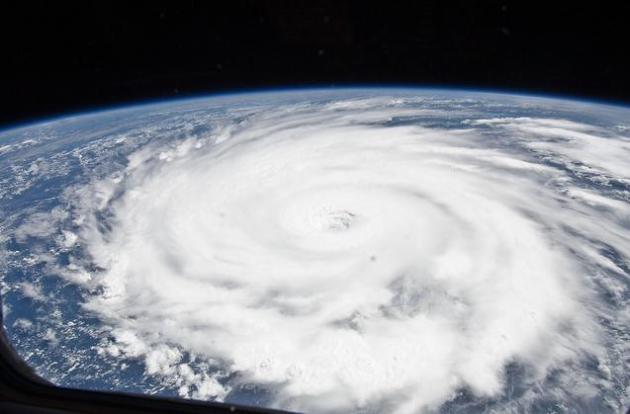
Hurricanes
►2011 was the most expensive hurricane season for the U.S. since 2008.
►Though only three named Atlantic storms made landfall, Hurricane Irene, Tropical Storm Lee and Tropical Storm Don, they caused at least $8 billion in damages, primarily from flooding.
►Many risk experts feel it's time to rethink national flood policies, especially in major metropolitan hubs like New York City.
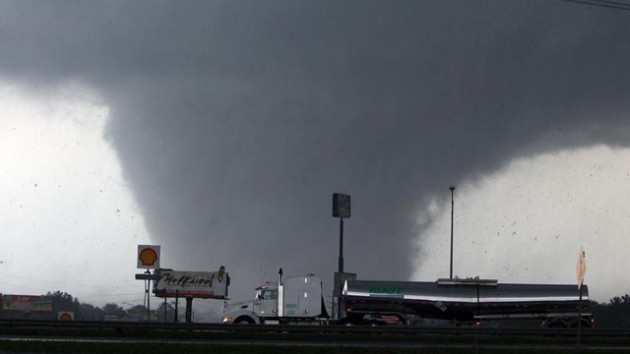
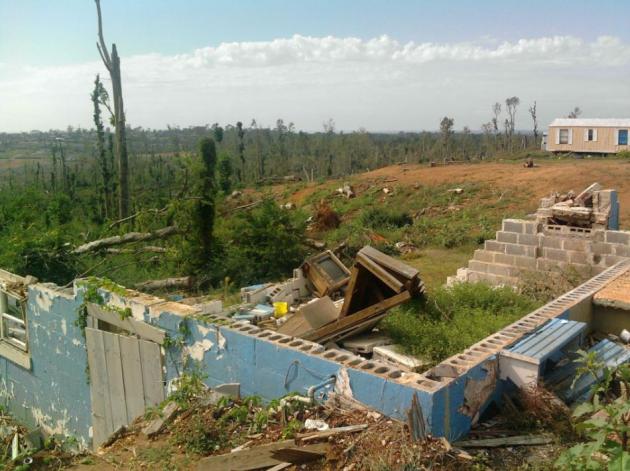
Tornadoes
►The 2011 tornado season was the third most active since 1980, with 1,559 storms to date.
►The "2011 Super Outbreak" that occurred between April 25 and April 28 has been identified as the largest tornado outbreak ever recorded, with 336 confirmed tornadoes spread across the South, Midwest and Northeast of the U.S.
►Property, casualty and commercial insurers are now beginning to reevaluate risk for tornado damage well beyond the traditional geographic focus on "tornado alley" and adjacent areas.
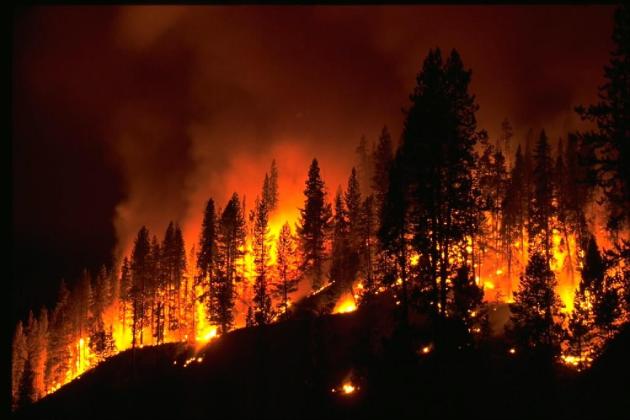
Wildfires
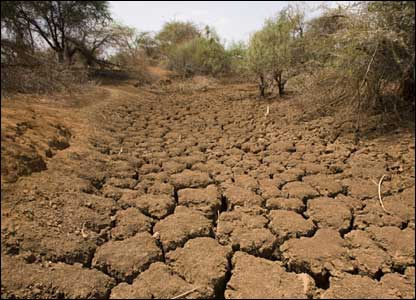
►While the 2011 wildfire season continued the trend of having fewer but larger wildfires, there was a significant geographic shift in home losses over the past year from California, which had a cooler and wetter-than-average fire season, to the drought-affected states of Texas, New Mexico and Oklahoma.
►In May, the largest fire in Arizona history, the Wallow fire, forced thousands of resident evacuations and burned more than 469,000 acres.
►Texas and Oklahoma experienced a record number of wildfires. The Bastrop fire in Texas alone resulted in more than 1,600 homes and structures destroyed and 34,000 acres burned.
►Wildfire trends indicate that wildfire activity often follows a cyclical pattern of increase and decrease due to changing seasonal weather patterns. Based on this, parts of California are expected to see a dramatic increase in wildfire acreage next year.
►Persistent and intensifying drought conditions forecast for a large section of the U.S. for the coming year is expected to intensify and spread wildfire activity in early 2012.
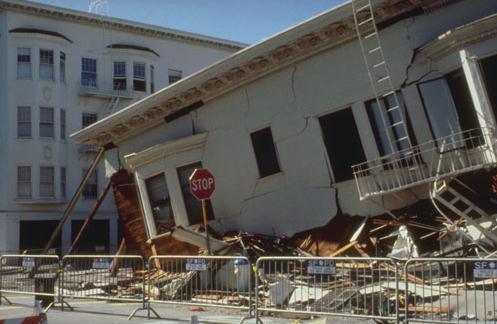
Earthquakes
►The non-western U.S. earthquakes that occurred this year in Virginia and Oklahoma startled many residents who believed earthquakes to be strictly a far western U.S. phenomenon.
►A 5.8 magnitude earthquake hit central Virginia on Aug. 23, and was felt throughout the eastern seaboard. The tremors caused damage to several iconic local structures, namely the National Cathedral and the Washington Monument.
►In early November, Oklahoma experienced a series of low magnitude earthquakes, with a quake on Nov. 5 registering a 5.6 magnitude, the strongest ever recorded in the state.
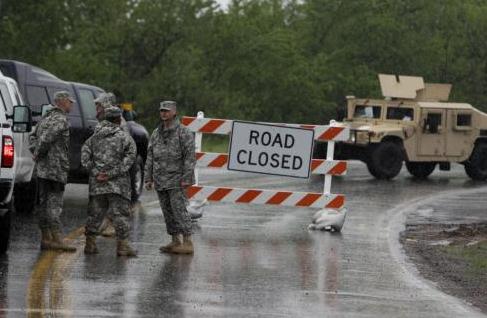
Flooding
►CoreLogic estimates flood losses in the U.S. this year at approximately $10.67 billion, based on various flooding and storm events recorded in the National Climate Data Center.
►The melting of an above-average snowpack across the northern Rocky Mountains, combined with abnormally high precipitation, caused the Missouri and Souris rivers to swell beyond their banks across the upper Midwest.
►Record-breaking rainfall in the Ohio valley in the spring and summer, combined with melting snowpack, resulted in historical flooding along the Mississippi River and its tributaries.
►The floods of 2011 heightened awareness of flood risk outside of the FEMA 100-year flood zones. There has also been an emphasized need to raise current flood protection standards for the critical and strategic infrastructures in the U.S.
►Based on the trend pattern, 2012 should not be an extreme flood year - in fact, there should be several more years before the next extreme flood loss year. U.S. flood loss in 2012 is projected at approximately $3.53 billion.
Increase In Severe Weather Has Authorities On Alert. The Gaylord Herald Times takes a look at recent trends in extreme weather across the USA: "OTSEGO COUNTY — The increase of severe weather events is having an adverse impact on public health, safety and the economy, according to data compiled by the National Oceanic and Atmospheric Administration (NOAA). The data reveals that all 50 states had experienced record-breaking severe weather events in the first 10 months of 2011, including extreme droughts, violent rain and snowstorms, dangerously high temperatures and floods. In addition, the U.S. Centers for Disease Control and Prevention has launched a program to connect state and city health and emergency officials with climate scientists to plan for diseases caused by rising temperatures. A warmer atmosphere means record increases in snow and rainfall. Extreme rainfall has already caused a number of deaths and illnesses through waterborne parasites and diseases."


Virtual Christmas Cards? Jacquie Lawson, based in the U.K., has created some stunningly creative (virtual) cards for the holiday season. If you haven't already sent out (paper) cards and you still want to ping friends and loved ones, consider an e-card. No, I don't get a spiff - I got one of these from a friend yesterday - was very impressed, wanted to share this link.
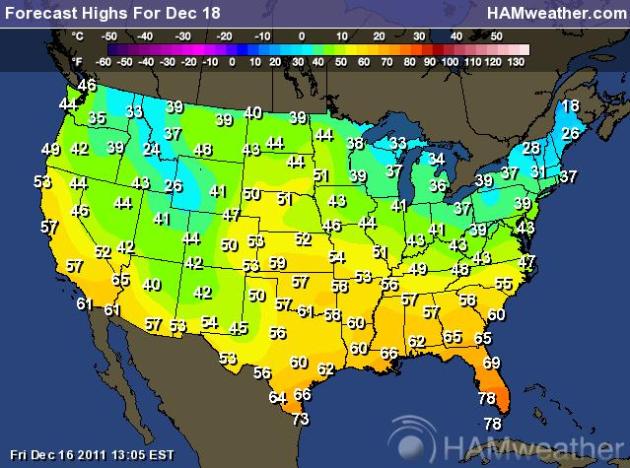
A Late Indian Summer?
All I want for Christmas is my two front teeth (and a couple inches of snow would be nice). Just enough to cover up the yard-bombs from our new puppy, Leo. A shiny new Doppler would be welcome. OK. I'll settle for a weather app for my smartphone.
My company just launched a FREE app for Polaris ("Snow Trails") that has Doppler radar, every snowmobile trail, snow reports, and interactive maps. You can even save and share your favorite rides.
Now all we need is some snow, right? The Winter Solstice, when the sun reaches its lowest point in the southern sky, is 4 days away. We should be knee-deep in it right about now. Instead we're talking low 40s today, a shot at 50 over southwestern Minnesota - maybe even a 40 degree New Year's Day.
Say what?
Will this be another 2005, when 25 inches of snow fell? Or 1987, when 17.4" snow delighted commuters and disgusted winter weather lovers?
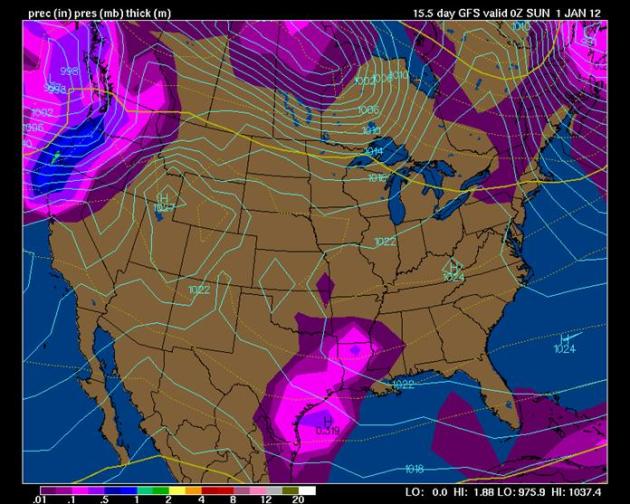
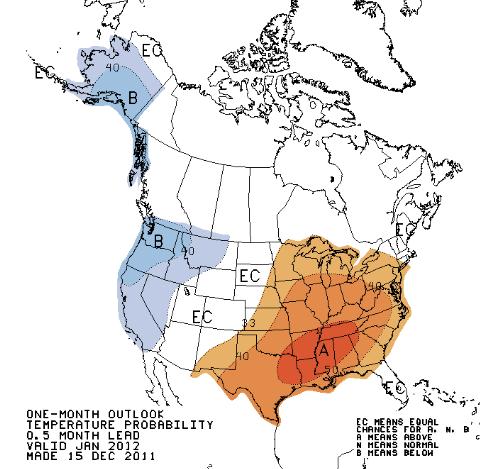
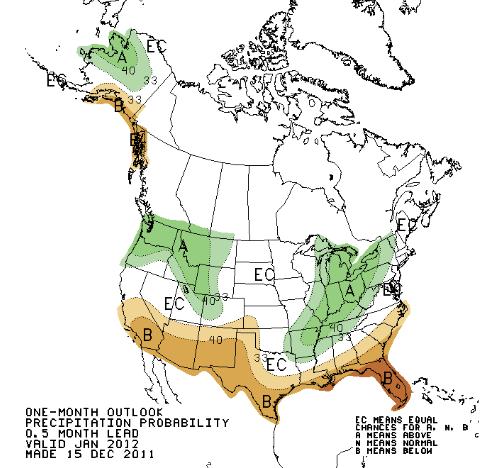
In spite of La Nina, which favors colder winters for northern tier states, CPC, NOAA's Climate Center is now predicting a milder than average January. Howling west winds, a mild "zonal" flow from the Pacific, keep bitter air bottled way up north into early January.
A gloriously boring winter indeed.
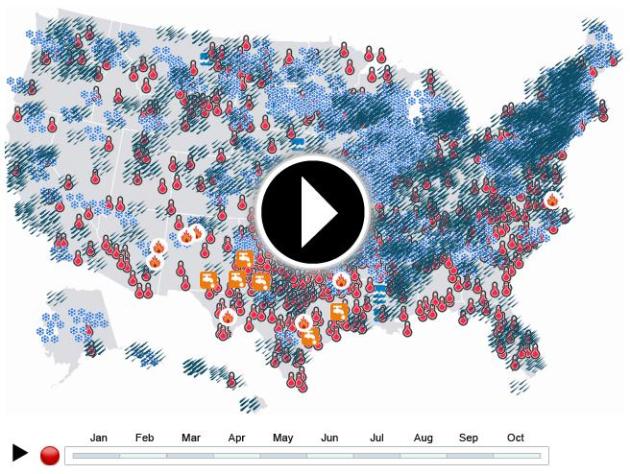
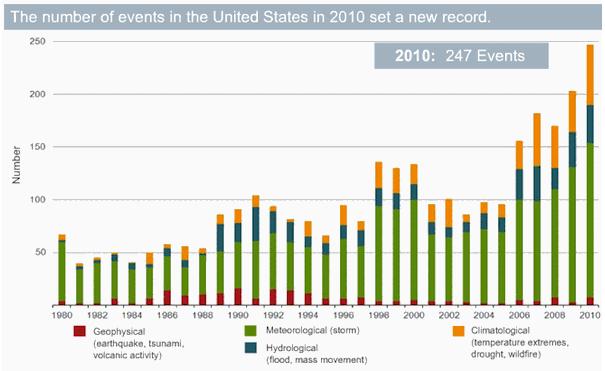
Extreme Weather Map. Thousands Of Weather Records Broken In 2011, Costs Climbing - Climate Change A Factor. Here's more from the Natural Resources Defence Council, the NRDC: "2011 has been a year of unparalleled extremes: 14 disastrous weather events in the US so far this year have resulted in over a billion dollars in property damage – an all-time record breaking number – and their estimated $53 billion price tag doesn’t include health costs. As shown recently, in a first-of-its-kind study published in the journal Health Affairs1, when health-related costs of extreme events are calculated, the total tally increases substantially and will likely continue to climb due to climate change. 7 of the 2011 extreme events – a record-high number – are the type expected to worsen due to climate change. Climate scientists are saying that these events may be part of a troubling trend influenced by climate change2. This trend has also been identified by the international reinsurance company MunichRe [PDF]; they concluded that from 1980 through 2011, the frequency of extreme events in the U.S. is rising.3 A newly-released analysis by international climate scientists (IPCC)4 concluded that climate change will amplify extreme heat, heavy precipitation, and the highest wind speeds of tropical storms."
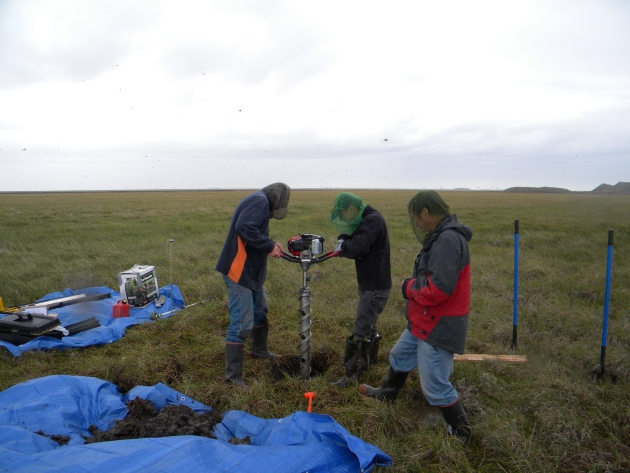
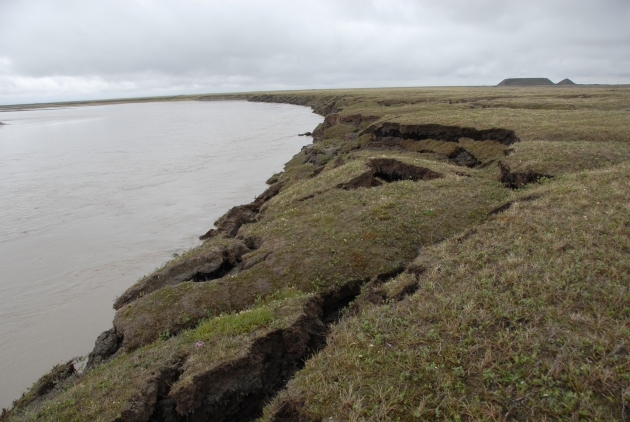
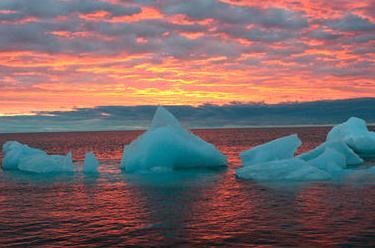
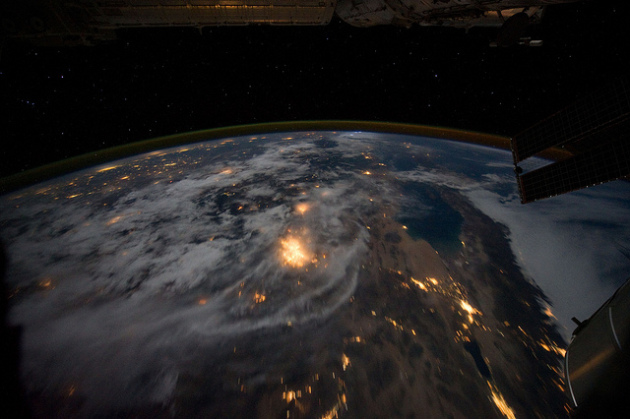
As Permafrost Thaws, Scientists Study The Risks. The story from the New York Times: "FAIRBANKS, Alaska — A bubble rose through a hole in the surface of a frozen lake. It popped, followed by another, and another, as if a pot were somehow boiling in the icy depths. Every bursting bubble sent up a puff of methane, a powerful greenhouse gas generated beneath the lake from the decay of plant debris. These plants last saw the light of day 30,000 years ago and have been locked in a deep freeze — until now. “That’s a hot spot,” declared Katey M. Walter Anthony, a leading scientist in studying the escape of methane. A few minutes later, she leaned perilously over the edge of the ice, plunging a bottle into the water to grab a gas sample. It was another small clue for scientists struggling to understand one of the biggest looming mysteries about the future of the earth." Photo above courtesy of NOAA.


First, the evidence. On Judith Curry’s blog, one can find this piece of text:
Fifth, Mr. Matarese challenges me to support my calling him a goat buster.
Here is one quote:
"When I got a look into the e-mail communications which Dr. Mann mistakenly assumed would never get into the hands of the people he’d been so successfully defrauding and suppressing, I confess that it got my Sicilian up, and I began recalling remote locations in the Pine Barrens – well within driving distance of Centre County, Pennsylvania – where a little work with some shovels and a sack of quicklime could serve a genuine public benefit."
http://neverendingaudit.tumblr.com/post/14275878869