
56% of the USA experienced either extreme drought or excessive rainfall in 2011, a new national record.
22% is the national average for extreme drought/rainfall.
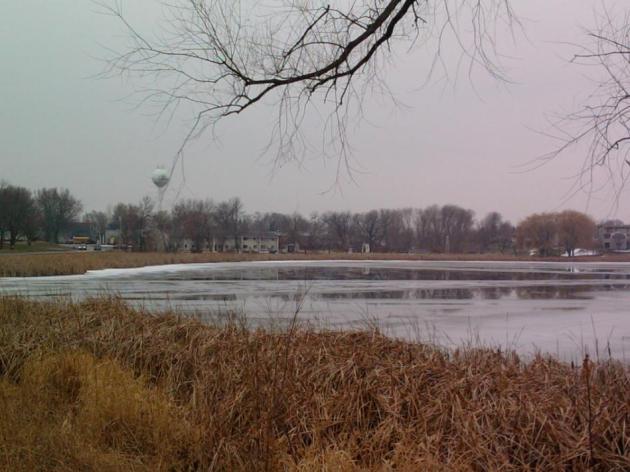
Thin Ice. Note to self: stay off the ice until further notice. It's nowhere close to being thick enough to support people, much less snowmobiles or vehicles. This shot was taken by WeatherNation meteorologist Bryan Karrick at Benton Lake in Cologne.
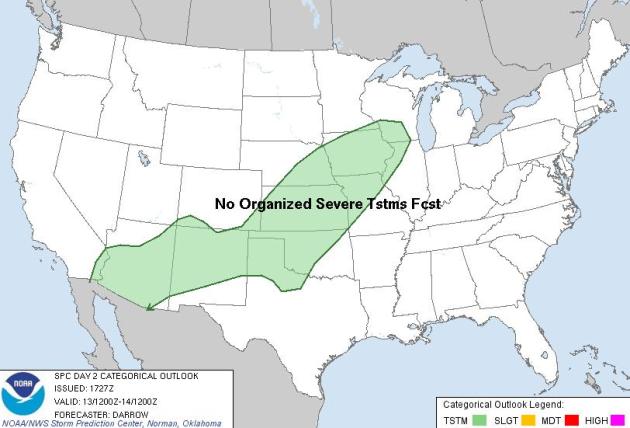
December Thunder? SPC is predicting a few general T-storms as close as Iowa, possible far southeastern Minnesota, late tonight into Wednesday morning. Yes, very odd for mid December.
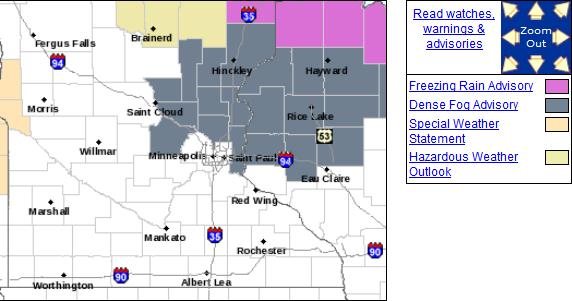
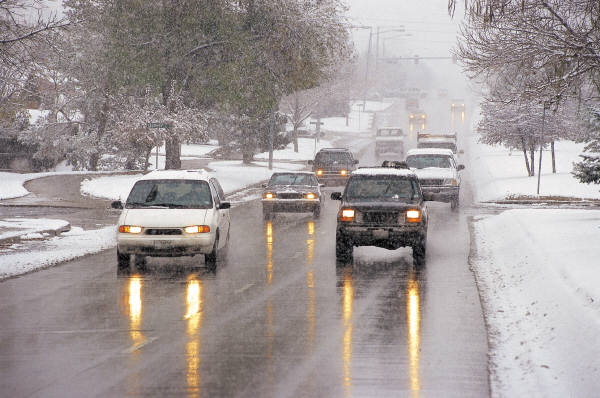
THE NATIONAL WEATHER SERVICE HAS ISSUED A DENSE FOG ADVISORY FOR
PORTIONS OF EAST CENTRAL MINNESOTA AND WEST CENTRAL WISCONSIN
THROUGH 900 AM TUESDAY MORNING. SOME CITIES INCLUDED IN THE
ADVISORY ARE BALSAM LAKE...RICE LAKE...NEW
RICHMOND...CAMBRIDGE...EAST BETHEL...MILACA...ZIMMERMAN AND
CLEARWATER.

AREAS OF DENSE FOG CONTINUE TO EXPAND OVER PORTIONS OF EAST
CENTRAL MINNESOTA AND WEST CENTRAL WISCONSIN. VISIBILITIES WERE
REDUCED TO LESS THAN ONE QUARTER OF A MILE. THE DENSE FOG WILL
CONTINUE TO EXPAND EAST AND SOUTH ALONG THE INTERSTATE 94 CORRIDOR
AND INTERSTATE 35 NORTH FROM THE TWIN CITIES...CAMBRIDGE TO MORA.
MOTORISTS ARE URGED TO DRIVE CAREFULLY...AND LEAVE PLENTY OF
STOPPING DISTANCE BETWEEN THE VEHICLE IN FRONT OF YOU. SOME LIGHT
COATING OF ICE MAY FORM ON ROAD SURFACES THAT ARE UNTREATED.
CONDITIONS ARE EXPECTED TO IMPROVE LATE TUESDAY MORNING.
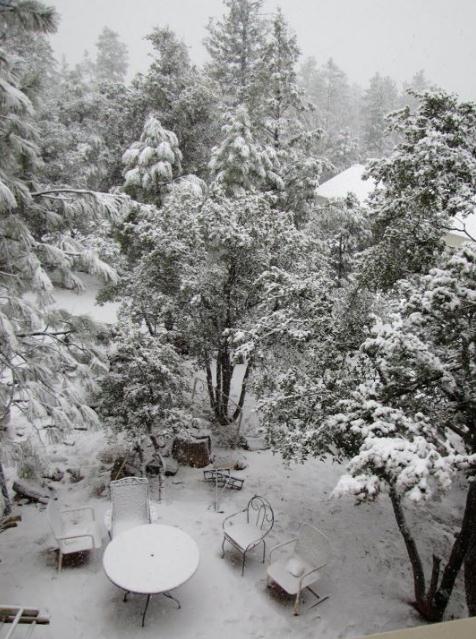
Arizona Snow? Check out the photo from Strawberry, Arizona, about 100 miles northeast of Phoenix - altitude 6,000 feet. It's strange that parts of Arizona have more snow on the ground that Minnesota.
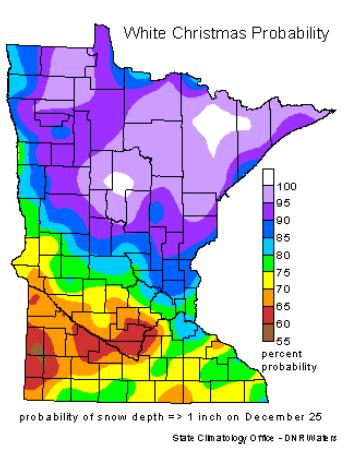
White Christmas? It's Going To Be Close. Last December we didn't have to worry - a grand total of 33.4" of snow fell during December of 2010. This year we're going to come right down to the wire - not sure we'll see the 1" of snow on the ground (or more) that defines a "white Christmas". The statistical odds of 1" or more of snow is 72% but 100% of Christmases are white over the Iron Range. The odds drop to 55-60% near Windom and Redwood Falls. More from the Chanhassen National Weather Service here.
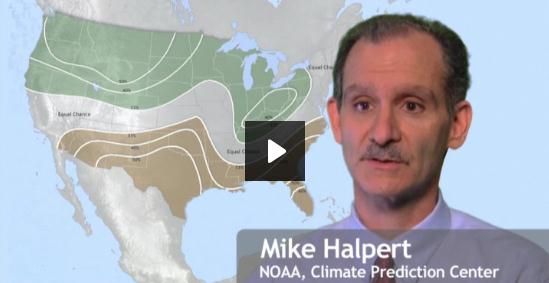
Winter Outlook For 2011-2012. Here's an update from NOAA's CPC, the Climate Prediction Center: "CPC has updated its winter outlooks of the forecast for the months of December, January and February. And the winter outlook for this winter favors above average temperatures across much of the South, from New Mexico across the Southeast to the Atlantic coast… and also favors below average temperatures across much of the Northern plain, the Northern Rockies, the Pacific Northwest, and a good part of the West as well as the southern half of Alaska. With regards to precipitation, we see those areas most likely to experience below-average precipitation across the South– in particular Florida and Texas– with a better than even chance of being wetter than average across much of the North– particularly from the Ohio valley and the Northern Rockies and the Pacific Northwest. On a particular climate forecast map, what we show in terms of colors is the most likely forecast, or the most likely category, in a three-class system. At every location, though, there are three possible outcomes. If we look just at the precipitation forecast, precipitation can either be below average, near average, or above average."
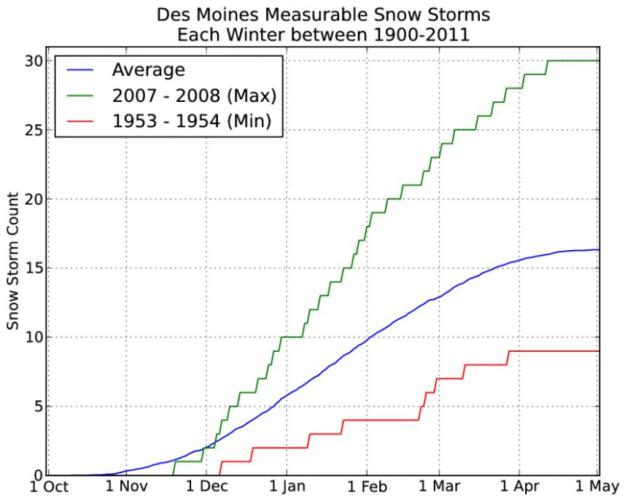
Many Storms To Go. From the Iowa Environmental Mesonet: "The featured chart presents a climatology of winter season snow storms for Des Moines. For this chart, a snow storm is defined as having at least one day with measurable snowfall followed by at least one day without snow. The years with the maximum and minimum number of storms are shown as well. With only a few storms in the books this year, we have plenty more to go. "

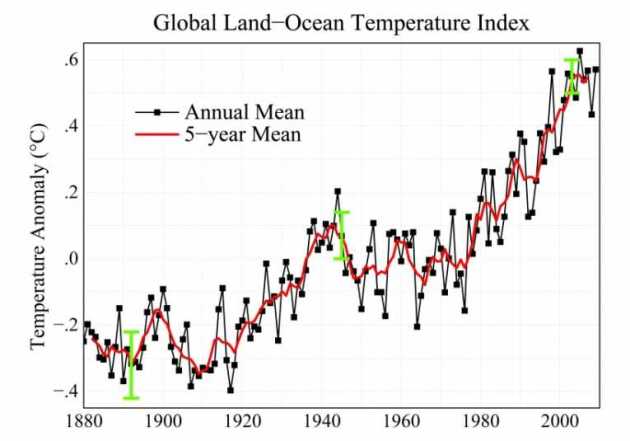
Climate Stories...
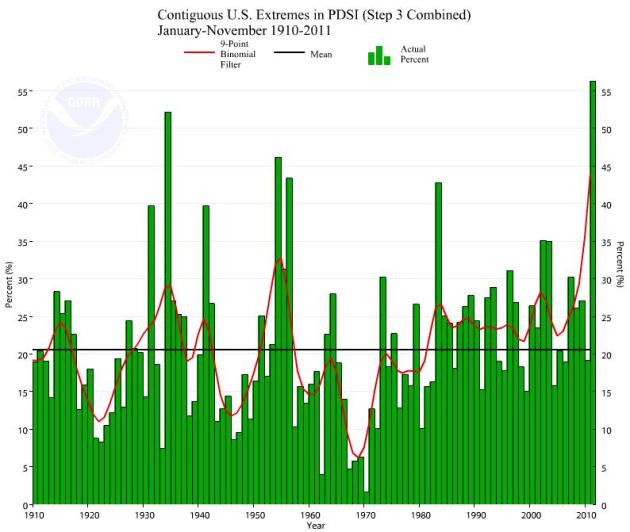
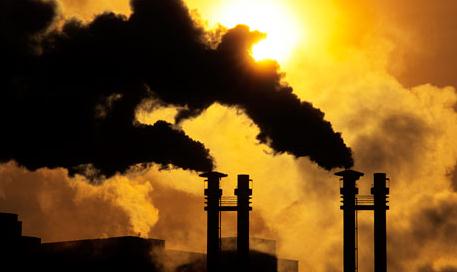
2011: An Historic Year For Weather Extremes. According to NOAA, 56% of America experienced either severe drought or excessive rainfall this year, an all-time record. That's a remarkable number, considering the long-term average is 22% (according to Jeff Masters at Weather Underground). The Capital Weather Gang has a good explanation of the CEI Index from NOAA, what it means, and why 2011 has been off the scale in terms of wet/dry extremes.
The Wall Street - Climate Change Connection. Salon.com has the story: "Think “climate change” and the companies that come to mind are oil giants like Exxon Mobil or BP – not JP Morgan or Bank of America. But a new study by Urgewald, a German environmental organization, establishes a strong link between large multinational banks and the coal industry, one of the biggest contributors to climate change. The study (.pdf), “Bankrolling Climate Change,” identifies the top 20 “climate killer” banks by the amount of financial support they give the coal industry. Number one is JP Morgan Chase, followed by Citi and Bank of America. That’s despite lofty rhetoric from these companies about their work to address climate change."
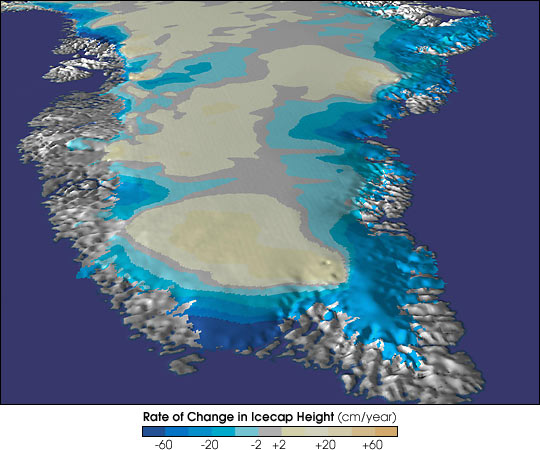
Study: Greenland Faces Land Crisis As Global Warming Heats Up. The State Column has more information: "A new study released Friday finds that Greenland has risen in recent years as the rate of ice melting has increased, a startling revelation that scientists attribute to global warming. Speaking at a conference on Friday, a team of scientists from Ohio State University said a network of 50 GPS stations measured the uplift as the ice loss, noting that the rate of ice loss has accelerated in southern Greenland by 100 billion tons. The study was lead by Ohio State University researcher Michael Bevis."
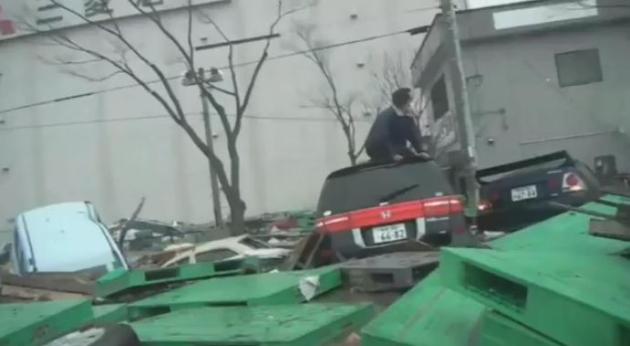
In Glare Of Climate Talks, Taking On Too Great A Risk. The story from the New York Times: "DURBAN, South Africa — For 17 years, officials from nearly 200 countries have gathered under the auspices of the United Nations to try to deal with one of the most vexing questions of our era — how to slow the heating of the planet. Every year they leave a trail of disillusion and discontent, particularly among the poorest nations and those most vulnerable to rising seas and spreading deserts. Every year they fail to significantly advance their own stated goal of keeping the average global temperature from rising more than 2 degrees Celsius, or about 3.6 degrees Fahrenheit, above preindustrial levels."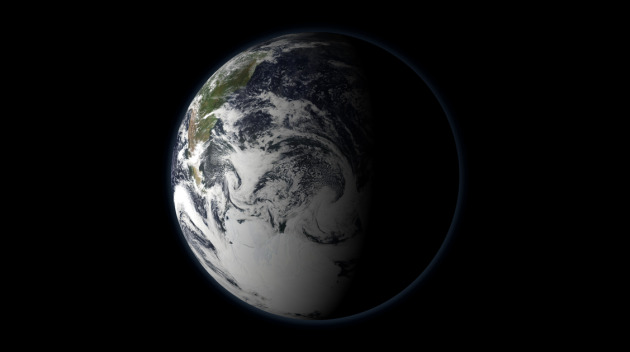
NOAA Chief Connects The Climate Change Dots. The Houston Chronicle has the story:
A: It's unfortunate when politics gets in the way of serving the American people. The kind of climate services we provide is simply information so that people can plan. It's clear that that information is highly valued, and needed.
Q: Do you have any plans to reorganize the National Weather Service?
A: The National Weather Service plays a key role both in providing weather forecasts as well as disaster warnings. We will always continue to do better and better, and often times with less and less, and that's the direction we're headed, but I don't foresee any major restructuring.