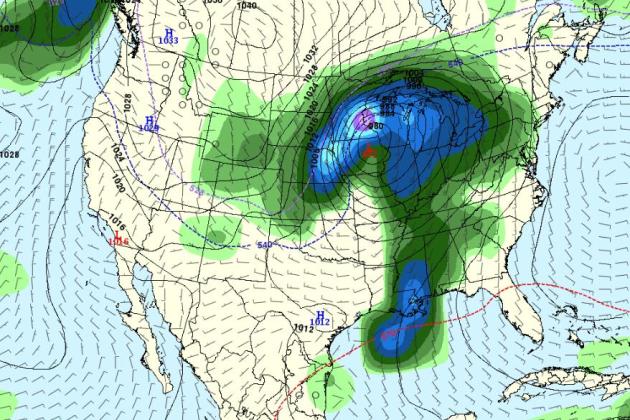
Snow Early Next Week? Don't get your hopes up (yet). Earlier Tuesday the GFS was hinting at a major storm for the end of next week. Late-day runs killed the storm, but a weaker area of low pressure may still squeeze out a few inches of wet snow close to home Monday and Tuesday of next week. The often-more-accurate, European ECMWF
model is
not impressive for snow, and at the rate we're going (with the drought signal overwhelming everything) I have a strong hunch we may not get all that much snow early next week. Still too early to say...
 Warming Trend
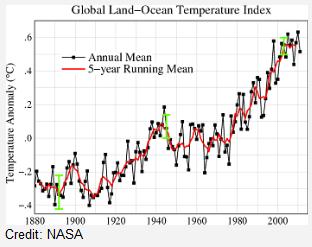
. What happened to -30 F. lows in the metro area? They were fairly common back in the 70s, but data shows a slow moderating trend in the last 40 years. We'll take a look at MSP's coldest nighttime lows for the last 50 years.
"I contend that any gardener who is paying the least bit of attention to what happens in the both summer and winter can see what's happening around us." - gardener (and investment banker) Jack Falker, Edina. Details below.
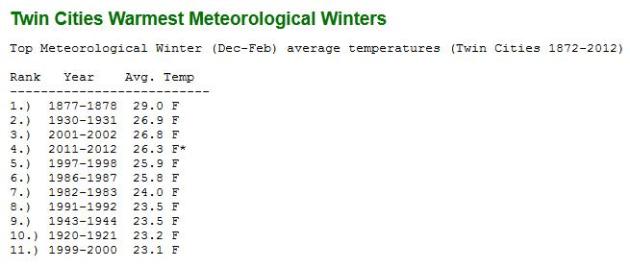
4th Warmest Meteorological Winter For The Twin Cities. Here's the latest from Pete Boulay at the MN State Climate Office: "
We took a hit with the coolish last few days. Plugging in the numbers so far for February, plus the National Weather Forecast through next Tuesday and assuming a few degrees above average for the rest of the month, I figured 26.3 degrees for the winter, or 4th warmest." Meteorological winter runs from December 1 through March 1.
Graph above courtesy of the Minnesota State Climate Office.
 Azaleas
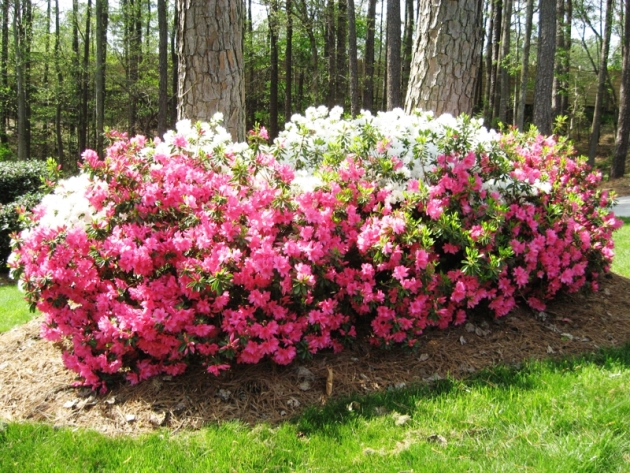
 blooming in the Atlanta, Georgia area, roughly 1 month ahead of schedule. So are severe allergies. Photo and story courtesy of
activerain.com.
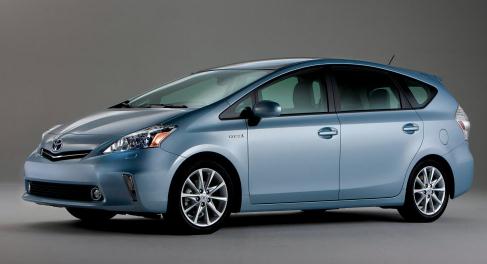 Can A Prius Increase Global Warming?
 Not sure I follow the logic - it's a story that's bound to stir up some controversy from the Christian Science Monitor, below.
600 people or more have died in Europe and Asia from extreme cold in recent weeks. Photo: Boris Grdanoski/AP.
15 foot snows have buried portions of Romania and Albania. Details below.
"Over 5,000 Russians have suffered from hypothermia or frostbite while the country has seen 20 days of unusually cold weather when temperatures fell 13°F to 25°F below normal and Moscow on Feb. 13 endured temperatures of -4°F. (It could be worse though — temperatures in the northern Russian city of Toko fell to -63°F.)" - from a Time Magazine article highlighted below.
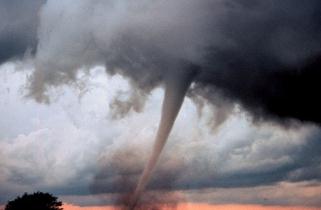 550 Americans killed by tornadoes last year. Is it possible to isolate the conditions necessary for tornadoes 1 month in advance? Details below.
 Photo: NOAA.
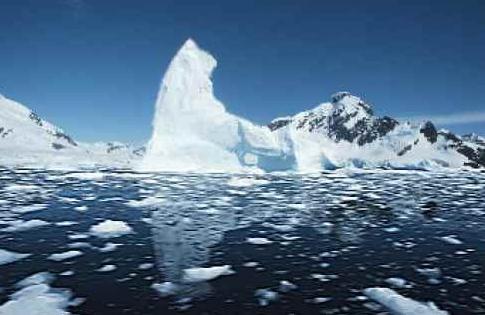
536 gigatonnes (+/- 93Gt) of ice was “lost” globally between 2003 and 2010. Details below.
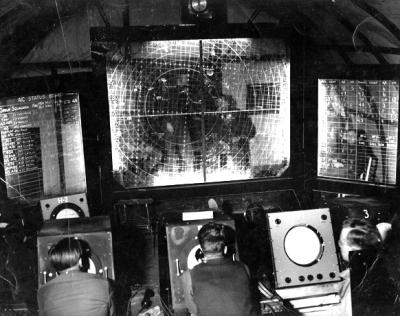 February 14, 1947
: the Weather Bureau (a precursor to the National Weather Service) commissioned its first weather radar in Washington D.C. Radar technology was originally used in WWII. It was used to track aircraft, but the military noticed blips of interference showing up on the screen (which turned out to be rain and snow).Wikipedia has some good information on the evolution of radar
here. Photo credit
here.
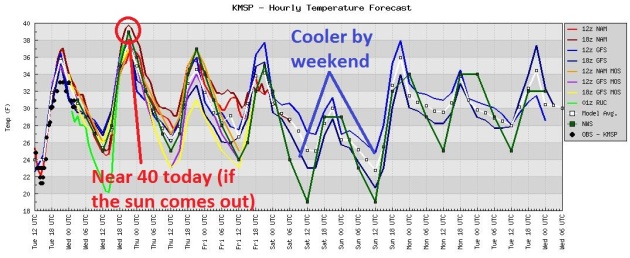 More Shades Of Early March
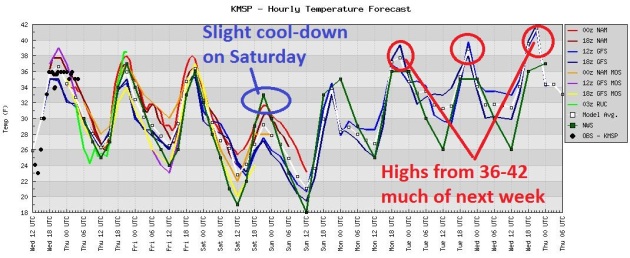
. If the sun does burn away the clouds and fog later today the mercury may approach 40 in the metro area. Light winds and a weak inversion may keep clouds overhead much of the day, a better chance of spying the sun Thursday as westerly winds increase. Temperatures cool off a few degrees over the weekend before recovering again next week.
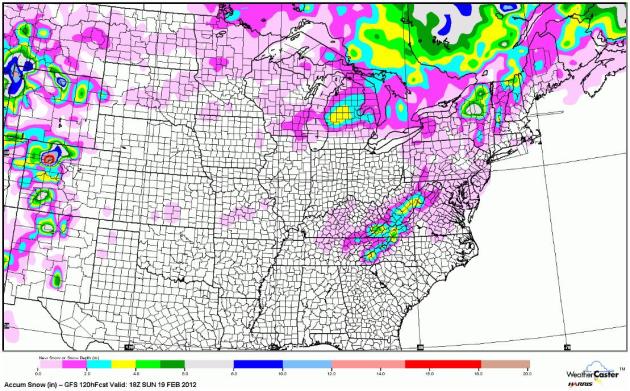 No Snow Through Sunday.
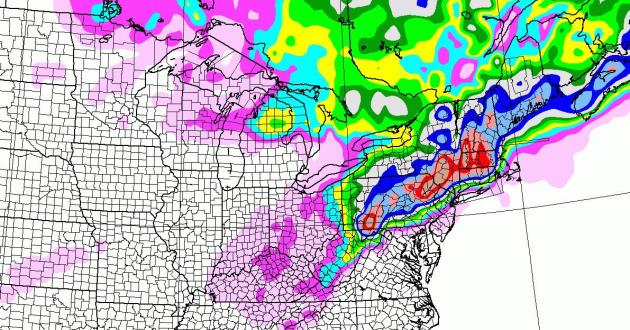
 The GFS
map above shows total snowfall expected between now and midday Sunday, a couple inches for Lower Michigan, upstate New York and the Appalachians. Other than that - the Great Snow Drought limps on.
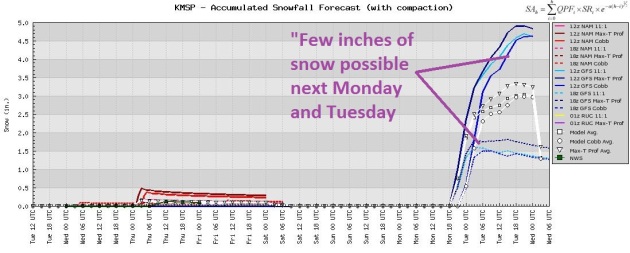 Out On A Limb
. Not exactly Snowmageddon, but if (a huge if)
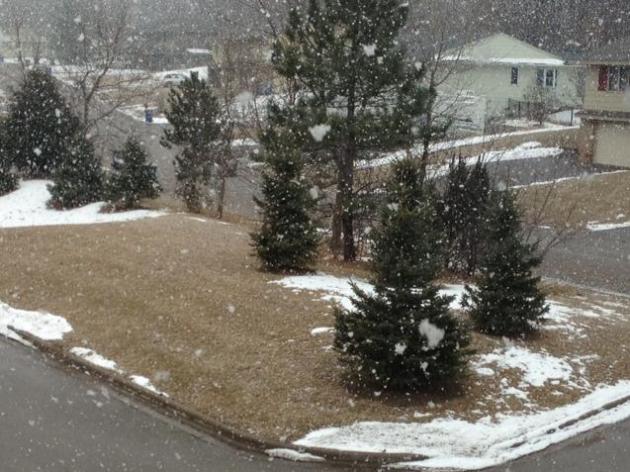
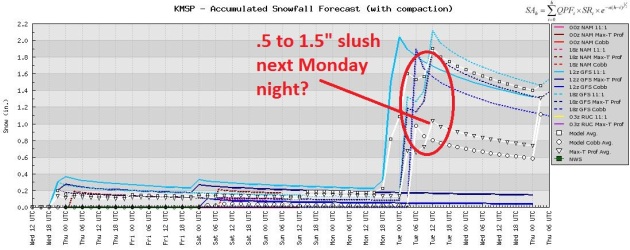
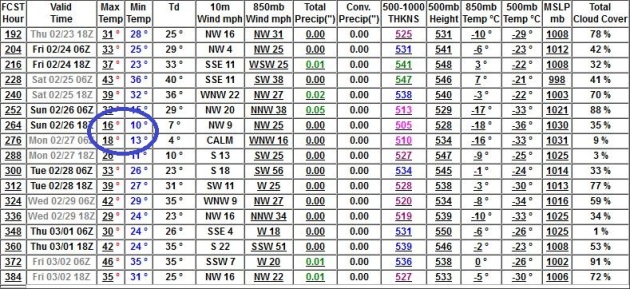
the models are right, we may just see a plowable snowfall early next week, a "few inches". Unlike a January snowfall this will probably be a wet, slushy snow, with temperatures around 30-33 freeways may stay mostly wet and slushy. Pure speculation at this point. No inch predictions yet - it's way too early to even consider that. Let's see if we can go a couple of days with the models in agreement, but (if true) it would be the first semi-significant snowfall since early December!
* Since we're talking about weather models, the (frequently more reliable) European
ECMWF model whisks a weak frontal boundary across the Upper Midwest Monday, hinting at a few light showers of rain or wet snow - but little or no accumulation. That's why I'm not doing cartwheels just yet. Not that I could even if I wanted to.
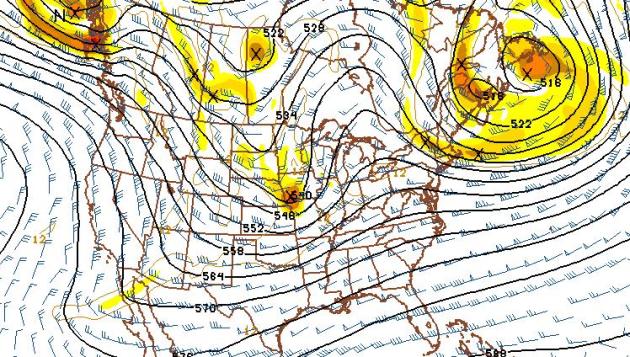 Snowy Blocking Pattern?
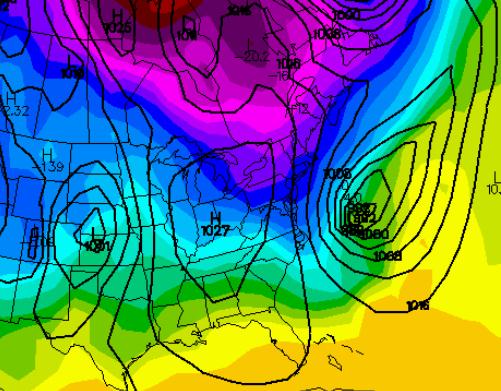
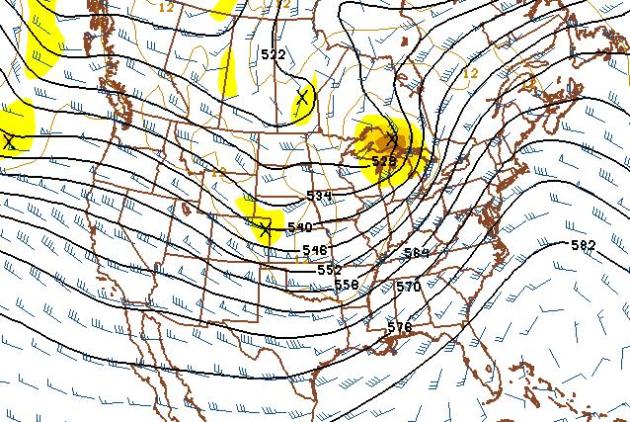
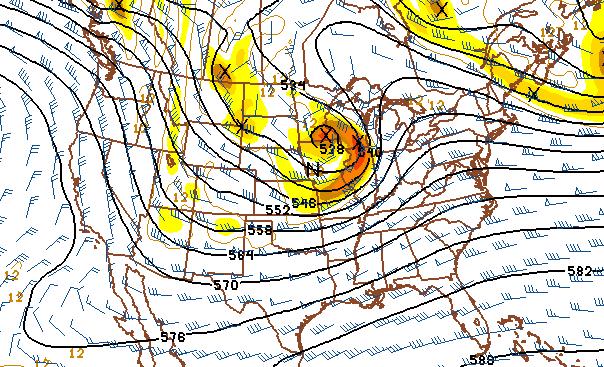
 A possible wrinkle in next week's forecast scenario: a strong storm is forecast to "cut-off" or stall out over the Canadian Maritimes, which may slow down the (much weaker) storm over the Upper Midwest, possibly slow enough to tap some moisture from the Gulf of Mexico. That said, we're not talking about a full-latitude trough, capable of supporting a major storm for Minnesota. We may just wind up a few inches of slush Monday/Tuesday. GFS 500mb forecast above valid next Tuesday morning at 7 am.
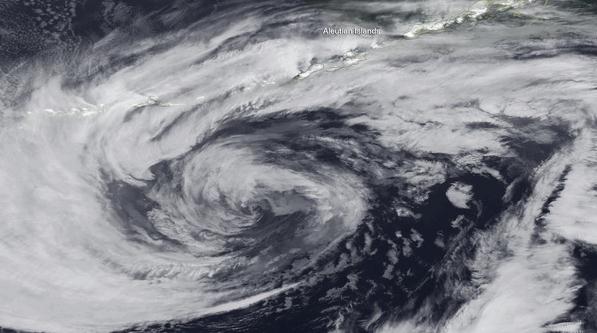
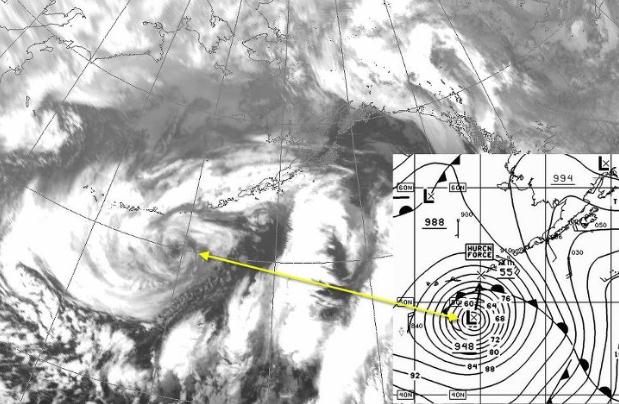
"Hurricane-Force Low Pressure System". The storm off the coast of Alaska had a central pressure of 944 mb Tuesday; that's 27.89" of mercury, deeper than some Category 4-5 hurricanes! Here's the latest from NOAA's NWS Ocean Prediction Center: "
A strong 948mb Hurricane Force low in the North Pacific is headed toward Alaska’s Aleutian Islands, as shown here in GOES Infrared satellite imagery, as well as on the OPC 06Z Surface analysis chart. The OPC’s “Hurricane Season” is nowhere near over as storms like these are common well into the Spring!"
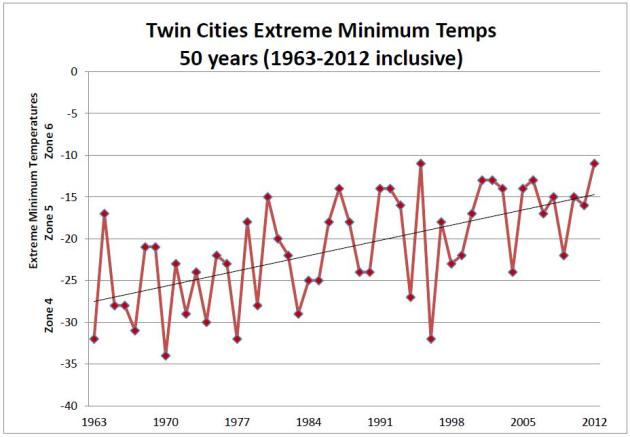
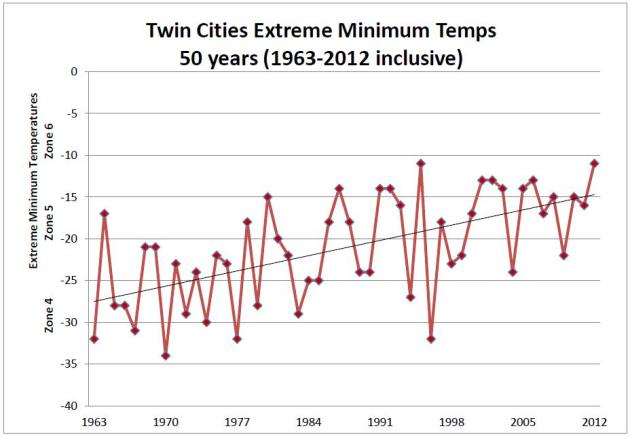
Temperature Trends Since 1963: Less Arctic Air. Is it our imagination, or are we really experiencing less bitter/subzero air in recent winters, especially during the month of December and February? Jack Falker from Edina sent me a PDF of a study he conducted on the new USDA Plant Hardiness Zones, showing a national warming trend in recent decades. "EMT" is extreme minimum temperature. Quite simply Jack plotted the coldest nighttime low observed in the Twin Cities for every winter since 1963. Is this all urban heat island, since the metro has grown in the last 50 years? Falker checked with the Landscape Arboretum in Chanhassen, well away from the core of the metro, which experienced a similar warming trend. He writes: "
To see just how much things have changed in the last ten years, it is very interesting to look at the 50 year period 1963 to 2012 (inclusive), when the average annual EMT was -21.1, ( Zone 4b). But again, the last ten years pull the average, so if you look at the 30 year period 1963 to 1992, you get a better historical picture, with an average annual EMT of -23.4 degrees. What jumps out at you, as you look back at the 1960s and 1970s, is just how much colder it was back then. For example, there was a period in 1970, between January 17th and January 21st when it didn’t go above zero for 4 ½ days, with a low temperature of -34 and a high of -3. Now that was a zone 4 winter! Another thing that jumps out at you is how many -20 degree days occurred in December and February, during those decades. This is something we haven’t seen in several years. Here is a graph of that 50 year period. Notice the upward slope of the graph, right out of Zone 4 into Zone 5."
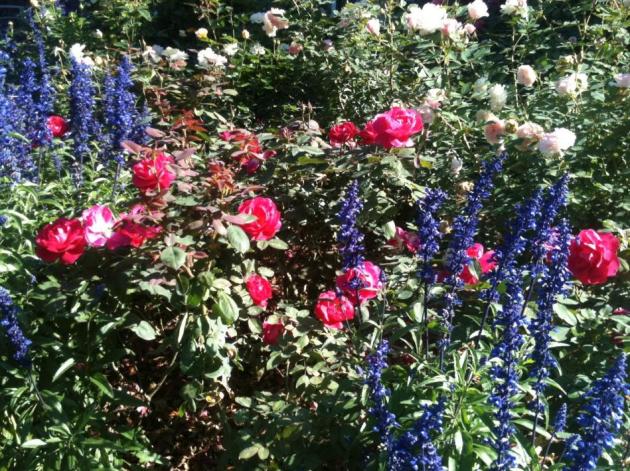
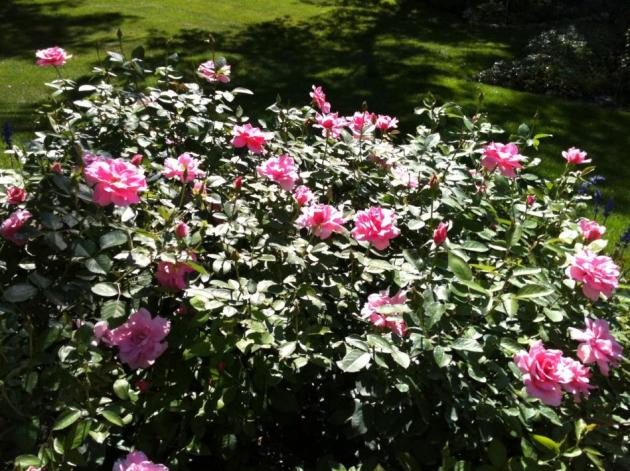
More Details from Jack Falker, a local rose specialist and enthusiast (those are his rose bushes above) who has done extensive research on Minnesota's slowly mellowing winters, and how they're impacting his roses:
"
I wrote my articles for publication in the Twin Cities Rose Club bulletin to alert rose growers that, while we still have plenty of winter in the Twin Cities (this year notwithstanding), our EMTs of the last 10 years don't justify the back breaking work associated with the Minnesota Tip method of winter protection, which entails digging trenches, bending the roses over and covering them with dirt. I contend that any gardener who is paying the least bit of attention to what happens in the both summer and winter can see what's happening around us. Witness the swarms of Japanese Beetles that have inundated us in the last few years. I saw the first one only five or six years ago in the rose garden; this year I killed thousands (literally). That's because our turf temperatures don't go low enough or deep enough to kill off the grubs from which the beetles emerge. The beetles have travelled from the warmer east coast, right across the lower midwest, into the upper midwest, as winter temperatures have moderated. The University of Michigan (my alma mater) published a study a couple of years ago showing that there is a migratory surge of small mammals northward, such that the seeds they carry in their intestines are creating different plant growth further north in the state. We can see it here with the robins, many of which are wintering in southern Minnesota. The ducks and geese don't move as far south as they used to, as well.
Bottom line: Global climate change is a reality; all you have to do is look in the garden and around you generally to see what's happening. I can't fathom the people who want to deny it."
Neither can I, Jack. Appreciate the additional information - wanted to share this with my readers.
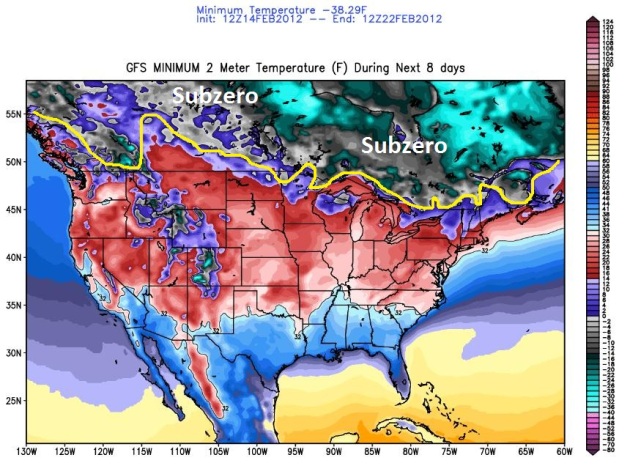
Winter In (Temporary) Retreat. The map above, courtesy of policlimate.com, shows subzero air confined to Canada looking out the next 8 days. A few subzero lows are expected over the Rockies, the Minnesota Arrowhead and a small region of far northern Wisconsin. Other than that, a moderate Pacific flow should linger into much of next week. A turn to cooler weather is still possible at the very end of February.
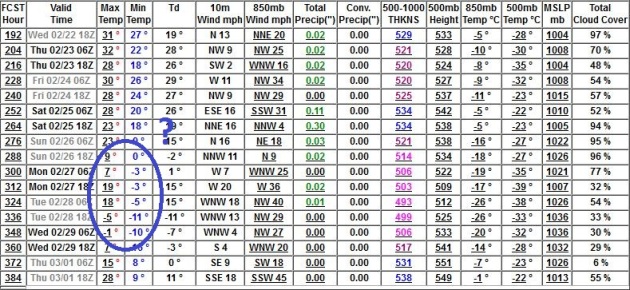 One More Subzero Fling? We've gone a few GFS runs/row showing a big cool-down for the end of February. Nothing etched in stone yet, but there's a growing chance of a couple of nippy days around Feb 27-29, maybe even 1 or 2 more nights below zero. We've only experienced 3 subzero nights so far, the second fewest in modern-day records. I want to see a few more runs - confidence level is still low.
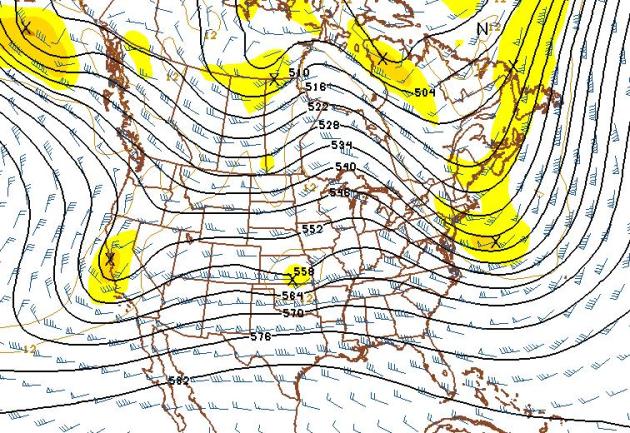 March 1: Zonal Flow.
 The 500mb forecast above (GFS) seems to contradict the previous forecast of possible subzero weather the last few days of February. If this upper level prediction verifies we'll be enjoying 30s, possible 40s the first few days of March - winds aloft howling from Seattle and Portland. Disclaimer:
this is the meteorological equivalent of making sausage - hard to watch. I'm including all these (contradictory) elements to show you the difficulty of long-range forecasting. Which model do you believe, and why? The models are all over the map (literally), and any forecast beyond 4-5 days is more of a wish-cast than a forecast.
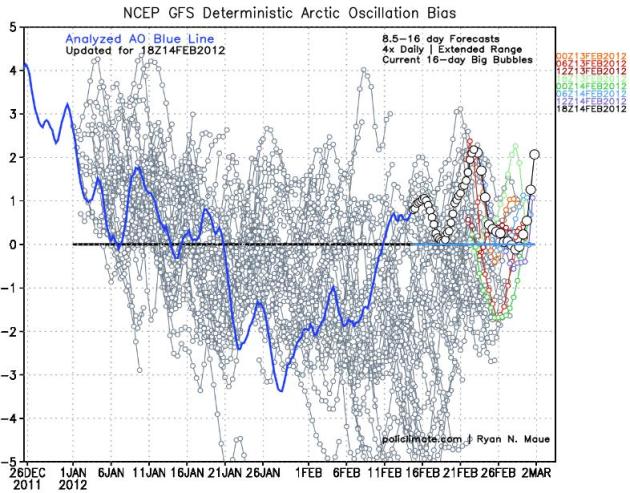 One Reason I'm Doubting The (Subzero) Potential For Late February.
 The AO (Arctic Oscillation) prediction shows positive values for late February. The AO
has been (strongly) positive for much of the winter - meaning unusually strong westerly winds, bottling the coldest air over Alaska and northern Canada. If the AO was predicted to go negative I'd be more confident of bitter air pushing into the lower 48 states. So, to summarize: the models are contradictory about the potential for cold weather the end of the month. Yes, there's a chance of a brief bitter spell, but I'm not convinced. Not yet. Graph above courtesy of
policlimate.com.
Mild Weather Warming Local Budgets. A look at how a lack of snow (or cold) is positively impacting local city budgets around the USA, from KPCC Radio: "
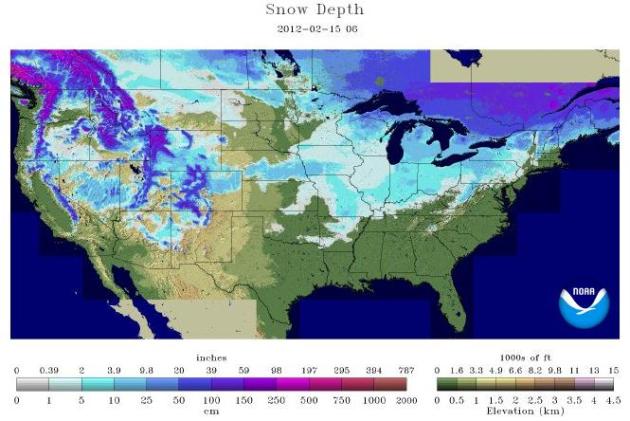
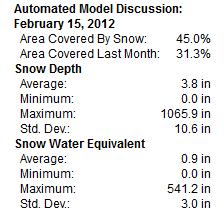
In January of last year, snow blanketed more than 42 percent of the country. Last month, it was just under 13 percent. The warm weather has lowered our heating bills and created a bit of an economic boost. After two brutally long winters, the temperatures this year have been positively balmy. In the Washington, D.C., area, they've hovered in the 50s for much of the past two and a half months. Area landscapers, whose schedules are usually pretty lean this time of year, are busier. Take Chuck Dod Landscaping, which is building a stone wall in the backyard of a home in Mclean, Va. "Most winters, we just plan for downsizing a bit," owner Chuck Dod says. "Normally, we're down to about 40 or 50-percent capacity. This year, we're running 75-80 percent of capacity." Photo: Jeffrey Phelps, AP.
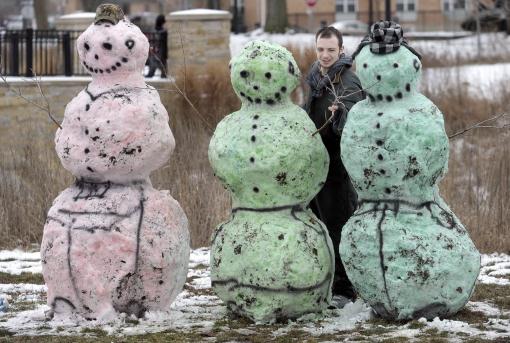
"Dirty Snow-People". Yes, we've become so PC we can't even refer to snowmen. Snow-people. Really? More details: "
Roger Fritsch, Champaign, puts the finishing touches on three snow people, (L-R-himself, his girlfriend and her son) he made for his girlfriend in Scott Park in Champaign, Ill. on Tuesday, Feb. 14, 2012. He finished them off with a bouquet of flowers for Valentines day, and plans to bring his girlfriend back later in the day. (AP Photo/News-Gazette, Robin Scholz)."
Europe's Deep Freeze: Why Climate Change Is Not (Entirely) To Blame. An interesting article in
Time Magazine: "
Back at the beginning of January, I wrote that this season was already shaping up to be season that winter forgot in the U.S. About a month later, that prediction is coming true. The average temperature in the continental U.S. in January was 5.5°F above the 20th century norm, and snow was almost nonexistent — the National Weather Service reported that 157 out of 166 American cities had below-average amounts of the white stuff. The groundhog Punxsutawney Phil may have predicted six more weeks of winter when he popped up from his hole on Feb. 2, but for most of the U.S. winter never really began — and the unusually mild days seemed like a coming attraction for global warming."
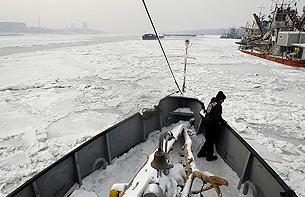
Photo credit above: "
A crew member of an icebreaker looks at the frozen Danube River near the Romanian city of Giurgiu on Feb. 10, 2012. Bogdan Cristel / Reuters."
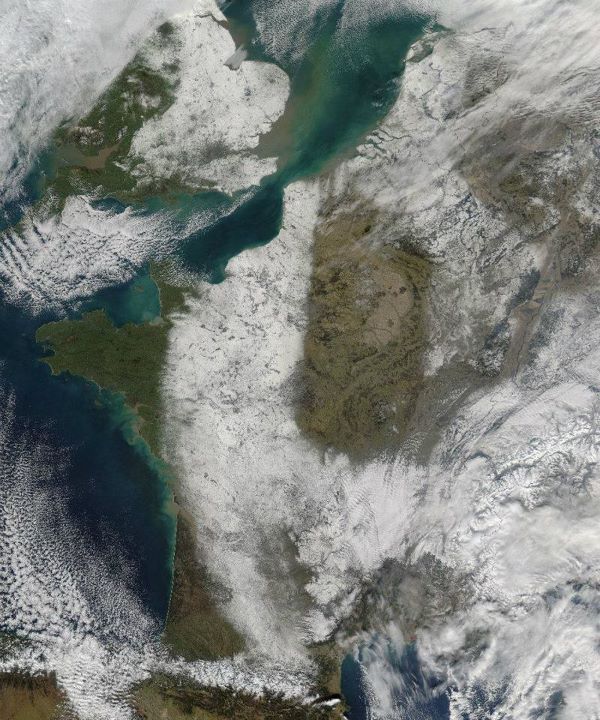
Europe Snow From Space. From the NASA: "
Snowfall over Western Europe: The view from our Aqua satellite on Feb. 11, 2012."
Why Did Europe's Danube River Freeze? The story from
Scientific American: "
Just how extraordinary has this winter been in Europe? The Danube river has frozen, for one. Europeans have been shivering under a blanket of cold air that has sent temperatures plummeting and snows drifting. Across the continent, hundreds have died from exposure to the cold. The Danube's freezing is just one of many severe winter events in the continent this year. Heavy snowfall has blocked roads and stranded towns in central Italy. A train in Montenegro was stranded on the tracks for three days due to heavy snow. Even Venice's famous canals froze, a rare feat."
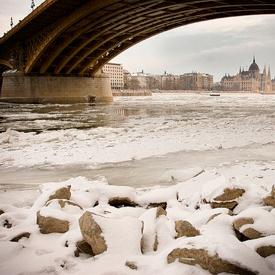
Photo credit above: "
Ice floes on the Danube in Budapest, as seen on Feb. 11, 2012. Image: Flickr/adambotond."
Snow, Ice Bury The Balkans.
USA Today and the AP have the latest on some incredible snowfall amounts from the Balkans into eastern Europe: "
BUCHAREST, Romania (AP) – Snow as deep as 15 feet isolated areas in Romania, Moldova and Albania on Tuesday and turned a power plant in Kosovo into a park of dazzling ice sculptures. In a winter harsher than many can remember, energy workers struggled mightily Tuesday to break the ice that has encapsulated Kosovo's main power station in Obilic. Steam from the plant's vents coated its pipes and buildings with ice and snow, turning them into unworldly, unrecognizable objects of art. Since the end of January, Eastern Europe has been pummeled by a record-breaking cold snap and the heaviest snowfalls in recent memory. Hundreds of people, many of them homeless, have died in the frigid weather and tens of thousands have been snowed in."
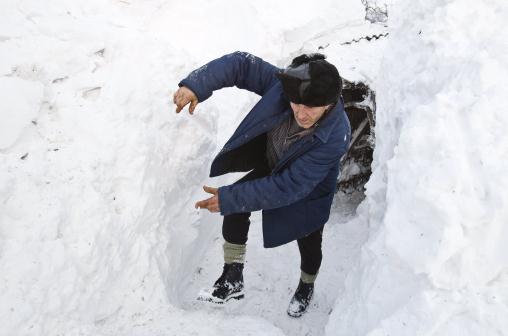
Photo credit above: "
Nicolae Cocioaba, 58, loses his balance walking on a pathway he dug to reach his cattle in the village of Silistea Glodeanu, Romania, Tuesday, Feb. 14, 2012 the day after more snow storms hit the area. Snow as deep as 15 feet (4.5 meters) isolated areas of Romania, Moldova and Albania on Tuesday, and helicopters and army trucks were used to deliver food and medicine, and to transport sick people to hospitals. (AP Photo/Vadim Ghirda)."
A Perfect Storm: What Caused "Snowmageddon"? Here's a terrific explanation of the meteorological events leading up to the massive storm that shut down the northeast in February, 2010, from
Science 2.0: "
You've heard or at least read about the pledge of the United States Postal Service: "Neither rain, nor snow, nor sleet, nor hail shall keep the postmen from their appointed rounds." Well, that was before government workers had a union because today they quickly note that unshoveled snow, icy sidewalks, or snow plowed up against mailboxes are all exempt from that credo. But in February of 2010 they had a good excuse for suspending service. The National Weather Service reported that three storms spanning from December to February in the winter of 2009-10 had dumped a whopping 54.9 inches of snow on the Baltimore-Washington area and the first 10 days of February were among the worst." Photo credit:
sewtrashy.com.
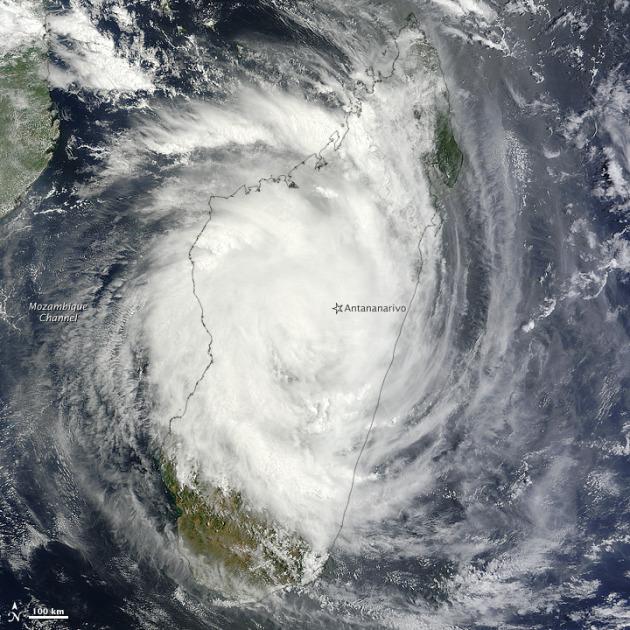
Madagascar Hit By Cyclone Giovanna. The
BBC has the details: "
A tropical cyclone has hit the island of Madagascar, with winds of up to 194km/h (120mph) ripping up trees and electricity pylons. At least two people have been killed by Cyclone Giovanna, and there are reports of up to five deaths. Head of the charity Care told the BBC that 60% of homes in one eastern town had either been damaged or destroyed. Meteorologists warn the damage may be as bad as in 1994, when a cyclone killed 200 people and displaced 40,000."
Giovanna Imagery. NASA's
Earth Observatory has high-resolution imagery and more information on Giovanna: "
Tropical Cyclone Giovanna came ashore in eastern Madagascar as a powerful storm, ripping roofs off houses, downing trees, and cutting power to the capital city of Antananarivo, news reports said. At least one person had been killed. As predicted, the storm weakened after making landfall. By the afternoon of February 14, 2012, wind speeds had dropped to 35 knots (65 kilometers per hour), according to the U.S. Navy’s Joint Typhoon Warning Center (JTWC). This was down from 125 knots (230 kilometers per hour) the day before."
How Vulnerable Is New York City To Severe (Coastal) Flooding? Here's a report from
NRDC, the National Resources Defense Council, summarizing recent research into the potential for storm (surge) flooding in New York City. Here's a tip: looking for investment ideas? Consider companies that build dikes and levees, the same technology that has reclaimed much of the Netherlands from the North Sea. It's only a matter of time before some of that same technology is needed here in the USA: "
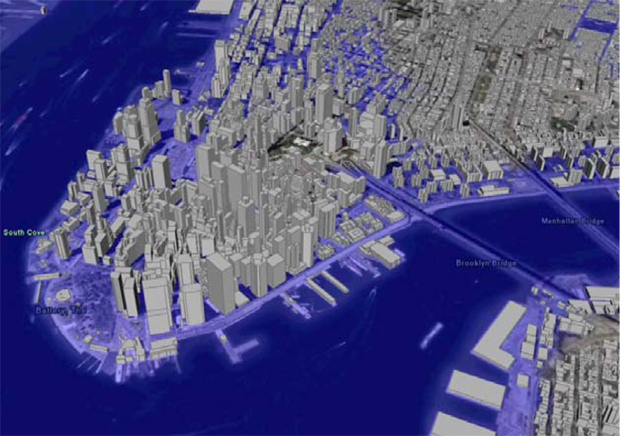
Hurricane Irene caused extensive flooding, power outages, and property damage throughout the Eastern Seaboard and into Vermont, killing at least 44 people in 13 states. Many commentators called it a 100-year storm. New research shows that flooding like what we saw from Irene could become a much more regular occurrence as our climate changes and sea levels rise. The study conducted by Ning Lin and Kerry Emauel of MIT with Michael Oppenheimer and Erik Vanmarcke of Princeton focused on the risk of flooding in New York City. The researchers simulated 5000 storms under historic climatic conditions to develop a flood risk baseline. They then simulated another 5000 storms under conditions expected if carbon pollution continues to accumulate in our atmosphere unchecked, changing our climate and raising sea levels. Their conclusion is well summarized by the headline in the MIT News story about the study: ‘Storm of the Century?’ Try ‘Storm of the Decade.’ Specifically, the study found that a storm surge of 5.7 feet or higher, which currently occurs an average of once every 100 years, would occur once every 3 to 20 years due to the effects of heat-trapping pollution. Given that the sea walls protecting lower Manhattan are only about 5 feet tall, this means the city has a lot of work to do if it is to minimize the damage." Worst-case storm surge simulation image above courtesy of
transporationnation.org.
* MIT has more on the new paper focused on flooding in Lower Manhattan
here.
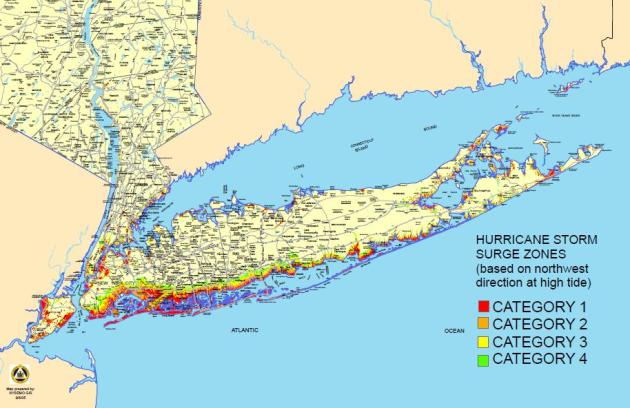
Storm Surge Potential. Long Island is most exposed to high waves generated by hurricanes or nor'easters. Suny Suffolk has a high-resolution map showing Long Island's most vulnerable communities
here.
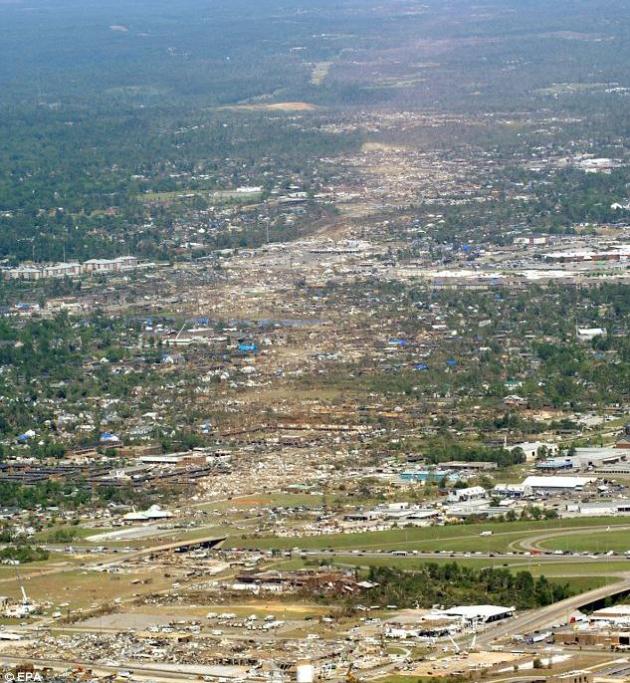 Scientists A Step Closer To Predicting Tornadoes
. A one-month lead time predicting when atmospheric conditions might be ripe for tornadoes (sufficient shear, instability, low-level moisture, etc)??
USA Today has the details: "
In the new study, Tippett and his team looked at 30 years of past climate data. They used computer models to determine that the two weather factors most tied to active tornado months and seasons were heavy rain from thunderstorms and extreme wind shear (wind blowing from different directions at different layers of the atmosphere). "If, in March, we can predict average thunderstorm rainfall and wind shear for April, then we can infer April tornado activity," Tippett says. The method worked for each month except for September and October, and it worked best in June." Photo: EPA.
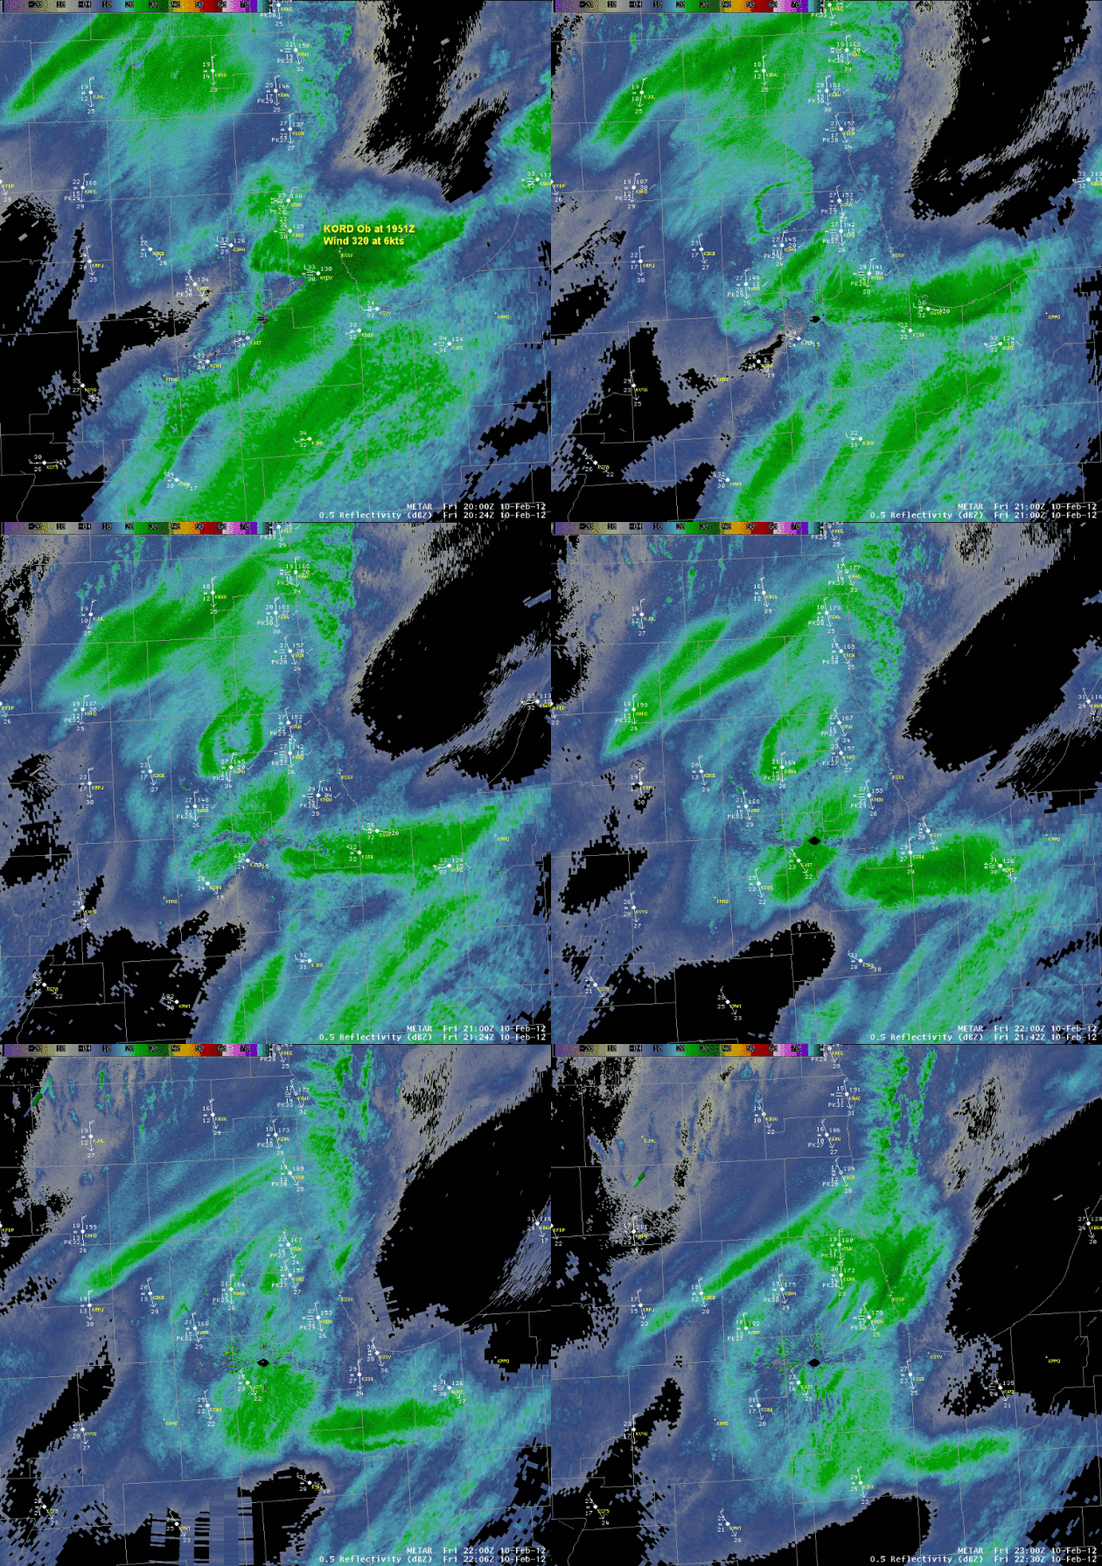 O'Hare Holding Pattern Shows Up On Doppler Radar.
 The new generation of Doppler is so sensitive it can pick up dust, even insects. Airplanes show up as well, as they did during last Friday's snow event. Look for the donut-shaped swirl near the center of the screen, created by jets holding above ORD. More from the
Chicago office of the NWS: "
You may have noticed this on the Chicago-Romeoville WSR-88D Doppler radar Friday afternoon, February 10, 2012, between 230-400 PM CST. An unusual "halo" in radar imagery developed in the vicinity of O'Hare International Airport...roughly in the middle of the image loop below. The winds at KORD up through about 200 PM CST were light and from the northwest (320 degrees) at less than 10 knots. The cold front came through and winds turned to the north-northeast at 20 mph with gusts to around 30 mph. Air traffic controllers probably had to reconfigure the runways and put some aircraft in a holding pattern. A circular pattern became evident for a time in the radar display to the north-northwest of KORD. We've seen this before where the exhaust particles from the aircraft feed/seed the clouds and coalescence accelerates, resulting in the development and fallout of ice crystals. Doppler radar can detect these ice crystals along with precipitation."
Kenya: Traditional Weather Prediction Incorporated Into Forecasts. I've always said that farmers and pilots are some of the best weather forecasters around. They have to be to make a profit (farming) or stay alive (aviation). Here's an interesting story from
allafrica.com describing how African forecasters go beyond traditional computer models to predict local weather:
"In Essong'olo village, some 32 km west of Kenya's Kisumu city, Japheth Olukune Akhati and his neighbours are busy tilling their small plots of land in preparation for planting. It hasn't rained for a few months here, and the skies are still azure blue. But thanks to traditional knowledge, the farmers know it might rain in three weeks' time, and they want to be ready. Kenyan farmers like these have relied on indigenous forecasting methods through the generations. Some fear these methods will be made redundant by more extreme and unpredictable weather linked with climate change. Others say they remain valuable tools - especially when used in conjunction with modern science. The Kenya Meteorological Department is one organisation that thinks ancient practices have something to offer. Based on the findings of a study released in April 2010, it now blends traditional forecasts with science-based predictions to produce more accurate - and more well-received - weather and climate data at the local level in western Kenya." Photo: kenya-advisor.com.
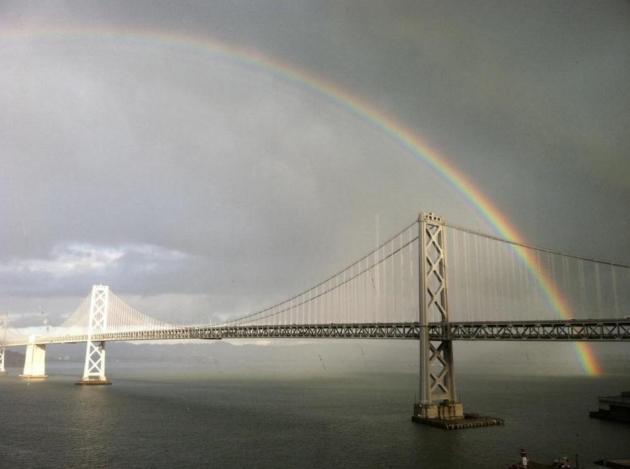
Photo Of The Day. Kudos to James Mastromarino for capturing a terrific photo of a rainbow over the Golden Gate Bridge in San Francisco. Very nice. Photo courtesy of Earth Networks.
Will Hurricanes Topple U.S. Wind Turbines? The story from
The New York Times:
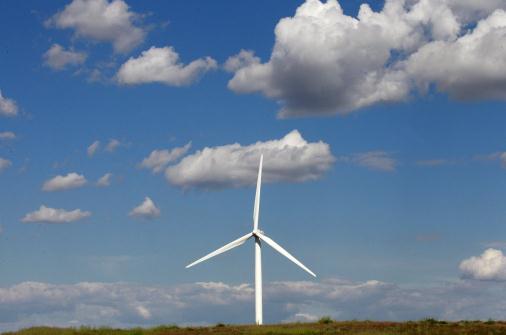
"As plans for wind farms rising out of the ocean along the Atlantic and Gulf coasts inch closer to fruition, a new study from Carnegie Mellon University suggests that hurricanes could destroy a significant number of turbines in some of these areas, even coming close to wiping them out. Although turbines are designed to both harness and withstand the forces of wind, they can be severely damaged by too much of it. In the United States, Europe and Asia, turbines have caught fire, blades have shredded and towers have crumpled when hit by stormy gales." File photo: Rick Bowmer/AP.
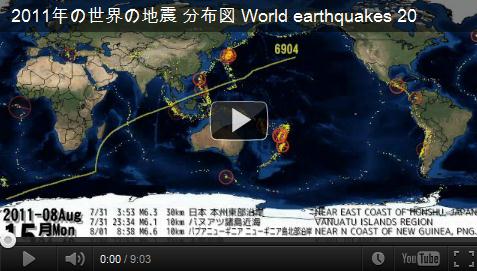
One Year Of Quakes. Here's an interesting
video timelapse, courtesy of PBS, USGS and monoroch.net: "
We recently stumbled on this animated map that plots all of 2011's earthquakes that registered above magnitude 6. Each circle represents an earthquake -- the bigger the circle, the greater the magnitude. The line across the circle indicates the quake's depth. Most notable are the images that overwhelm the map on and just after March 11, when Japan's magnitude-9.0 Tohoku earthquake and resulting aftershocks struck, unleashing a devastating tsunami that erased towns and caused a nuclear accident at the Fukushima Daiichi plant."
How Jimmy Kimmel Earns Nearly $2 Million Annually From YouTube.
Mashable.com has the details: "
Nighttime talkshow host Jimmy Kimmel is the latest mainstream performer who’s found it possible to make a mint without solely relying on traditional broadcasting and promotional channels. His solution? YouTube. Kimmel’s channel, called JimmyKimmelLive, features clips and recaps — typically running under five minutes each — from every episode of the comedian’s popular late-night talkshow. Kimmel’s channel has more than 300,000 subscribers and many of the videos have acquired millions of views on top of his substantial broadcast television audience on ABC."
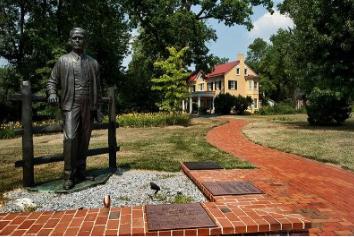 Where The "One Percent" Live: The 15 Richest Counties In The USA
. Loudoun County, Virginia #1? Yep, I was a bit surprised, although the suburbs of Washington D.C. are pretty amazing. All that government cash sloshing around. The Street and
Businessinsider.com have more details:
Median household income: $119,540. With a median household income that is a full $16,000 higher than our second-place finisher, Loudoun county has trounced the competition on its way to becoming the richest county in America. Another county surrounding our nation's capital, Loudoun borders West Virginia and Maryland and is the home to Washington Dulles International Airport. The Appalachian Trail runs along its western border and the area was
largely an agricultural community until the airport was built in the 1960s.
WFAA-TV Anchor Freaks Out, Mistaking Video Cable For Snake. From
TVSpy.com and NewsBlues: "
WFAA morning show host Paige McCoy Smith flipped out during a recent segment featuring snakes, when a member of the crew snuck up behind her and dropped a video cable on her shoulder. [h/t NewsBlues]"
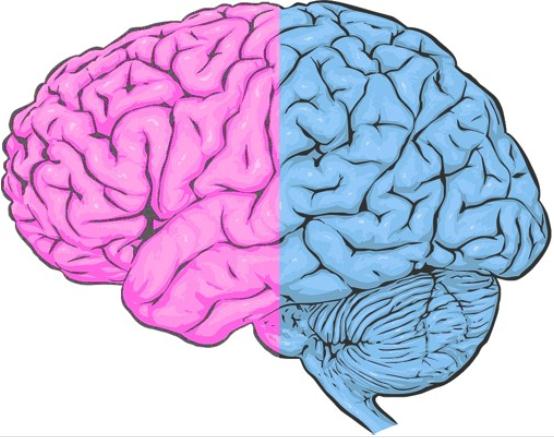 Falling In Love Is All In Our Brains
. An intriguing story from
The Washington Post: "
This Valentine’s Day, as our collective thoughts shift to tender cards, heart-shaped chocolates, overpriced bouquets and other extravagant gestures of love, I can’t help but wonder what really attracts us to one mate over another. Is it hot sex? Fairy-tale romance? Destiny? Or are we merely at the beck and call of our hormones and brain circuitry? Online dating sites trumpet their knack at identifying “chemistry,” but it turns out that basic biology may play at least as strong a role in love as do socialization, environment, fate and other factors. “We like to feel independent and free of the brain systems that regulate the mating habits and regimens of animals, but the fact is that we’re not,” says neuroendocrinologist Tom Sherman, an associate professor at Georgetown University School of Medicine."
Paul,
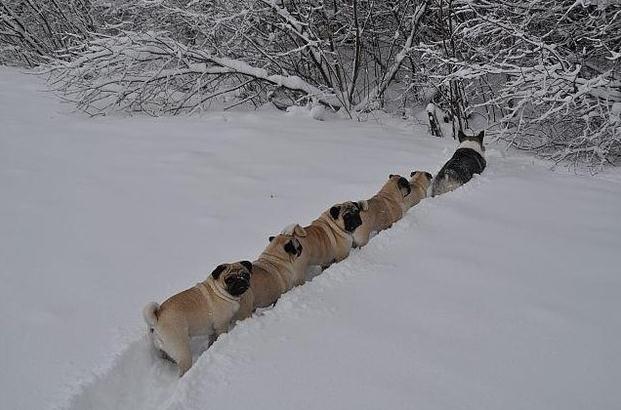
I love the picture of the dogs, but … I think the dog at the front is a Pembroke Welsh Corgi . If you compare the size of the body to the Pugs, and consider the height of the dog to the Pugs, there is no way that could be a standard Collie. (If you look close, you will also see there is no tail on the dog in the lead, either). As for where they are going? Probably look for a place where the snow is shallow enough to “do their business”
- Dennis Mosman
Hi Dennis-
I stand corrected on the dog front. Not sure where I got "collie" out of that, but I'm glad you weighed in and set the record straight. This is (still) one of the funnier pics I've seen so far this year. Thank you for giving me an excuse to show it again!
Ask Paul. Weather-related Q&A. To submit a question click here.
"
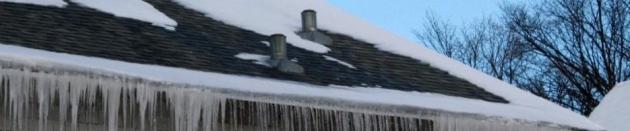
With the lack of snow are our house roofs safe from ice build-up? Or is the one month we have left for snow/thaw/freeze enough to do damage? Thank you for all your work, it is appreciated." - Irving Kellman
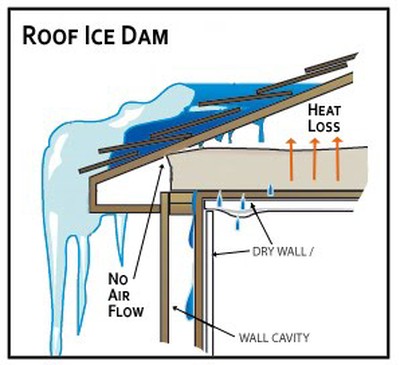
Irving - the freeze/thaw cycle is coming early this year; the pattern we're in now is more typical of the first or second week of March. Although we can't entirely rule out problems with ice-dams in the coming weeks, there's a direct correlation between the amount of snow, and the potential for costly ice dams. There's simply no snow to melt on most rooftops, and unless we see a couple of big snowstorms in the weeks ahead, the risk should be significantly less than the previous 2 winters. It's a little early to let our guard down, but I don't think it will be nearly as problematic as previous winters.
The Mechanics Of Ice Dams. For more than you ever wanted to know about ice dams click here, graphic courtesy of
icedamprevention.org.
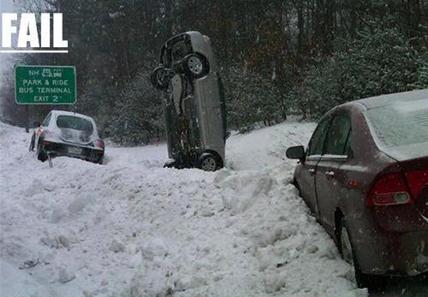
How On Earth... Nice face-plant (the driver walked away from this, thanks to seat belts and air bags). Photo courtesy of
failblog.org.
"
The Master in the art of living makes little distinction between his work and his play, his labor and his leisure, his mind and his body, his education, his love, and his religion. He simply pursues his vision of excellence in everything he does, leaving others to determine whether he is at work or at play." - Zen Wisdom.
Fewer Ice Dams?
Another silver lining to our snow-less winter: a lower risk of ice dams in coming weeks. The potential for ice dams correlates with the freeze thaw cycle (which peaks in March, but it's coming early this year) and the sheer amount of snow on your roof - which is less than any winter since 1931. No, I don't remember back that far, either.
It may be more of a wish-cast than a forecast, but the GFS model prints out a few inches of snow early next week. It's possible, but I'm skeptical. It's been a winter of false-alarms, so I'm not ringing the weather-gong just yet.
Long-range forecasts have been even trickier than usual this winter; a 10-20% increase in jet stream wind speeds creating even more instability, making an extended outlook very difficult. It's too early; tomorrow's run may push the storm track south, or weaken it dramatically.
The coldest temperature KMSP has seen this winter is -11, continuing a trend. Jack Falker, who grows and winter-protects more than 100 roses and other perennials in Edina, started analyzing Minnesota Climatology statistics several years ago when he realized he hadn’t seen a “real winter" in 10 years. What he found is that average annual extreme minimum temperatures (EMT) in the Twin Cities have changed from the usual -25 to -30 degree norms to a new average range of -15 to -20 F over the last 20 years. "Winters of the last 10 years look more like Chicago or Detroit than what we were used to in the Twin Cities".
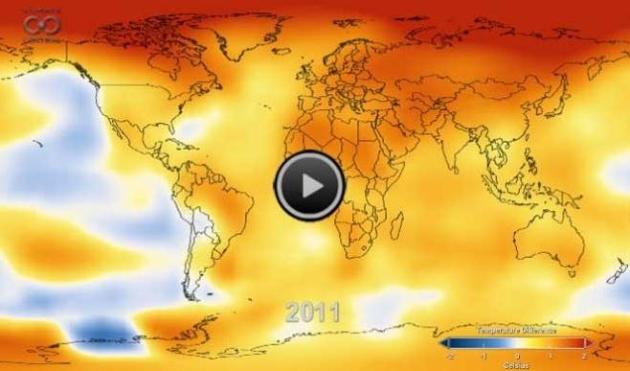
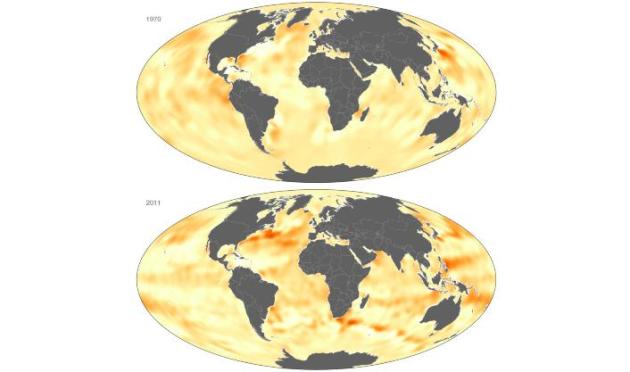
Yes, we're seeing a slow warming trend, especially at night, during the winter months, but don't write off snowstorms just yet.
Climate Stories...
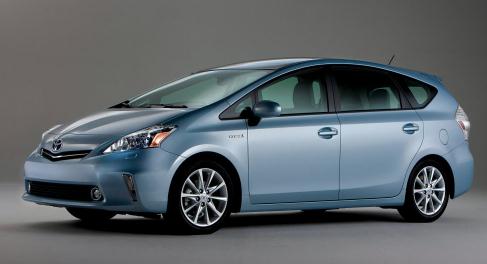 Can A Prius Increase Global Warming?
 Say what? Not sure about this one. The author's point is that any savings from driving EV's will be more than offset because consumers will
drive more. Strange logic. This will get Prius-owners fuming, but hold off judgement until you read this article in
The Christian Science Monitor: "
Hybrid cars, fast trains, compact florescent light bulbs, solar panels, carbon offsets: Everything you've been told about living green is wrong. The quest for a breakthrough battery or a 100 mpg car are dangerous fantasies. We are consumers, and we like to consume green and efficiently. But David Owen argues that our best intentions are still at cross purposes to our true goal - living sustainably and caring for our environment and the future of the planet. Efficiency, once considered the holy grail of our environmental problems, turns out to be part of the problem. Efforts to improve efficiency and increase sustainable development only exacerbate the problems they are meant to solve, more than negating the environmental gains. We have little trouble turning increases in efficiency into increases in consumption."
What Do New Findings On Ice Melt And Sea Level Rise Mean? Some answers from Andrew Freedman, a meteorologist at the Washington Post's
Capital Weather Gang: "
A new study on how quickly Earth’s glaciers and ice caps are melting - a crucial piece of the sea level rise puzzle - has received quite a bit of press attention during the past week, some of it rather misleading. While the paper (technically a letter) published in the journal Nature, concluded that glaciers and ice caps worldwide lost about 4.3 trillion tons of mass between 2003-2010 - enough to cover the entire United States with water 1.5 feet deep, according to NASA - there were some regions where glaciers and ice caps did not lose as much ice as previously thought."
Photo credit above: "
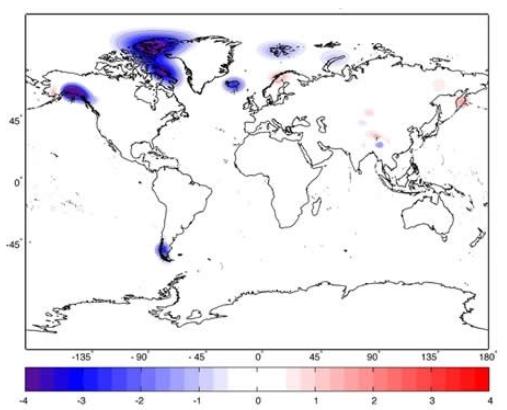
Changes in ice thickness (in centimeters per year) during 2003-2010 as measured by NASA's Gravity Recovery and Climate Experiment (GRACE) satellites, averaged over each of the world's ice caps and glacier systems outside of Greenland and Antarctica. (NASA/JPL-Caltech/University of Colorado.)"
Climate Lessons From Last Year's Storms. Here's an excerpt of a story from
Vermont Public Radio: "
Climate scientists have said that the major weather events in the last year give Vermonters an idea of what the future effects of global warming may bring to the state in the coming decades. Meanwhile the Agency of Natural Resources has been working across its departments to highlight ways the state can prepare for and avoid the effects of climate change. On the next Vermont Edition, we talk Justin Johnson, deputy commissioner of Environmental Conservation, and Kari Dolan, manager of the Ecosystem Restoration Program, about what Irene and other storms have taught the state's Climate Change Team about resiliency and adapting to a changing climate."
Photo credit above: "
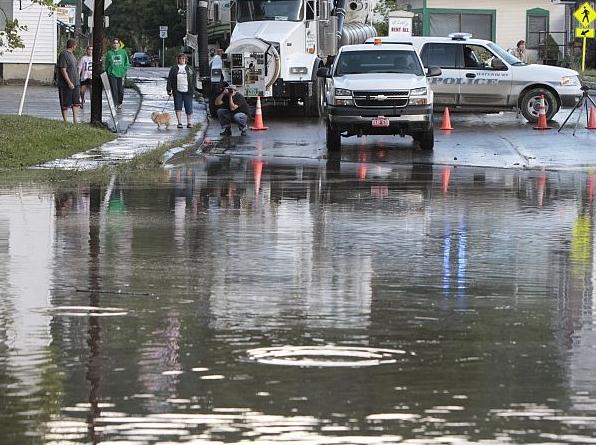
Downtown Waterbury in the aftermath of Tropical Storm Irene in August. The state's Climate Change Team says that Vermont will get more extreme rain events in the future, and "flood resiliency" may be critical to adapting to climate changes."
Climate And The Rising Threat Of Hurricane Floods. The story from
Forbes.com: "
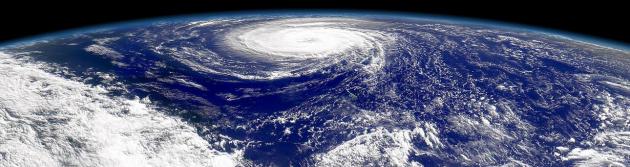
One of the more obvious fallacies of modern life is that the future will be like the past. As if various cultural, economic and technological changes weren’t disproving that every day. But it’s even harder to accept that the planet earth itself is changing quite rapidly due to warming temperatures, and with that our surroundings. More heat in the atmosphere is likely to cause (and arguably is already causing) more extreme weather events, including intense heat, cold, droughts, floods, and storms. Problem is, governments and other institutions are built on the same set of “future = past” expectations, and when “future ≠ past”, very bad things can happen." Image above of Hurricane Denny courtesy of NASA.
Climate Change, Nothing New? How Has Earth's Temperature Changed In The Past? ThomasNet has the details: "
Time scale presents one of the big challenges when discussing the science around climate change. Climate change can take place in the short time frame, say decades; in the medium time frame, say hundreds or thousands of years, and in the very long time frame, say tens of thousands or hundreds of thousands or even millions of years. Some critics of human-caused global warming raise the objection that Earth’s climate has always changed and that, even if global temperatures are rising, that’s probably just a result of natural cycles rather than greenhouse gas emissions. Look at the Medieval Warm Period! Look at the Little Ice Age! And wasn’t the Earth pretty hot when the dinosaurs were around? So the thinking person wonders: How has Earth’s temperature changed throughout the ages? And how do past temperatures compare with what we experience today?"
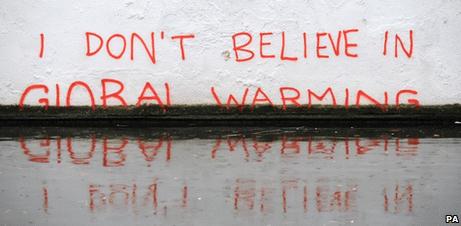
 Heartland Institute Exposed: Internal Documents Unmask Heart Of Climate Denial Machine
. From
desmogblog.com: "Internal
Heartland Institute strategy and funding documents obtained by DeSmogBlog expose the heart of the climate denial machine – its current plans, many of its funders, and details that confirm what DeSmogBlog and others have reported for years. The heart of the climate denial machine relies on huge corporate and foundation funding from
U.S. businesses including Microsoft, Koch Industries, Altria (parent company of Philip Morris)
RJR Tobacco and more. We are releasing the entire trove of documents now to allow crowd-sourcing of the material. Here are a few quick highlights, stay tuned for much more.
- Confirmation that Charles G. Koch Foundation is again funding Heartland Institute’s global warming disinformation campaign.
Greenpeace’s Koch reports show the
last time Heartland received Koch funding was in 1999.
The
January 2012 Confidential Memo: 2012 Heartland Climate Strategy states:
“We will also pursue additional support from the Charles G. Koch Foundation. They returned as a Heartland donor in 2011 with a contribution of $200,000. We expect to push up their level of support in 2012 and gain access to their network of philanthropists, if our focus continues to align with their interests. Other contributions will be pursued for this work, especially from corporations whose interests are threatened by climate policies.”
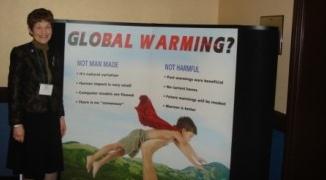 Heartland Documents Reveal Fringe Denial Group Plans To Pursue Koch Money, Dupe Children and Cultivate Revkin
. Details from
Think Progress: "Racing around the internet are some internal documents that appear to be from the Heartland Institute, a relatively obscure hard-core anti-science think tank. As DeSmogBlog
explains, “An anonymous donor calling him (or her)self ‘Heartland Insider’ has released the Heartland Institute’s budget, fundraising plan, its Climate Strategy for 2012 and sundry other documents (all attached) that prove all of the worst allegations that have been levelled against the organization.” Personally, I was skeptical of these docs, at least until I read the
2012 Fundraising Plan, which attacks the temperature station data of the “the National Aeronautics and Atmospheric Administration (NOAA).” That kind of error is classic Heartland."
Shark Attacks Double As Tourism, Global Warming Bring Migration Changes. Details from
The Australian:
"SHARKS killed twice as many swimmers and surfers last year than in 2010, with the increase due largely to a growth in tourism and changing shark patterns due to global warming. There were 12 deaths in 46 shark attacks in 2011, a mortality rate of more than 25 per cent compared to an average of under seven per cent in the last 10 years, according to statistics from the University of Florida. Countries that recorded shark attack deaths included Australia with three fatal out of 11 attacks; South Africa, two fatal out of five; the French island of Reunion, two deaths in four attacks; and Seychelles with two attacks both ending in death." (AP Photo/Institute for Ocean Conservation Science/Matthew D. Potenski)