Sunday, November 3, 2013

Midwestern Slush-Storm Brewing (winter awareness tips)


What Did You Eat?

My niece, Anna Ball, just got back from an extended stay in Italy. She told me locals don't greet each other with "How are you?" They ask "What did you eat?" Life revolves around food. Can't remember?

"If you can't remember what you ate it must not have been very good" Anna told me.
I'm lobbying St. Paul to replace "What do you think of this weather?" OK, don't hold your breath.

What may be our first accumulating snow event of the winter season may materialize from a sloppy southern storm; a cold rain Tuesday afternoon changing to wet snow Tuesday night.
Ground temperatures are still fairly mild, so I expect some melting on contact, but a few inches could pile up on metro lawns; roads becoming slushy and slick after 7 PM. The ECMWF (European) model prints out 6+ inches for southwest counties.

And so it begins.

This is just Old Man Winter firing a warning shot across our bow. After a couple days in the 30s midweek we thaw into the 40s; I could see a few days above 50F next week. No sign of anything frigid just yet.

A puff of cooler air sparks a few rain showers today. Within 36 hours there will be no doubt in your mind that it's November.

What DID I eat? I'd rather focus on food.
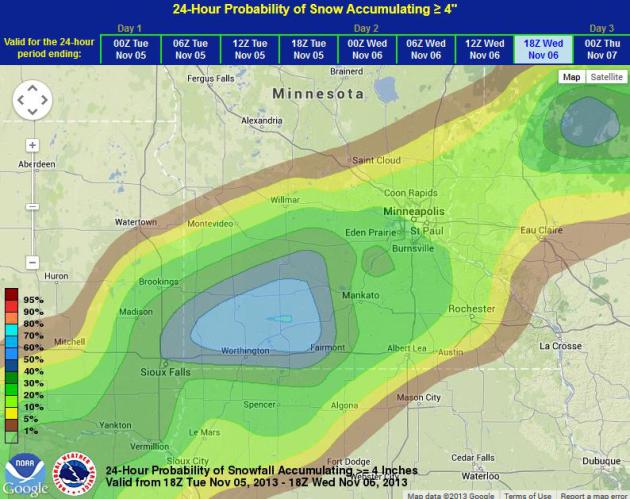
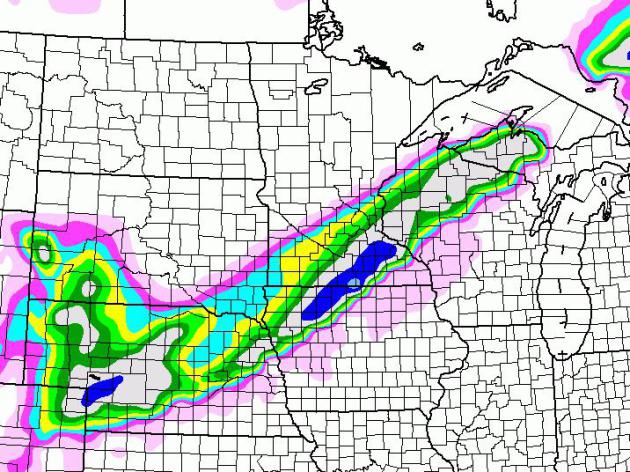
Probability Of 4"+ Snow. The best chance of plowable snows will come over southwestern Minnesota, a 50-60% probability of 4" or more, based on NOAA guidance, compared to a 20-30% risk over the Twin Cities.

NAM Solution. I'm not buying this solution (yet). I want to see a few more runs before I start attaching inch amounts to any Twin Cities forecast, but the greatest potential for enough snow to shovel and plow (?) will probably come south of the Twin Cities. Map above: NOAA.

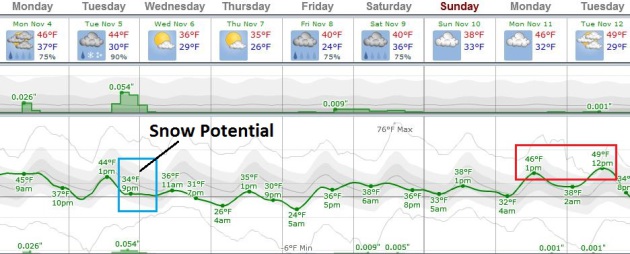
Chilly Week - Some Moderation Next Week. ECMWF guidance keeps highs in the 30s Wednesday and Thursday; highs near 40F over the weekend, then well into the 40s a week from now. Precipitation tomorrow starts as rain, with a probable changeoever to wet snow Tuesday night. A light rain-snow shower mix is possible late Friday into Saturday with little or no accumulation. Graph: Weatherspark.


Winter Hazard Awareness Week In Minnesota. Map above shows average annual snowfall for Minnesota, courtesy of the Twin Cities NWS. Here's an excerpt of some good (timely?) information from the local National Weather Service office: "During Winter Hazard Awareness Week the National Weather Service, in cooperation with the Department of Homeland Security and Emergency Management will issue daily statements pertaining to winter safety. These statements are available below, and will also be broadcast over NOAA All Hazards Weather Radio and sent over the NOAA Weather Wire.

In summary, we offer these basic reminders:
Winter Weather Preparations
  • Keep ahead of the winter storm by listening for the latest weather statements, watches and warnings.
  • Your vehicle should also be ready. Get it winterized, before the onset of winter weather.
  • Be equipped for the worst. Carry a winter survival kit in your car, especially when traveling in rural or open areas. Try to travel with others.
When Driving
  • Yield to snowplows, and give them plenty of room to operate.
  • If your vehicle becomes stranded, stay with it until help arrives.
  • Do not try to walk for help during a blizzard, you could easily become lost in the whiteout conditions.
Outdoor Activities
  • If you will be outside during storms or extreme cold, dress in layered clothing and avoid overexertion.
  • Do not kill yourself shoveling snow. Shoveling is very hard work and may induce a heart attack.
  • If you will be snowmobiling, avoid alcohol. Most snowmobile deaths are alcohol related. Take a snowmobile course offered by the DNR or check with your snowmobile dealer.
  • Every year, there are fatalities in Minnesota when people fall through thin ice.


Snowfall Last Winter. Nearly 68" of snow fell last winter, most of it during the latter half of winter (well into "spring"). The odds of this happening two winters in a row? Slim, but not zero. With any luck we won't be shoveling in May of 2014. Map above courtesy of the Twin Cities National Weather Service.
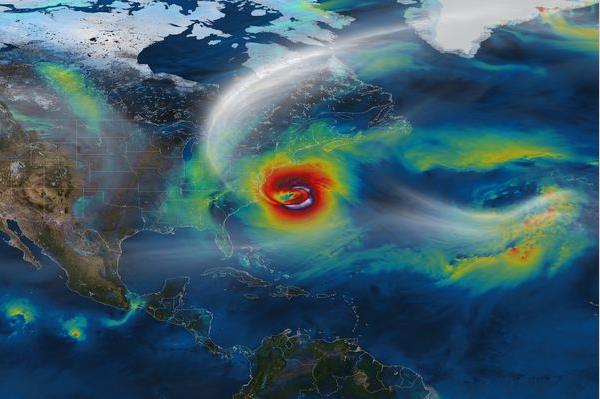
Hurricane Sandy One Year Later: 10 Places That Are Still Suffering. Rolling Stone has the update; here's an excerpt: "One year after Hurricane Sandy ravaged the Northeast coast, some of the hardest-hit communities continue to struggle with the storm's damage. Many of the areas most devastated by Sandy were home to low-income people who are now homeless. Even when families evicted by the storm have found somewhere safe to stay, they are frequently forced to bunk up with other families or sleep on the floor. Others hit the dunes. Making matters worse, winter is fast approaching. In New York City, families that were already vulnerable to the housing crisis now face incredible burdens to finding affordable shelter in their communities. "Sandy was extremely devastating, but it actually uncovered and brought to light an already existing problem, which was a lack of affordable housing," says Ismene Ispeliotis, executive director of the Mutual Housing Association of New York. "Now you have hundreds and thousands of additional families going into the shelter system and burdening available housing..." (Image: NASA).

Obama Signs Order On Response To Weather Disasters And Climate Change. Here's a clip from an article at The Washington Post: "A year after Hurricane Sandy devastated the East Coast, President Obama signed an executive order Friday to make it easier for states and local governments to respond to weather disasters. The executive order establishes a task force of state and local officials to advise the administration on how to respond to severe storms, wildfires, droughts and other possible effects of climate change. The task force includes governors of seven states — all Democrats — and the Republican governor of Guam, a U.S. territory. Fourteen mayors and two other local leaders also will serve on the task force. All but three are Democrats..."
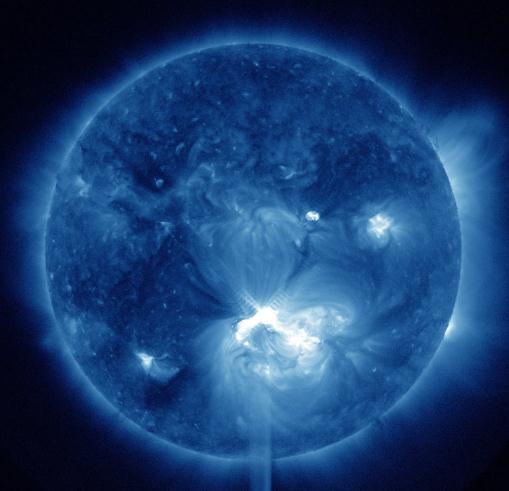
Solar Activity Heads For Lowest Low In Four Centuries. No, it's not the sun heating things up (that's the first thing climate scientists analyzed). Here's an excerpt from New Scientist: "The sun's activity is in free fall, according to a leading space physicist. But don't expect a little ice age. "Solar activity is declining very fast at the moment," Mike Lockwood, professor of space environmental physics at Reading University, UK, told New Scientist. "We estimate faster than at any time in the last 9300 years." Lockwood and his colleagues are reassessing the chances of this decline continuing over decades to become the first "grand solar minimum" for four centuries. During a grand minimum the normal 11-year solar cycle is suppressed and the sun has virtually no sunspots for several decades. This summer should have seen a peak in the number of sunspots, but it didn't happen..." (Image: NASA).
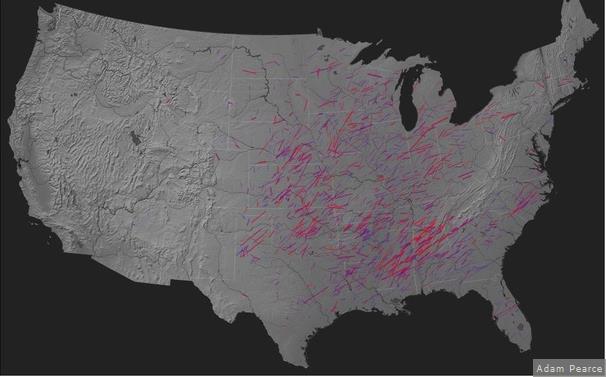
America's Most Violent Tornadoes Since 1950, Seen On One Blustery Map. Here's a clip from a fascinating article at The Atlantic Cities: "...The interactive visualization, available here for your geeking-out pleasure, was assembled by New York City technoartist Adam Pearce, who also did that wonderful presentation of 500 years of meteor spottings. Inspired by a similar model made by John Nelson, Pearce whipped up a map that gives the track and wind intensity for each of the twisters. While meteorologists have noted more than 21,000 tornadoes in the past 63 years, only long-lasting ones that traveled for more than 20 miles are shown here (just under 2,000). Fatter lines represent more powerful ones, and the tracks are approximate, as NOAA "only collects start and end locations – tornadoes do not actually travel in perfectly straight lines," explains Pearce..."

Graphic credit above: Adam Pearce.

Flood Insurance Is A Complex Problem That May Have A Simple Solution. Let the markets handle this vs. the federal government? Interesting idea, but what happens if a massive calamity wipes out a few of these private ventures? Here's a clip from a story at Insurance News Daily: "...There is a solution to the federal program’s problems that is beginning to gain attention, though it is somewhat unconventional. Some federal lawmakers argue that private insurers are capable of handling the risks associated with flood insurance coverage. Large insurance corporations certainly have the assets to offer coverage in an effective manner, but have little incentive to do so due to the potential of grievous loss. If the federal government could provide some degree of financial safety net for these companies, they may be willing to take on the risks associated with flood coverage, thereby alleviating some of the strain burdening the National Flood Insurance Program."
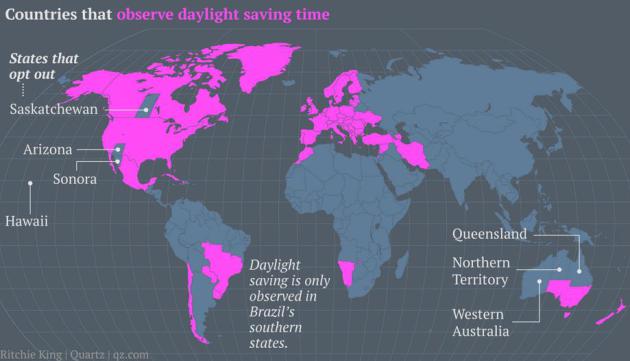
The U.S. Needs To Retire Daylight Savings And Just Have Two Time Zones - One Hour Apart. Quartz has the Op-Ed, here's the intro: "Daylight saving time ends Nov. 3, setting off an annual ritual where Americans (who don’t live in Arizona or Hawaii) and residents of 78 other countries including Canada (but not Saskatchewan), most of Europe, Australia and New Zealand turn their clocks back one hour. It’s a controversial practice that became popular in the 1970s with the intent of conserving energy. The fall time change feels particularly hard because we lose another hour of evening daylight, just as the days grow shorter. It also creates confusion because countries that observe daylight saving change their clocks on different days..."

America's First All-Electric School Bus Coming To California. EcoWatch has the story - here's a clip: "The first all-electric school bus could be picking up California students by 2014. Trans Tech Bus and Motiv Power Systems debuted the bus at the recent 2013 National Association for Pupil Transportation (NAPT) Annual Summit in Grand Rapids, MI. The two companies collaborated on the bus for the Kings Canyon Unified School District in the San Joaquin Valley of California. “An electric bus can save a school district about 16 gallons of fuel a day, or around $11,000 in fuel savings over a year, not to mention maintenance savings,” Trans Tech President John Phraner said..."

Photo credit above: "The Trans Tech/Motiv SST-e all-electric school bus can save a school district about 16 gallons of fuel a day, or around $11,000, over a year." Photo credit: PRNewsFoto/Motiv Power Systems.
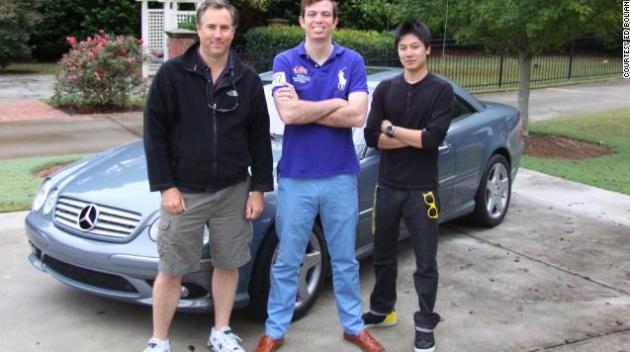
Man Drives Across U.S. In Under 29 Hours. My new hero. But wouldn't it have been easier to fly? Maybe not, come to think of it. CNN has the details on Cannonball II, a new U.S. record which may stand for a good, long while. Here's an excerpt: "...Beginning in 2009, about the time he started working for Lamborghini Atlanta, Bolian researched cars, routes, moon phases, traffic patterns, equipment, gas mileage and modifications. He went into preparation mode about 18 months ago and chose a Mercedes CL55 AMG with 115,000 miles for the journey. The Benz's gas tank was only 23 gallons, so he added two 22-gallon tanks in the trunk, upping his range to about 800 miles. The spare tire had to go in the backseat with his spotter, Dan Huang, a student at Georgia Tech, Bolian's alma mater. To foil the police, he installed a switch to kill the rear lights and bought two laser jammers and three radar detectors. He commissioned a radar jammer, but it wasn't finished in time for the trek..."

Photo credit above: "Dave Black, Ed Bolian and Dan Huang pose in front of the car they would use to attempt to break the record. Bolian is the leader and main driver, Black acted as the co-driver and Huang was the team's spotter - keeping an eye on the car's considerable technology while looking out for obstacles."


Climate Stories....

"First they ignore you, then they laugh at you, then they fight you, then you win."
 - Ghandi
Climate Change Seen Posing Risk To Food Supplies. Here's an excerpt of a Justin Gillis article at The New York Times: "...In a departure from an earlier assessment, the scientists concluded that rising temperatures will have some beneficial effects on crops in some places, but that globally they will make it harder for crops to thrive — perhaps reducing production over all by as much as 2 percent each decade for the rest of this century, compared with what it would be without climate change. And, the scientists say, they are already seeing the harmful effects in some regions..."
Experts Say Nuclear Power Needed To Slow Warming. The reason? Renewables are scaling up rapidly, but may not be able to provide enough energy fast enough to meet global (low-carbon) needs. Here's a snippet of a story from AP at KOTA News: "Some of the world's top climate scientists say wind and solar energy won't be enough to head off extreme global warming, and they're asking environmentalists to support the development of safer nuclear power as one way to cut fossil fuel pollution. Four scientists who have played a key role in alerting the public to the dangers of climate change sent letters Sunday to leading environmental groups and politicians around the world. The letter, an advance copy of which was given to The Associated Press, urges a crucial discussion on the role of nuclear power in fighting climate change...."

Do The Math: Fossil Fuel Investments Add Up To Climate Chaos. Here's an excerpt from an entry at Huffington Post: "...Now more than ever people need to demand that all financial institutions that we have entrusted with our money and welfare remove their money -- our money -- from investments in the fossil fuel industry. Make no mistake we are in a battle for the future with the past. The centuries-old fossil fuel industries have roots deep within our governments and other institutions. They know their days are numbered, they know their power is waning, but they will not go silently into the night. they will not give up their power without a fight. If governments will not bite the hand that feeds, if they will not free themselves from corporate sponsorship then we, the citizens, the concerned and morally driven individuals will have to take a stand. We will have to make sacrifices to challenge the deadly status quo. This is what history teaches us..."

Study: Storms Would Submerge Norfolk Naval Station. The Navy is paying attention to rising sea levels, worldwide, as reported in this story at PilotOnline.com; here's an excerpt: "...Average global temperatures have risen 2 degrees since the mid- to late 1800s, and sea levels have climbed a foot. With melting glaciers and ice sheets, the trend could speed up. In 2009, Titley compiled data for the Navy on what climate change means for the service. He was pleasantly surprised, he said, by how receptive the leadership was. Still, with costs that likely will climb into the trillions, the challenges of meeting the threat are formidable. Even if the Navy does little now, it can use the study findings to plan what needs to be done, said Titley, who retired from the Navy 13 months ago. "What is our backup if you lose Norfolk?" he asked. "What's plan B?...."

Photo credit above: "Retired Rear Admiral David W. Titley, who led the U.S. Navy's Task Force on Climate Change, delivers the President's Lecture Series speech at ODU on Wednesday, Oct. 30, 2013. Titley, who is director of the Center for Solutions to Weather and Climate Risk at Penn State University, gave a speech titled "The Evolving Understanding of Climate Risk: The Challenge that Won't Go Away." (Steve Earley | The Virginian-Pilot).
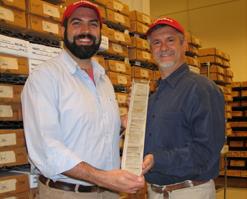
New Finding Shows That Climate Change Can Happen In A Geological Instant. This story at phys.org made me do a double-take. Remember, we don't know what we don't know. It's the "unknown unknowns" that worry climate scientists the most. Tipping points? Sudden swings into a new climate state? At the rate CO2 is building up in the atmosphere anything is possible in the years ahead. Here's an excerpt: "Rapid" and "instantaneous" are words geologists don't use very often. But Rutgers geologists use these exact terms to describe a climate shift that occurred 55 million years ago. In a new paper in the Proceedings of the National Academy of Sciences, Morgan Schaller and James Wright contend that a doubling in carbon dioxide levels, the surface of the ocean turned acideic in over a period of weeks or months and global temperatures rose by 5 degrees centigrade - all in the space of about 13 years. Scientists previously thought this process happened over 10,000 years..."

Photo credit above: "Morgan Schaller, James Wright, and the core sample that helped them understand what happened - and how fast it happened - 55 million years ago." Credit: James Wright, Rutgers University.
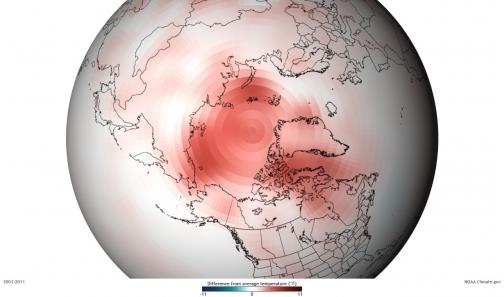
Last Time Arctic Was This Warm Was 120,000 Years Ago. Here's a headline that got my attention. Andrew Freedman has the story at Climate Central: here's an excerpt: "Average summer temperatures in the Eastern Canadian Arctic during the past 100 years are hotter than they have been in at least 44,000 years, and possibly as long as 120,000 years, according to a new study. The study of mosses emerging from beneath receding glaciers on Baffin Island — the world’s fifth-largest island located west of Greenland — confirms that rapid Arctic warming has already put parts of the region in new climatic territory. Arctic warming is transforming the Far North by melting sea and land ice, speeding spring snowmelt, and acidifying the Arctic Ocean. Arctic warming may even be redirecting the jet stream in the northern midlatitudes, making some types of extreme weather events more likely in the U.S. and Europe..."

Image credit above: "Departure from average of Arctic surface temperatures during the first decade of the 21st century, as compared to the 1971-2000 average. The map illustrates that no part of the Arctic experienced cooler-than-average conditions during this period." Credit: NOAA.
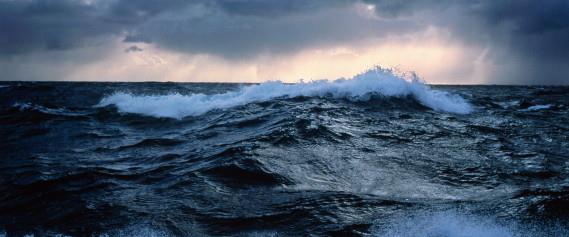
Pacific Ocean Warming At Fastest Rate In 10,000 Years. Here's a clip from Penn State climate scientist Michael Mann at Huffington Post: "Just how rapid is the current rate of warming of the ocean? There is an interesting new article by Rosenthal and collaborators in the latest issue of the journal Science entitled "Pacific Ocean Heat Content During the Past 10,000 Years" that attempts to address this question. The article compares current rates of ocean warming with long-term paleoclimatic evidence from ocean sediments. So how rapid is the ocean warming? Well, for the Pacific ocean at least, faster than any other time in at least the past 10,000 years. The study finds, specifically, that (to quote Columbia University's press release) the "middle depths [of the Pacific Ocean] have warmed 15 times faster in the last 60 years than they did during apparent natural warming cycles in the previous 10,000..."

Study: Northern Hemisphere Summers Now Warmest Of Last 600 Years. Rawstory.com has the article; here's the intro: "Summers in the northern hemisphere are now warmer than at any period in six centuries, according to climate research published on Wednesday in the science journal Nature. Harvard University researchers analysing evidence from Arctic tree rings, ice cores, lake sediments and thermometer records said recent warm temperature extremes in high northern latitudes “are unprecedented in the past 600 years” both for magnitude and frequency. “The summers of 2005, 2007, 2010 and 2011 were warmer than those of all prior years back to 1400,” they reported..."

Pacific Ocean Warming 15 Times Faster Than Before. USA Today has the story; here's the introduction: "Although the temperature of the Earth's atmosphere may have hit the "pause" button recently — with little global warming measured over the past few years — that hasn't been the case with the oceans. In a study out today in the journal Science, researchers say that the middle depths of a part of the Pacific Ocean have warmed 15 times faster in the past 60 years than they did during the previous 10,000 years..."

Saturday, November 2, 2013

WNTV Blog for AM Sunday: Fall Back, Windy Weather and Snow Chances


Daylight SAVING Time Ends
You may feel a little more refreshed with the extra hour of sleep on Sunday. However, those with young kids (like myself) probably won't see any benefit as they tend to wake up super early anyway. The good news is that we get an extra hour of light in the morning, but it'll be dark when you get home from work now.

(image courtesy Louisville.com)


Entering the Season of "SAD"
The lack of daylight can take a toll on your psyche. "SAD" or Seasonal Affective Disorder is real and can explain why you might be feeling so irritable as we head through the winter months. Here's a write-up about SAD from the Mayo Clinic.

"Seasonal affective disorder (also called SAD) is a type of depression that occurs at the same time every year. If you're like most people with seasonal affective disorder, your symptoms start in the fall and may continue into the winter months, sapping your energy and making you feel moody. Less often, seasonal affective disorder causes depression in the spring or early summer.
Treatment for seasonal affective disorder includes light therapy (phototherapy), psychotherapy and medications. Don't brush off that yearly feeling as simply a case of the "winter blues" or a seasonal funk that you have to tough out on your own. Take steps to keep your mood and motivation steady throughout the year."

See more HERE:

(Image courtesy: CartoonStock.com)


Halloween Hangover?
I don't know about you, but I'm still stuck in a candy coma. I can't seem to get my fingers out of my kids' candy stash... UGH!

Kidshealth.org has a few good tips on how to get rid of or at least chip away at that mountain of sugar!

"Once you have a couple of Halloweens under your belt, you start to know the deal. Like which of your neighbors give out oversized chocolate bars and which ones greet you with toothbrushes.
But you also start to realize something else: That even though it's fun to own a mountain of candy, it's probably not the best idea to eat it all.
So this year, after sorting through your favorites, why not find something else to do with the rest? We've got 15 awesome ideas — from selfless to the silly. Give them a try and your teeth (and your dentist!) will thank you."

See ideas HERE:


SPOOKY Forecast
This is too good not to share... WCHS TV out of Charleston, WV had a special guest during their weather forecast. HA! Good one!!

See the full forecast HERE:


Average November Sunshine
This is interesting, according to CurrentResults.com (Mean hours of sunshine calculated from 1961 to 1990. The other data are averages taken from years of weather watching.), several cities from the Midwest/Great Lakes and the coastal communities of the Pacific Northwest see the least amount of sunshine during the month of November. It is said that for some locations, November IS the cloudiest month of the year.

See more HERE:


Average November Snowfall
How about average November snowfall? Here's a look from CurrentResults.com (Data: 1981 to 2010 from NOAA's NCDC)

See more HERE:


American's 25 Coldest Cities
Ever wondered what some America's coldest cities are? TheDailyBeast has Fairbanks, AK at the #1 spot. In 2009, the average winter temperature was -0.6F and 39% of the days there was snow. Minneapolis is #16 - in 2009 the average winter temperature was 22.8F. 35% of the days there was snow.


Not So Cold in Alaska
October was VERY warm for folks in Alaska. Here's a blurb from ClimateCentral.org:

"According to the National Weather Service in Fairbanks, rain in the city is rare after October 20, yet it rained there on Oct. 28 with no snow on the ground, an occurrence that “appears to be unprecedented in more than a century of weather observations,” the NWS said in a note on its Facebook page. Temperatures in the 50s at Eielson Air Force Base and Fort Greely were the warmest on record for so late in the fall."

Read more HERE:

(Image Courtesy: WeatherBell Analytics)


Temperate Outlook For Mid November
Here's the 6 to 10 day temperature outlook, which shows the U.S. divided in it's temperature profile. From November 6th to the 11th, there appears to be a warm bias in the east, while the west remains cool.


Weather Outlook
There are a couple of systems that we'll have to keep an eye on over the next few days. The first creates kind of a windy situation for central part of the country on Sunday. Take a look at the big wind field setting up on Sunday. Winds from south to north (Texas to Minnesota) could gust to 30mph+ by the PM hours.


Sunday Wind Headlines
The National Weather Service has issued a WIND ADVISORY for areas shaded in tan below. These are areas that could see winds up to 40mph+


Next Storm by Midweek
Here's our next storm that looks to develop around midweek in the central part of the country. Interestingly, it looks like the temperature profile looks warm enough for mostly rain, except for places along the far northern edge of the system, which could see a little slush.


Snowfall Potential Thru Midweek
Here's an early look at potential snowfall thru midweek. It doesn't look like much in the central part of the country, but there certainly could be some snow accumulation from some areas of the Central Plains to the Upper Mississippi Valley. The higher elevation in the Pacific Northwest could certainly get a good dump!


Winter Weather Headlines
There are a number of winter weather headlines that have been posted in the Northwest thru Sunday for as much as a foot or more of snow in the mountains.


Precipitation Potential
According to NOAA's HPC, the precipitation forecast thru PM Thursday shows a decent amount of precipitation potential. Again, most of this looks like rain (possibly thunder in the central/southern part of the country).


Thanks for checking in, have a great rest of your weekend!
Don't forget to follow me on Twitter @TNelsonWNTV

Friday, November 1, 2013

Mild Bias Into Mid-November Eastern USA (odds of being hit by a deer much higher than being struck by a tornado - arctic warmer than anytime in last 120,000 years)

1 in 167. Odds of an American driver hitting a deer over the next 12 months. Source: State Farm and The New York Times; details below. Image: WeatherNation TV.


Erratic November

November should be medicated. It's a manic month, capable of everything from 70s to subzero - blizzards to lukewarm swoons of Indian Summer.

According to NOAA data since 1980 mean snowfall for November is 9.3 inches, making it the 4th snowiest month of the winter season. Novembers since 2000 have brought an average of 4.1 inches for the Twin Cities, but snowfall numbers in November aren't a good proxy for the winter to come.
Last November less than an inch fell. Easy winter right? Nearly 67 inches later, with slush piling up in May, most Minnesotans begged to differ.

NOAA NCEP's CFS model is printing out significant snow by mid-November, but at this point I'm very skeptical. That said, look for a big temperature tumble right before Thanksgiving. Details below.
A fine late fall weekend is shaping up - highs near 50F today, low 50s Sunday with a stiff breeze. Showers develop on Monday, a cold steadier rain Tuesday, possibly mixing with wet snow over central Minnesota.

Highs hold in the 40s much of next week, another stab at 50s the weekend of November 9-10. Beyond that the crystal ball gets murky.

Snow tires and driveway stakes will remain optional through at least November 12.

* image above: fungram.com.

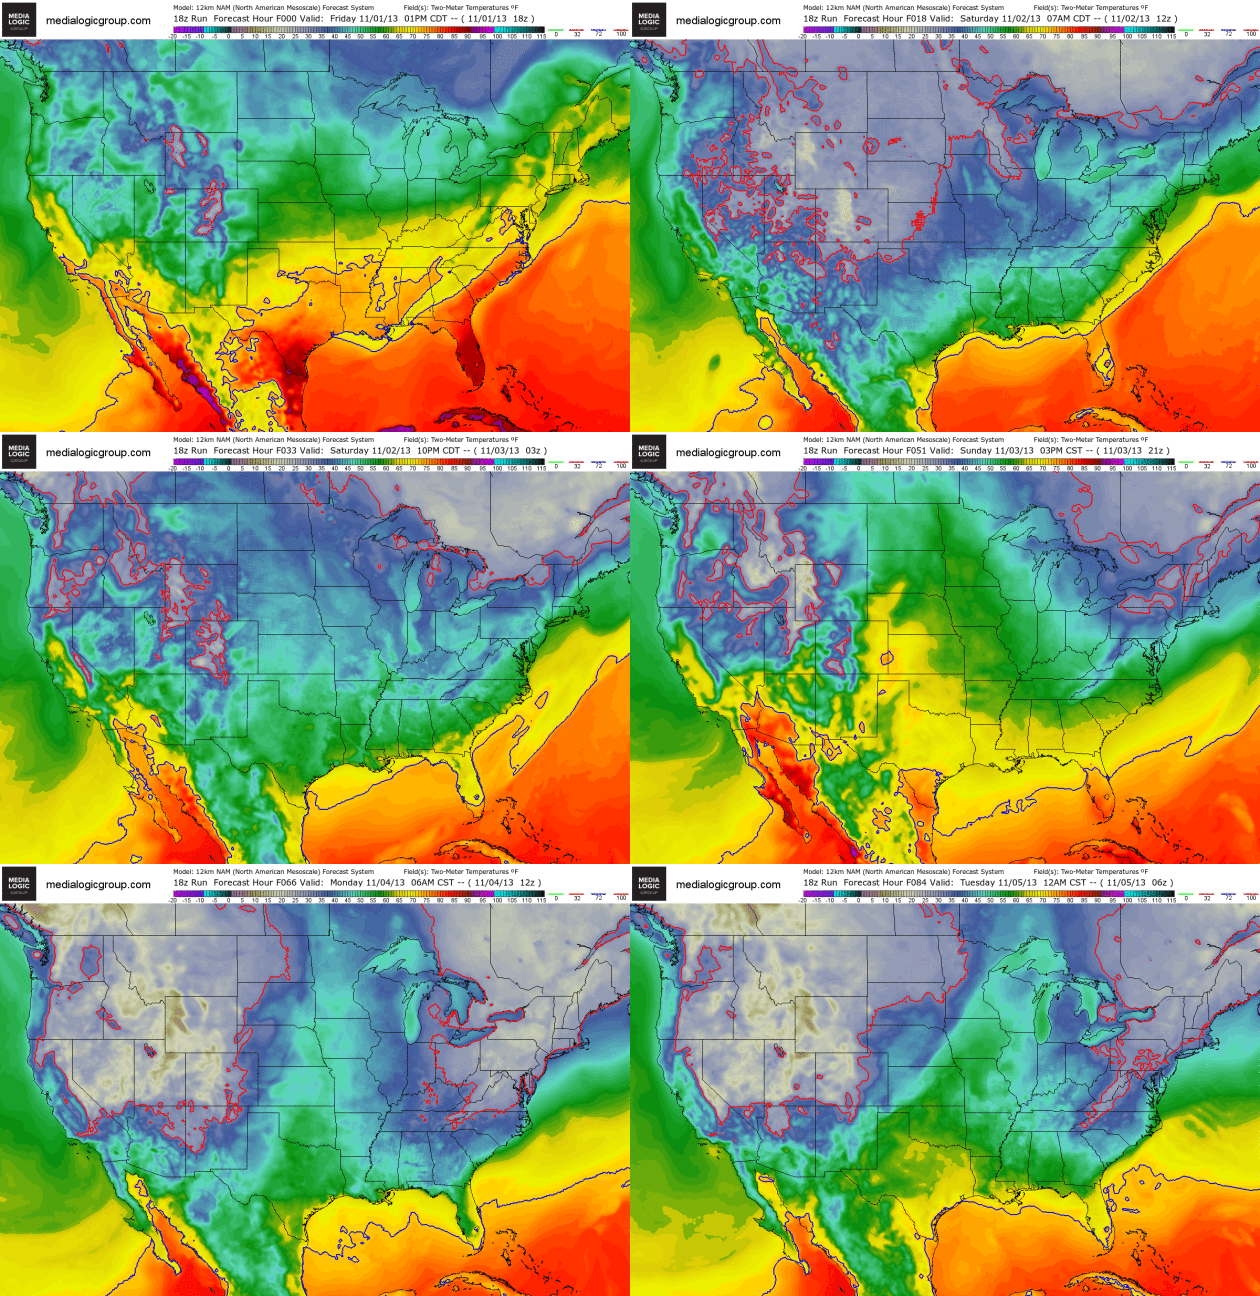
Canadian Infiltration. Nothing arctic is brewing (yet), but after a balmy Friday New England and the Mid Atlantic states chill down today, while temperatures moderate slightly over the Great Lakes and Upper Midwest, the western USA still trending chillier than average. The solid red line denotes the 32F isotherm. 12km NAM forecast 2-meter temperatures into Monday night courtesy of NOAA and Ham Weather.

Nice To Be (Nearly) Average. Highs push well into the 40s today, probably topping 50F in the Twin Cities Sunday before cooling down early next week. Another southern storm arrives with rain Monday and much of Tuesday, possibly ending as a little slushy snow by Tuesday night, although right now we don't expect significant amounts. ECMWF data above shows another temperature rebound with low 50s possible again next weekend. Graph: Weatherspark.

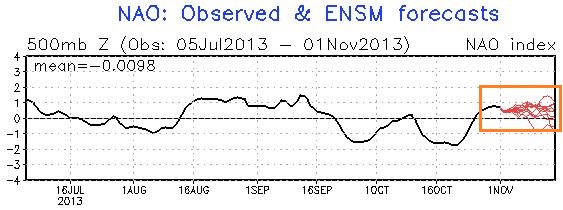
Mild Bias Into Mid-November. The North Atlantic Oscillation (NAO) is trending milder than average looking out 10-12 days, suggesting average or slightly milder than average temperatures through much of the second week of November. Graph: NOAA.

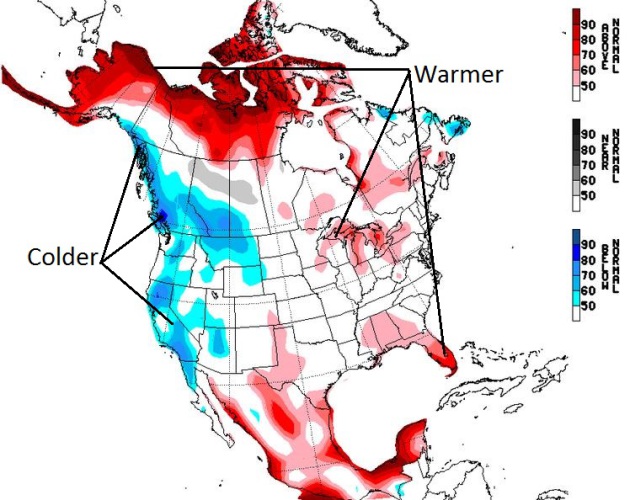
NAEFS Model. Alaska has been unusually warm since October, and that unusually warm bias continues from Alaska into Canada's Arctic region, with a (slight) mild bias from the Great Lakes into the Southeast, while the west trends cooler between November 9-15.

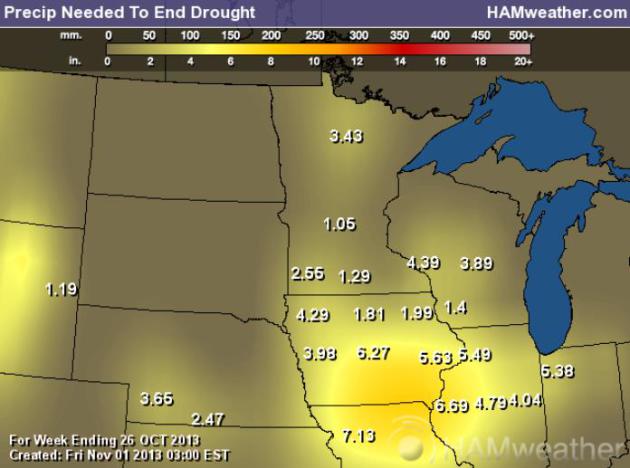
Precipitation Needed To End Drought. We're making progress after a wetter-than-average October over the Upper Mississippi Valley. A month ago much of Minnesota was running a 3-5" rainfall deficit, now that's down to 1-2" over most central and southern counties. Severe to extreme drought remainds over southern Iowa and northern Missouri into west central Illinois, with a 5-7" rainfall shortfall. Map: NOAA and Ham Weather.

Deer Mating Season: Drivers Beware. Here's an excerpt of a timely reminder at The New York Times: "It’s the deadliest time of the year for deer, which also pose a particular danger to motorists in autumn with the arrival of the mating and hunting seasons. Nearly half of vehicle accidents involving white-tail deer occur from October to December, according to Chad Stewart, a deer research biologist at the Indiana State Division of Fish and Wildlife..." (Image above: KARE-11).

Blood Pressure And The Onset Of Winter. Here's an excerpt of Dr. Mark Seeley's WeatherTalk Newsletter that caught my eye this week: "Blood pressure generally is higher in the winter and lower in the summer. That's because low temperatures cause your blood vessels to narrow ­ which increases blood pressure because more pressure is needed to force blood through your narrowed veins and arteries. In addition to cold weather, blood pressure may also be affected by a sudden change in weather patterns, such as a weather front or a storm. Your body ­ and blood vessels ­ may react to abrupt changes in humidity, atmospheric pressure, cloud cover or wind in much the same way it reacts to cold. These weather-related variations in blood pressure are more common in people age 65 and older..." (Image: Steve Burns).

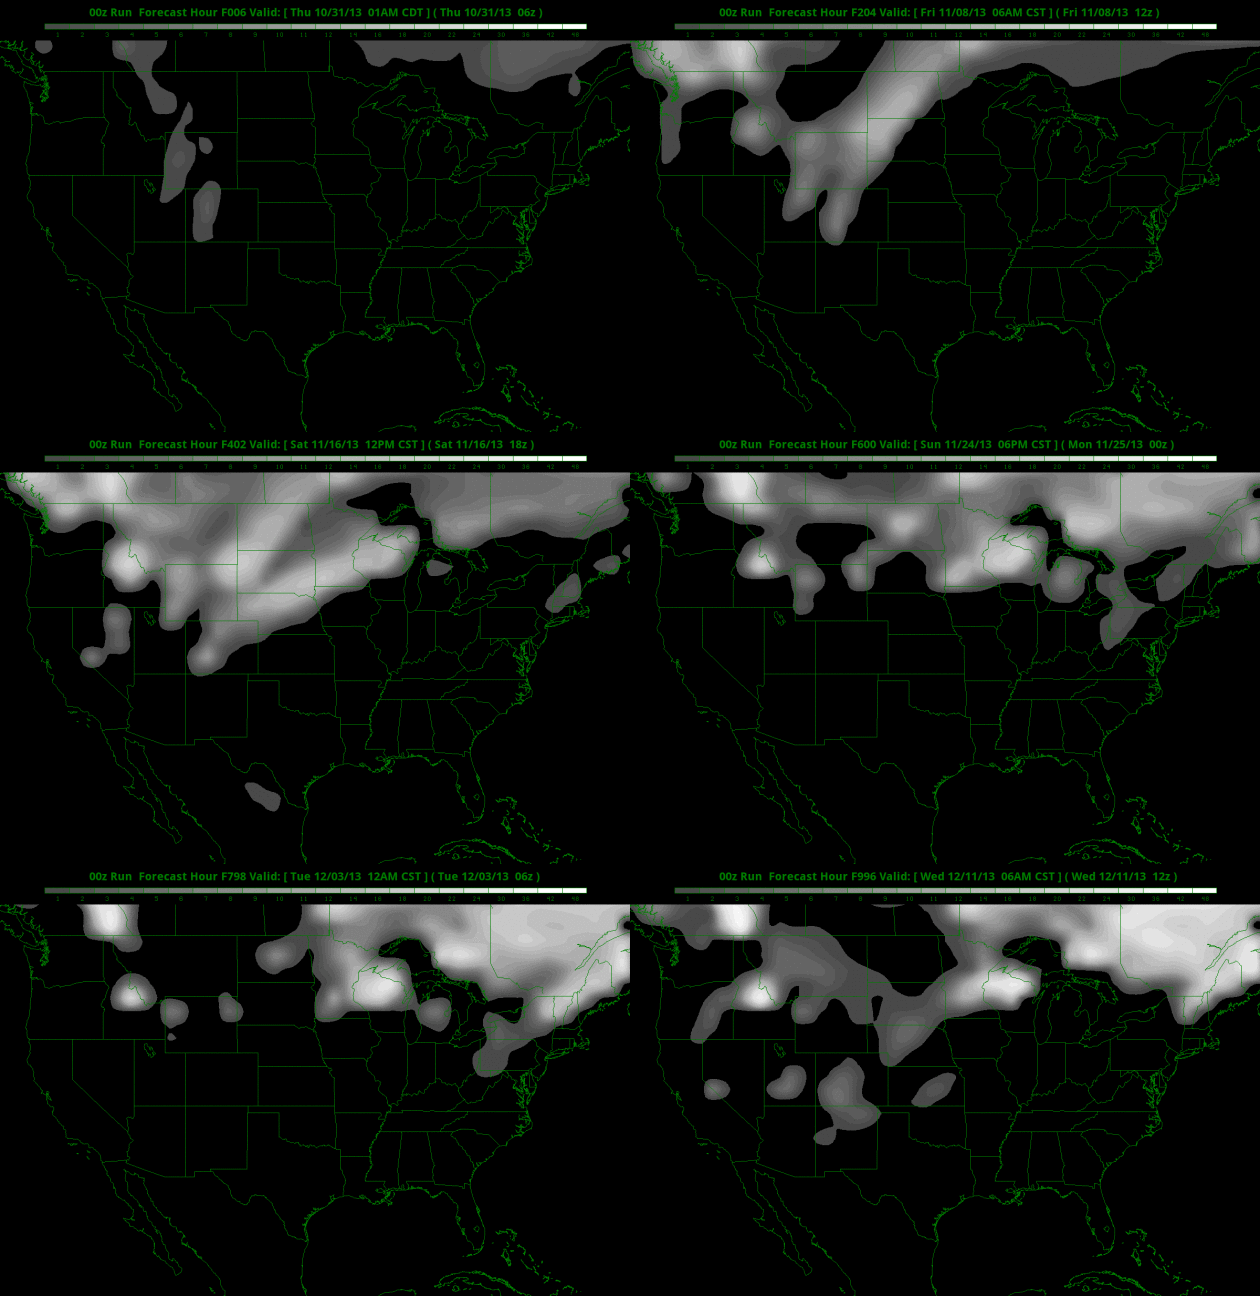
Just For Laughs And Giggles. Here is predicted snowcover for the USA through December 11, based on NOAA NCEP's CFS (Climate Forecast System). I know, it's interesting to look at, but I'm not (yet) convinced there's any skill here. It shows significant snow reaching Minnesota by November 13-14. I'm skeptical but suspending my disbelief until I see a few more runs (looking for some level of continuity from run to run). Confidence level: 1 (on a scale of 1 to 10). Model animation: Ham Weather.

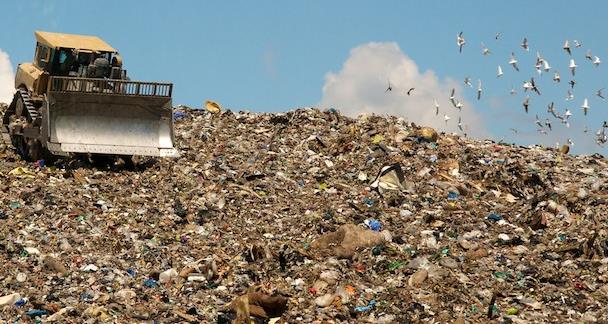
When Will We Hit Peak Garbage? Smithsonian.com has an interesting read - here's the introduction: "In 2013, if you’re someone who cares about the environment, your first and foremost concern is probably climate change. After that, you might worry about things like radioactive contamination, collapsing honeybee colonies and endangered ecosystems, among other contemporary environmental perils that fill recent news headlines. But a number of researchers in the field are focused on a problem that has faded out of the news cycle: the piles of garbage that are growing around the world. A recent World Bank report projected that the amount of solid waste generated globally will nearly double by the year 2025, going from 3.5 million tons to 6 million tons per day. But the truly concerning part is that these figures will only keep growing for the foreseeable future. We likely won’t hit peak garbage—the moment when our global trash production hits its highest rate, then levels off—until sometime after the year 2100, the projection indicates, when we produce 11 million tons of trash per day..."

Photo credit above: "Projections indicate that our rate of trash production will keep rising past 2100—a concern, because waste can be a proxy for all other environmental stresses." Image via Flickr user Jritch77.

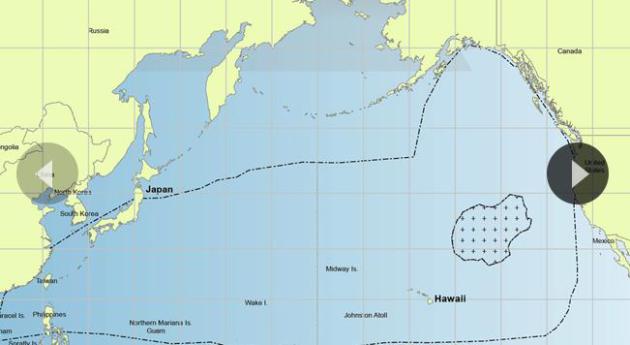
Japan's "Toxic" Monster Creeping Towards U.S. Speaking of garbage - debris from Japan's massive tsunami in 2011 is pushing across the Pacific, as reported by Fox News; here's the intro: "An enormous debris field is creeping toward the U.S. in the wake of the massive earthquake and tsunami that shook Japan in 2011, killing nearly 16,000 people and launching 1.5 million tons of floating objects into the sea. That most concentrated part of the junk field is easily broader than Texas and centered approximately 1,700 miles off the Pacific coast, between California and Hawaii, although the National Oceanic and Atmospheric Administration (NOAA) hasn't published more precise estimates. The agency estimates that the trash overall is scattered across an area in the ocean about three times the size of the continental United States..."

Hold The Spice Please. I hope you're not eating as you read this story from Quartz; here's an excerpt: "If you use everyday spices such as pepper, parsley and paprika, you could be sprinkling more on your food than you bargained for. Twelve percent of spices imported to the US are soiled with insects (both live and dead), animal excrement, rodent hairs and a range of other unappetizing materials, according to a new report by the US Food and Drug Administration..."

Photo credit above: "Spice girls." Reuters/Parth Sanyal.


Climate Stories....

New Finding Shows That Climate Change Can Happen In A Geological Instant. This story at phys.org made me do a double-take. Remember, we don't know what we don't know. It's the "unknown unknowns" that worry climate scientists the most. Tipping points? Sudden swings into a new climate state? At the rate CO2 is building up in the atmosphere anything is possible in the years ahead. Here's an excerpt: "Rapid" and "instantaneous" are words geologists don't use very often. But Rutgers geologists use these exact terms to describe a climate shift that occurred 55 million years ago. In a new paper in the Proceedings of the National Academy of Sciences, Morgan Schaller and James Wright contend that a doubling in carbon dioxide levels, the surface of the ocean turned acideic in over a period of weeks or months and global temperatures rose by 5 degrees centigrade - all in the space of about 13 years. Scientists previously thought this process happened over 10,000 years..."

Photo credit above: "Morgan Schaller, James Wright, and the core sample that helped them understand what happened - and how fast it happened - 55 million years ago." Credit: James Wright, Rutgers University.

Last Time Arctic Was This Warm Was 120,000 Years Ago. Here's a headline that got my attention. Andrew Freedman has the story at Climate Central: here's an excerpt: "Average summer temperatures in the Eastern Canadian Arctic during the past 100 years are hotter than they have been in at least 44,000 years, and possibly as long as 120,000 years, according to a new study. The study of mosses emerging from beneath receding glaciers on Baffin Island — the world’s fifth-largest island located west of Greenland — confirms that rapid Arctic warming has already put parts of the region in new climatic territory. Arctic warming is transforming the Far North by melting sea and land ice, speeding spring snowmelt, and acidifying the Arctic Ocean. Arctic warming may even be redirecting the jet stream in the northern midlatitudes, making some types of extreme weather events more likely in the U.S. and Europe..."

Image credit above: "Departure from average of Arctic surface temperatures during the first decade of the 21st century, as compared to the 1971-2000 average. The map illustrates that no part of the Arctic experienced cooler-than-average conditions during this period." Credit: NOAA.

Pacific Ocean Warming At Fastest Rate In 10,000 Years. Here's a clip from Penn State climate scientist Michael Mann at Huffington Post: "Just how rapid is the current rate of warming of the ocean? There is an interesting new article by Rosenthal and collaborators in the latest issue of the journal Science entitled "Pacific Ocean Heat Content During the Past 10,000 Years" that attempts to address this question. The article compares current rates of ocean warming with long-term paleoclimatic evidence from ocean sediments. So how rapid is the ocean warming? Well, for the Pacific ocean at least, faster than any other time in at least the past 10,000 years. The study finds, specifically, that (to quote Columbia University's press release) the "middle depths [of the Pacific Ocean] have warmed 15 times faster in the last 60 years than they did during apparent natural warming cycles in the previous 10,000..."

Study: Northern Hemisphere Summers Now Warmest Of Last 600 Years. Rawstory.com has the article; here's the intro: "Summers in the northern hemisphere are now warmer than at any period in six centuries, according to climate research published on Wednesday in the science journal Nature. Harvard University researchers analysing evidence from Arctic tree rings, ice cores, lake sediments and thermometer records said recent warm temperature extremes in high northern latitudes “are unprecedented in the past 600 years” both for magnitude and frequency. “The summers of 2005, 2007, 2010 and 2011 were warmer than those of all prior years back to 1400,” they reported..."

Pacific Ocean Warming 15 Times Faster Than Before. USA Today has the story; here's the introduction: "Although the temperature of the Earth's atmosphere may have hit the "pause" button recently — with little global warming measured over the past few years — that hasn't been the case with the oceans. In a study out today in the journal Science, researchers say that the middle depths of a part of the Pacific Ocean have warmed 15 times faster in the past 60 years than they did during the previous 10,000 years..."

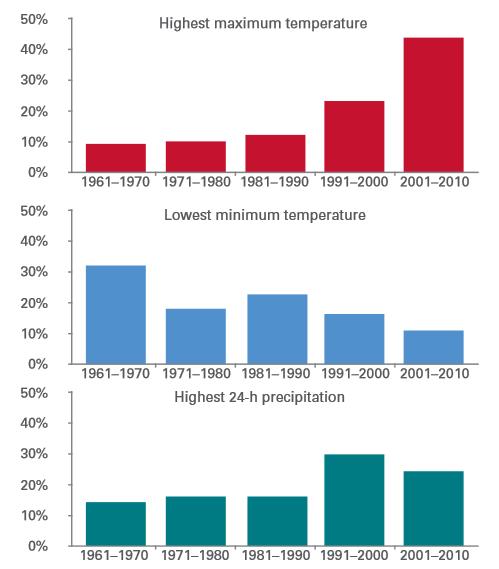
Global Trends Since 1960. The chart above, courtesy of the WMO, World Meteorological Organization, shows absolute country records of the daily maximum and minimum temperature and 24-hour total precipitation in the last five decades.

White House Will Focus On Climate Shifts While Trying To Cut Greenhouse Gases. Adaptation and resilience will be big themes in the years and decades to come; here's an excerpt from The New York Times: "...White House aides said President Obama would sign an executive order on Friday morning directing federal agencies to make it easier for states and communities to build resilience against storms, droughts and other weather extremes. For instance, when federal money is being spent on projects like roads, bridges, flood control and many others, the plan would encourage greater attention to the likely climate conditions of the future, which might require making the structures stronger or larger..."

Inconvenient Truth-Tellers. Climate science is under assault, because there is a mountain of cash at stake, many trillions of dollars of carbon still in the ground. Here's a clip from a story at The Association for Psychological Science: "Throughout history, scientists have found themselves the subject of scorn, slander, ridicule and even violence when their discoveries have failed to mesh with authoritative doctrine or public sentiments. When an ancient Muslim cleric was offended by Persian doctor Rhazes’s book on medicine, he had the man beaten with his own manuscript until he was blind. After Galileo’s telescope challenged the belief that the sun orbited the earth, the Holy Office of the Inquisition accused the astronomer of heresy and sentenced him to house arrest. Today, most scientists are able to report their findings without worrying about draconian sentences from the state. But they still face the enmity of people who simply don’t believe the empirical results or who have a vested interest in the status quo..."

The Moral Imperative Of Hope And The Wasteland Of Climate Cynicism. Yes, this topic elicits cynism, anger, denial, disgust and despair, no question. Beyond the science there's an emotional and psychological component to climate change. Here's a clip from an interesting read at The Climate Psychologist: "...It is understandable that people would be cynical about climate change. The pain of reality is very great. It makes sense that people would pack their hearts with ice; numbing their fear and despair. This also explains why climate cynics get angry at people, such as myself, who carry a message of hope. Hope threatens the defense. Some of the ice starts to melt, and raw emotions start to come through. “You are naïve!” They tell me, trying to maintain the safe, numb feeling “You are a fool.” People cynical of romance are similarly negative towards those in love; its painful to be reminded of what you have forsaken, so they attack the reminder..."

Naomi Klein: How Science Is Telling Us All To Revolt. Here's an excerpt of a post at New Statesman from Naomi Klein: "...We probably shouldn’t be surprised that some climate scientists are a little spooked by the radical implications of even their own research. Most of them were just quietly doing their work measuring ice cores, running global climate models and studying ocean acidification, only to discover, as the Australian climate expert and author Clive Hamilton puts it, that they “were unwittingly destabilising the political and social order”. But there are many people who are well aware of the revolutionary nature of climate science. It’s why some of the governments that decided to chuck their climate commitments in favour of digging up more carbon have had to find ever more thuggish ways to silence and intimidate their nations’ scientists..."

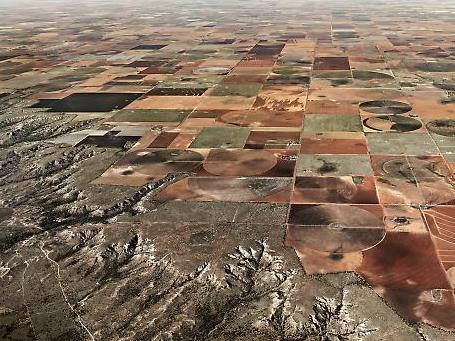
Photo credit above: "Waste land: large-scale irrigation strips nutrients from the soil, scars the landscape and could alter climatic conditions beyond repair." Image: Edward Burtynsky, courtesy Nicholas Metivier Gallery, Toronto/ Flowers, London, Pivot Irrigation #11 High Plains, Texas Panhandle, USA (2011)